The CPU/Memory monitor has two parts of monitoring, a CPU and a Memory part. Both parts are checked frequently in a specified check interval. By default this interval is configured to 60 seconds so a check is done after every 1 minute. Both CPU and memory part can be disabled and enabled. The service becomes useless if you disable both parts.
Note for Windows NT4 users: This service uses the WMI (Windows Management Instumentation) to query CPU and memory utilization. By default WMI is not installed on NT4 but it can be obtained and installed from here.
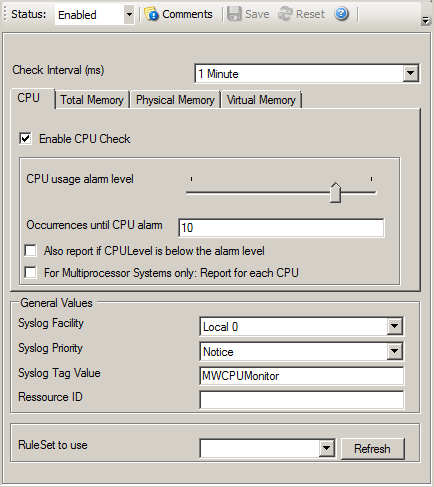
CPU/Memory Monitor Properties
You can see a series of tabs at the top of screen shot above, namely CPU, Total Memory, Physical Memory and Virtual Memory.
CPU
When you click CPU tab, you are shown the options as shown in the screen shot above and explained below:
Enable CPU Check
If this option is checked then it allows you to monitor the CPU.
CPU usage Alarm level
If the CPU usage reaches this level, an event is generated internally. Depending on how the occurences value is configured, an Information Unit is generated.
Note: this value is in terms of percentage.
Occurences until alarm is raised
Defines how often the CPU usage level has to occur in a row until an event is raised.
Also report if CPU level is below the Alarm level
If this option is checked it generates an Information Unit during each run whether it is below the alarm level or above. This option is useful for statistics and debugging.
For Multiprocessor Systems only: Report for each CPU
This option can only be used if you have a Multiprocessor System. When this option is checked the CPU usage is analyzed for each CPU and for the whole amount of CPU usage.
Total Memory
When you click Total Memory tab, you are shown the options as shown in the screen shot below:
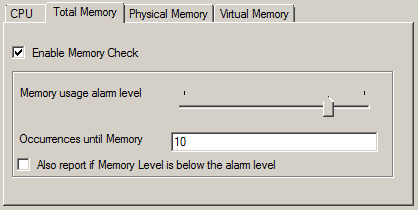
Total Memory Properties
Enable Memory Check
If this option is checked then it allows you to monitor the memory.
Memory usage Alarm level
Defines the alarm level for the memory usage. Note that virtual and physical memory are calculated together.
Note that this value is in terms of percentage.
Occurences until alarm is raised
Defines how often the memory usage has to be over the memory usage alarm level in a row.
Also report if Memory level is below the Alarm level
This also generates an event if the memory usage is below the alarm level. A useful option for testing and debugging.
Physical Memory
When you click Physical Memory tab, you are shown the options as shown in the screen shot below:
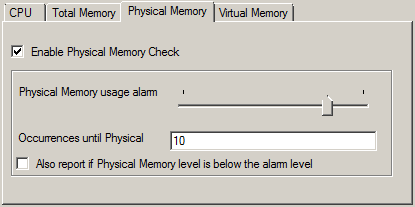
Physical Memory Properties
Enable Physical Memory Check
If this option is checked then it allows you to monitor the physical memory.
Physical Memory usage Alarm level
Defines the alarm level for the physical memory usage.
Note that this value is in terms of percentage.
Occurences until alarm is raised
Defines how often the physical memory usage has to be over the physical memory usage alarm level in a row.
Also report if Physical Memory level is below the Alarm level
This also generates an event if the physical memory usage is below the alarm level. A useful option for testing and debugging.
Virtual Memory
When you click Virtual Memory tab, you are shown the options as shown in the screen shot below:
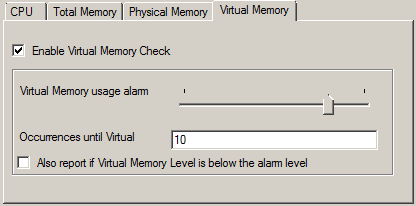
Virtual Memory Properties
Enable Virtual Memory Check
If this option is checked then it allows you to monitor the virtual memory.
Virtual Memory usage Alarm level
Defines the alarm level for the virtual memory usage.
Note that this value is in terms of percentage.
Occurences until alarm is raised
Defines how often the virtual memory usage has to be over the virtual memory usage alarm level in a row.
Also report if Virtual Memory level is below the Alarm level
This also generates an event if the virtual memory usage is below the alarm level. A useful option for testing and debugging.
Check Interval
The CPU/Memory Monitor runs periodically. This specifies, how often it should run. Please note that the CPU / Memory Monitor waits the configured amount of time after the current run is finished. The time is the delay in milliseconds.
General Values
In General Values group box, you can see different fields discussed below:
The Syslog facility to be assigned to events created by this service. Most useful, if the message shall be forwarded to a Syslog server.
The Syslog priority to be assigned to events created by this service. Most useful if the message shall be forwarded to a Syslog server.
The Resource ID to be assigned to events created by this service. Most useful if the message shall be forwarded to a Syslog server.
The Syslog tag value to be assigned to events created by this service. Most useful if the message shall be forwarded to a Syslog server.
Name of the rule set to be used for this service. The Rule Set name must be a valid Rule Set.