Step-By-Step Guides
Article created 2004-09-14 by Timm Herget.
Last Updated 2011-07-27 by Florian Riedl.
Database Logging with MSSQL
This is a very quick step-by-step guide. It essentially is a step in multiple
configurations. You can refer to this guide whenever you need to add
database logging to one of your services.
Though we need to add some sidenotes for issues with 32/64bit systems. If you have a operating system
which is a 64bit edition, the installer for EventReporter, MonitorWare Agent or WinSyslog will automatically
install the appropriate binaries (64bit) on the system. The problem is now, that generally the 32bit drivers for ODBC
would work fine, but 64bit applications can only use drivers that are for 64bit as well. Therefore it is best
to make sure, that you have installed the 64bit ODBC drivers as well. This does only apply for MSSQL and MySQL databases. If you are trying to use a JET database with Adiscon’s products on a 64bit system, you’re in bad luck, since there are no 64bit ODBC drivers available.
MSSQL Enterprise Manager
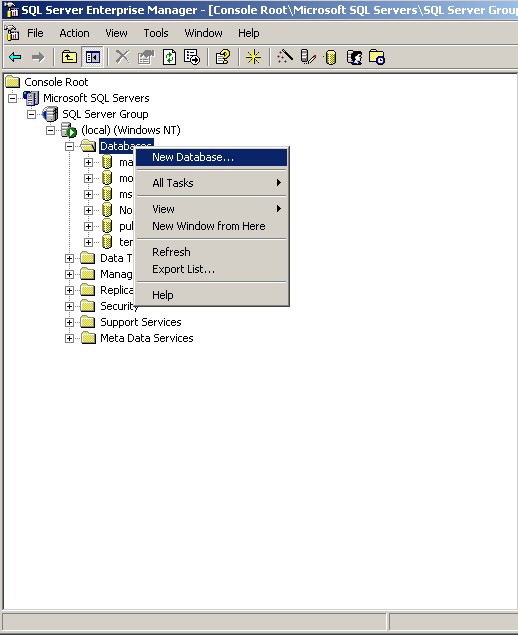
1. To create a new Database, open up the Microsoft SQL Enterprise Manager.
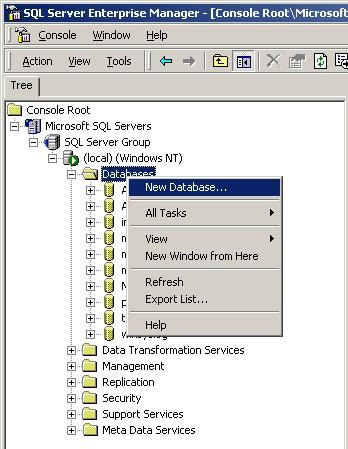
2. Right-click on “Databases” and select “New Database”.
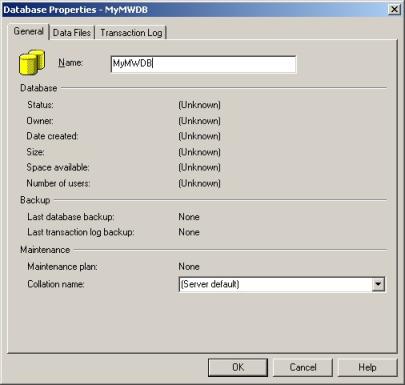
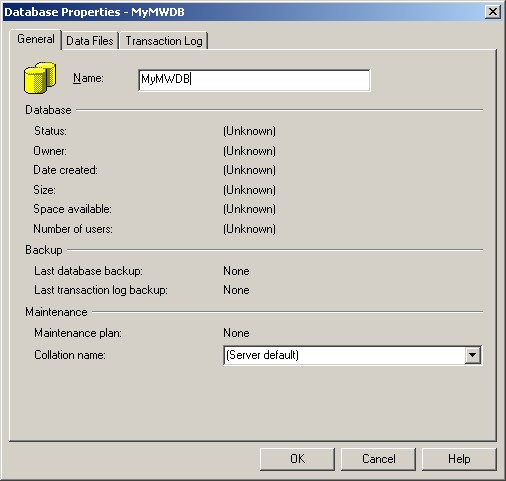
3. Select a Database Name there and click “OK”.
ODBC Data Source Administrator
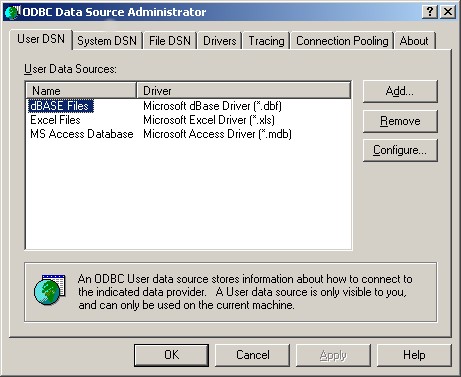
After you created the new Database, go to the Control Panel -> Administrative Tools and open up “Data Sources (ODBC)”.
The following Window will appear:
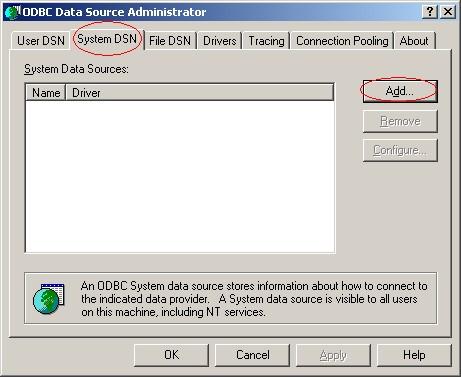
4. Click on “System DSN” and then “Add…”.
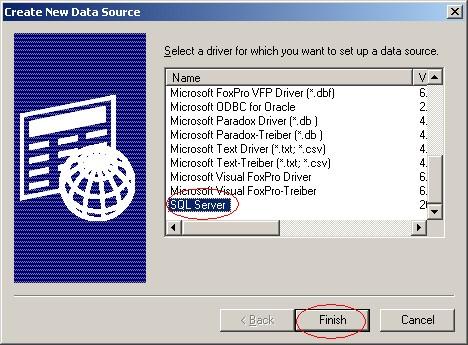
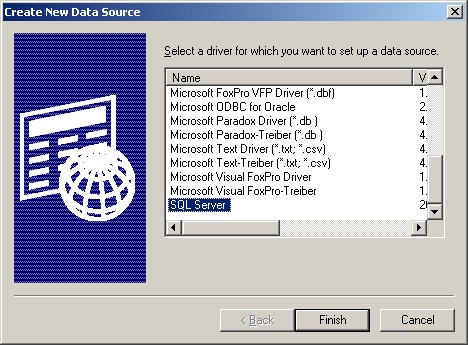
5. Select “SQL Server” as Driver from the List and click “Finish”.
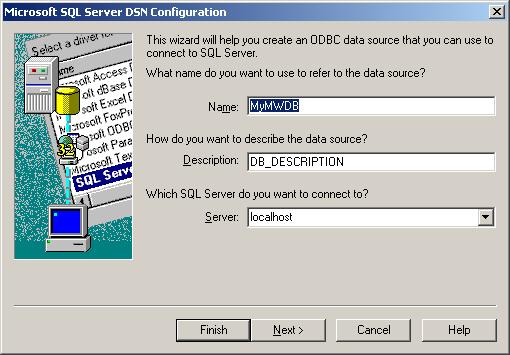
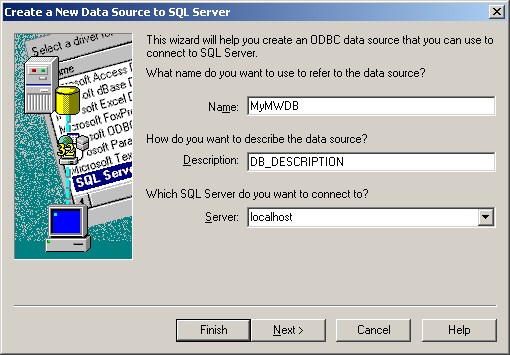
6. Choose a Datasource Name, Description and select the Server where the Database is. In our example we use “localhost”.
Click on “Next”.
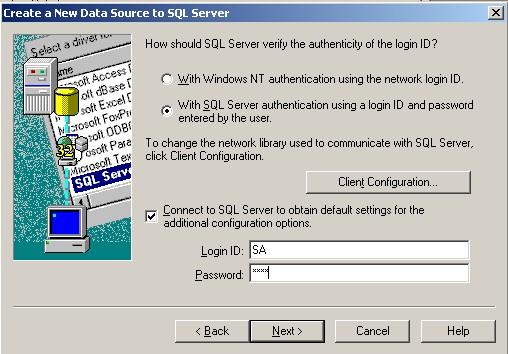
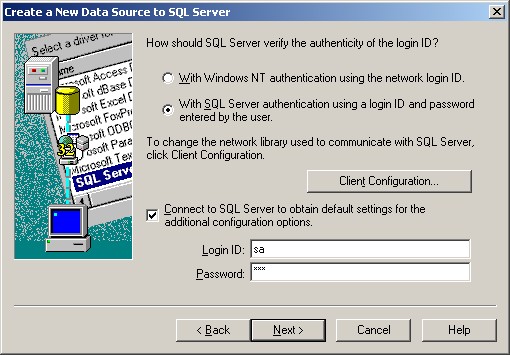
7. Select “SQL Server Authentication” and type in your MSSQL Login ID and Password. Click on “Next”.
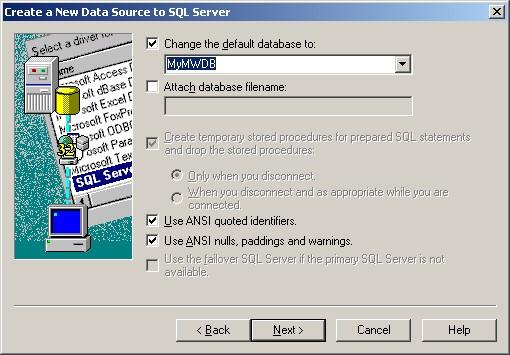
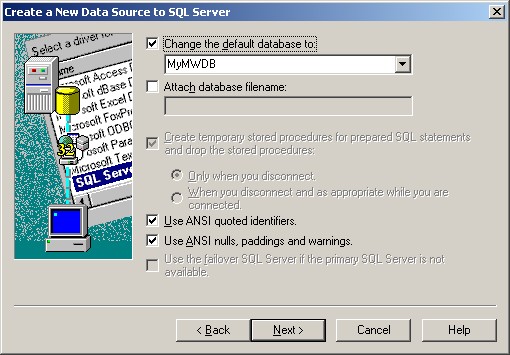
8. Select “Change the default Database to:” and choose your new created Database, in our example we use “MyMWDB”. Click on “Next”.
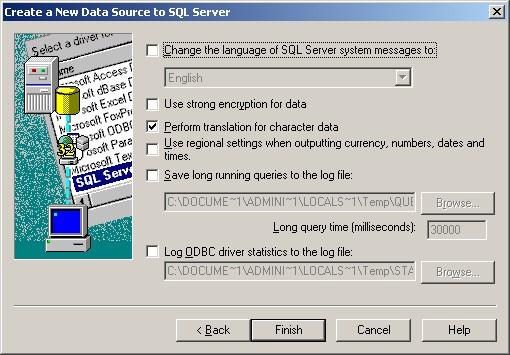
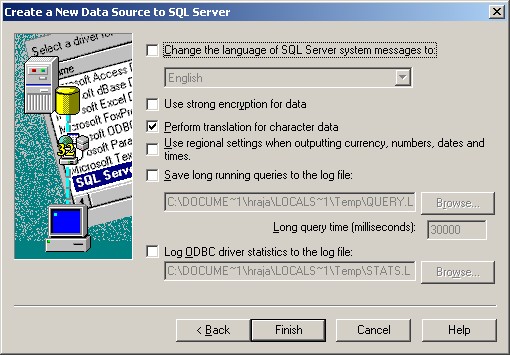
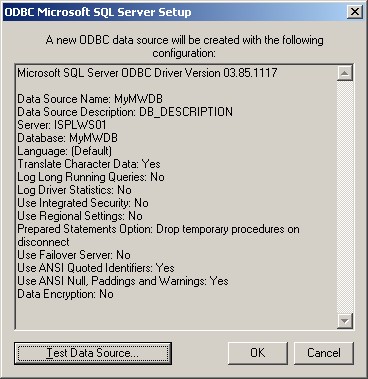
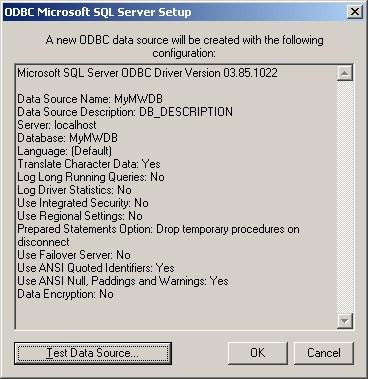
9. Leave all at default settings and click “Finish”, a test Window will appear:
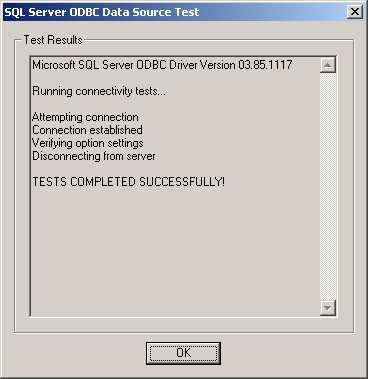
10. Click on “Test Data Source”, normally the following Window should be displayed:
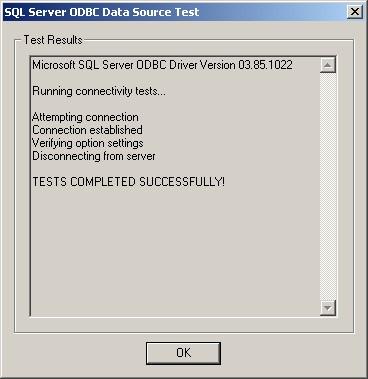
11. If not, go back and check your Settings, if yes, Click “OK” and exit the System-DSN Wizard.
Monitor Ware Line Product
12. To define a new rule set, right click “Rules”. A pop up menu will
appear. Select “Add Rule Set” from this menu.
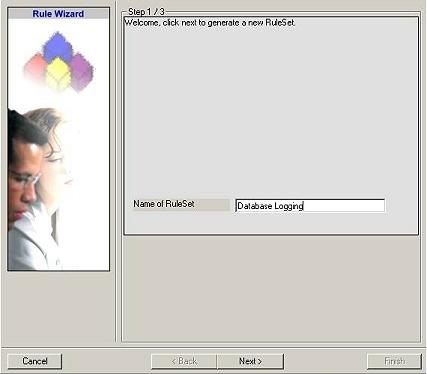
13. Then, a wizard starts. Change the name of the rule set to whatever name you
like. We will use “Database Logging” in this example. The screen
looks as follows:
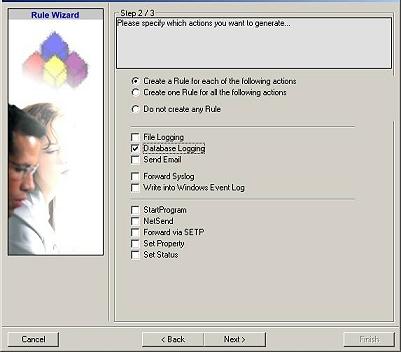
14. Click “Next”. A new wizard page appears:
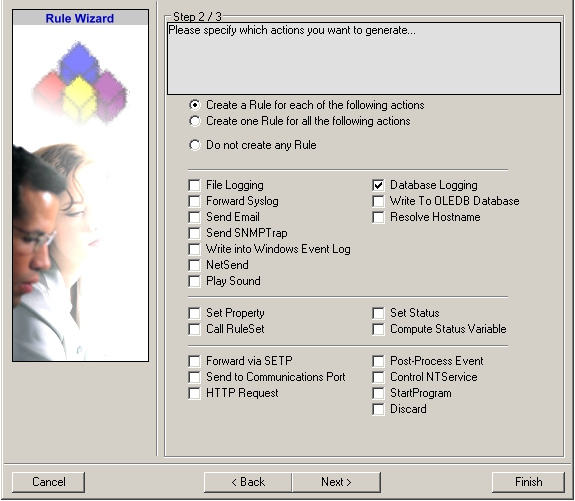
15. Select only Database Logging. Do not select any other options for this sample.
Also, leave the “Create a Rule for each of the following actions”
setting selected. Click “Next”. You will see a confirmation page.
Click “Finish” to create the rule set.
16. The wizard closes and the client shows a newly created rule set.
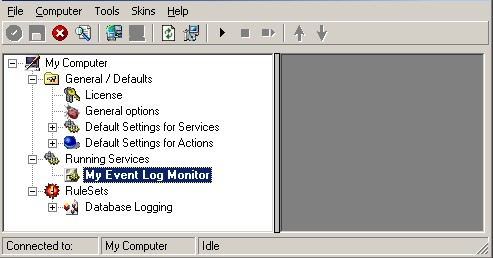
17. As you can see, the new Rule Set “Database Logging” is present. Please
expand it in the tree view until the action level of the “Database
Logging” Rule and select the “Database Logging” action to
configure.
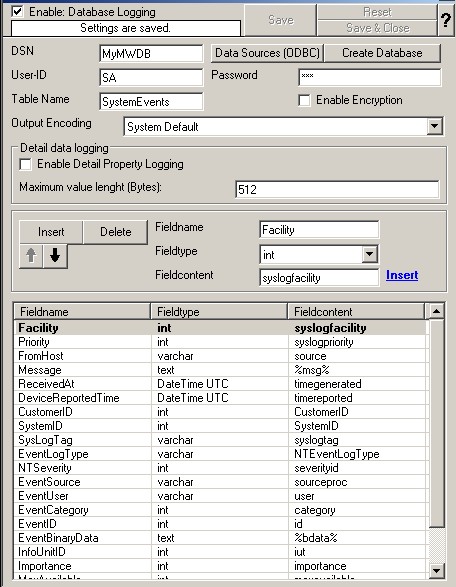
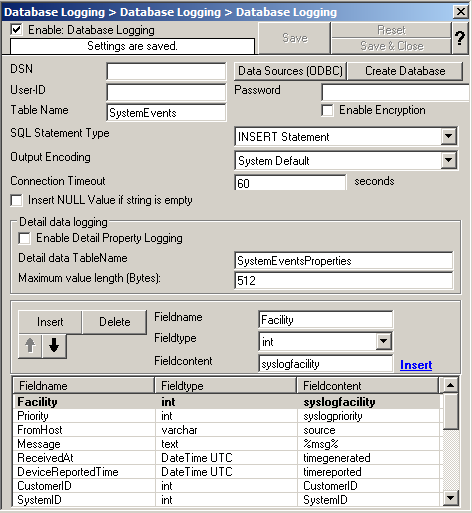
You will see the following Window now:
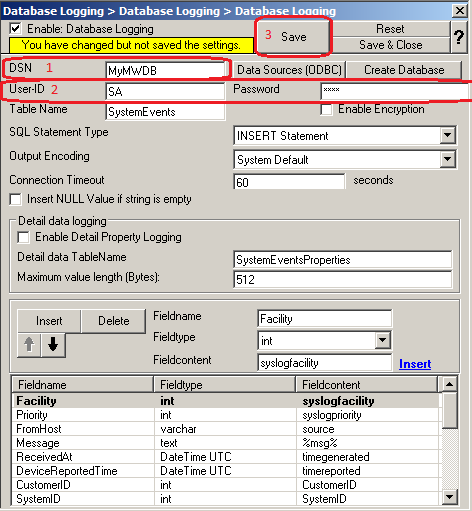
18. Type in your DSN, User-ID and Password now and press “Save”.
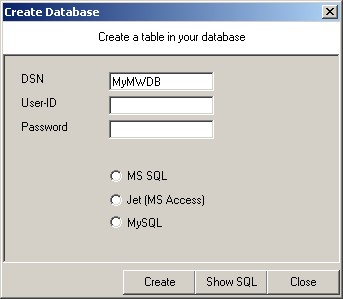
19. Click on the “Create Database” Button to let the Programm create the Adiscon-Table-Layout in your Database.
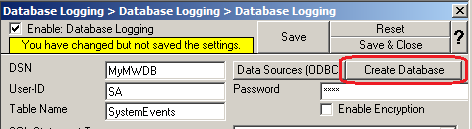
Done 🙂