How To setup PIX centralized Monitoring with MonitorWare Console 3.x

How To setup PIX centralized Monitoring with MonitorWare Console 3.x

Article created 2005-05-17 by Hamid Ali Raja
Last Updated 2011-05-24 by Tom Bergfeld

Adiscon Products can be used to efficiently analyze PIX traffic as well. This article is strictly task focused. It does not describe why the systems should be monitored nor does it provide any further background. Please see the respective backgrounders or product documentation on this. This article is a step-by-step description of what you need to do in order to centrally monitor your PIX logs.

Centralized PIX Reports

In this step-by-step guide, WinSyslog is configured to work together with Adiscon’s MonitorWare Console to generate summaries for the traffic passing to and from PIX.

What you need

In this guide, I am focusing on building a solution with Adiscon’s WinSyslog and MonitorWare Console. This guide will be equally good for you if you want to configure MonitorWare Console with WinSyslog or to configure MonitorWare Console with MonitorWare Agent. The reason is that in this configuration a syslog server that will be listening for syslog messages is required. Since MonitorWare Agent and WinSyslog can act as syslog server, this guide can be used for both. The configuration steps are exactly the same in both cases.

This combination allows you to centralize all your logs and generate reports on them. Free 30 day trial versions are available at the respective product sites (links below), so you can try the system without the need to buy anything.

You need to run the following products:

  • 1 WinSyslog for the system that will act as the syslog server.
  • 1 MonitorWare Console to generate consolidated reports based on the gathered log data. This will also be installed on the same machine where you have installed WinSyslog.
  • You need administrative privileges on each of the machines. This is required in both cases, for installation and configuration. Make sure you log on with a sufficiently privileged user account.

    Step 1 – Download Software

    You need to download the following software to follow this step by step guide:

    1. www.winsyslog.com/en/download
    2. www.mwconsole.com/en/download

    Step 2 – Install WinSyslog

    Run the WinSyslog program on the system that is to act as the central server. Take a note of this server’s IP address or host name. You’ll need this value when configuring PIX to forward the messages to it.

    Step 3 – Configure a Syslog Server

    The steps to configure the WinSyslog as a syslog server are as follows:

    Configuring a Syslog Server

    Step 4 – Create a RuleSet for Database Logging

    In this section, you will create an action to write the messages that are coming from PIX to a database. Please note that these steps would be exactly the same for both MonitorWare Agent and WinSyslog.

    Database Logging Steps

    After configuring this RuleSet, make sure that

    • this rule set is associated with the syslog server service that you created in step 3. You can do this by clicking on the syslog server service on the left hand side and by selecting the name of the rule set that you created in step 4 in “Rule Set to Use” combo box on the right hand side.
    • The service is running. You can do this by clicking on the Play button at the top of the client.

    Step 5 – Configure PIX

    In this step, you will need to configure PIX in such a way so that it sends the messages to the syslog server that you created in the above step. You would need to give the IP address or the hostname in PIX.

    PIX Configuration Steps

    Step 6 – Installing and Configuring MonitorWare Console

    MWConsole- Installation and Configuration Steps

    Step 7 – Generating PIX Reports with MonitorWare Console Manually

    Following are the reports in MonitorWare Console that can be generated for PIX logs.

    • Accessed Web Sites Report
    • Blocked Ports Activity Report
    • Possible Attacks Report
    • PIX Summary By Message Type
    • PIX Summary by Severity Level
    • Traffic By Hour Report
    • Traffic By Port Report
    • Outbound Traffic By IP
    • Traffic by Target IP

    This section explains how the PIX reports can be generated with MonitorWare Console manually. In this section I will explain the generation of a specific report only. Please note that, the procedure for generating any report is almost the same.
    Generating PIX Reports with Console 3.0 Manually

    Step 8 – Scheduling the Generation of Reports with MonitorWare Console

    This section explains how the reports can be generated with MonitorWare Console automatically using Job Manager. With Job Manager, you can generate all the reports based on a pre-defined schedule and ask it to either store it in some location on the hard disk or send it to specified recipient via email. The following section explains the scheduling of System Status Report. You can use exactly the same method to generate any of the PIX reports that are mentioned above.

    Scheduling Reports with Console 3.0

    You are done!

    Well, this is all you need to do to configure the basic operations. We hope this article is helpful. If you have any questions or remarks, please do not hesitate to contact us at support@adiscon.com

How To setup Windows centralized Monitoring

How To setup Windows centralized Monitoring

Article created 2007-10-26 by Florian Riedl
Article updated 2011-05-23 by Tom Bergfeld

Please Note: This article is valid for EventReporter, WinSyslog and MonitorWare Agent in addition to MonitorWare Console!

Windows systems monitoring is really important for all small to large sized environments. The MonitorWare line of products helps to accomplish this important task. This article is to help you establish a small setup to monitor your Windows systems.

This article is strictly task focused. It does not describe why the systems should be monitored nor does it provide any further background. Please see the respective backgrounds or each of the products documentation on this. This article is a step-by-step description of what you need to do in order to centrally monitor your Windows systems.

Centralized Event Reports

In this step-by-step guide, we want to monitor the windows eventlog on all of our client machines (which can be done either with EventReporter or MonitorWare Agent) and then forward the logfiles to a central log server which writes the data into a database (can be done with WinSyslog or MonitorWare Agent). After this, MonitorWare Console should read the data from this database and automatically generate event summaries for the monitored servers.

This guide focuses on a typical small to medium business topography with a single geographical location and five windows clients and a central hub server. All systems are well connected via a local ethernet. Event reports from all machines should be stored in a database. The administrator shall receive daily consolidated event reports.

What you need

In this guide, I am focusing on building a solution with Adiscon’s EventReporter, WinSyslog and MonitorWare Console. (Please note that you can use and configure MonitorWare Agent in the same way like either WinSyslog or EventReporter because it is our main product which has all the features of the other two products too. Please also see our article on which product to choose if you are in doubt which one is right.)
This combination allows you to centralize all your event logs and reports on them. Free 30 day trial versions are available at the respective product sites (links below), so you can try our products without the need to buy anything. You need to run the following products:

  • One EventReporter (alternative: MWAgent) for each system that is to be monitored. In our scenario, this means 6 copies, one for each client and one for the central hub server, if you want to monitor the hub server as well.
  • One WinSyslog (alternative: MWAgent) to receive and store event reports from the EventReporter (alternative: MWAgent) monitoring agents.
  • One MonitorWare Console to automatically generate consolidated reports based on the gathered log data. MonitorWare Console is a very comprehensive tool that helps you to carry out sophisticated analysis of your system. For more information about MonitorWare Console, please refer to its manual.

Notes:

  • You need administrative privileges on each of the machines. This is required both for installation and configuration. Make sure you log on with a sufficiently privileged user account.
  • You need a database to store the events. Recommended are MySQL or MSSQL databases, but you could use a JET database as well.
  • To deliver MonitorWare Console reports, you need a mail server capable of talking SMTP (most modern servers support this)

Step 1 – Download Software

You should check the web sites for new versions if you downloaded your copies a while ago as security and monitoring is a short lived business, and new product versions can appear quickly. Please visit www.eventreporter.com/en/download, eventually www.mwagent.com/en/download, www.winsyslog.com/en/download and www.mwconsole.com/en/download/ to download the latest versions of EventReporter, MWAgent, WinSyslog and MonitorWare Console.

Step 2 – Installing WinSyslog/MWAgent

Identify the system; WinSyslog or MWAgent (and probably MonitorWare Console) should run on. Take a note of its IP address or host name. You’ll need this value when configuring the EventReporter clients. For our example, I assume this system has an IP address of 192.168.0.1.

Run the WinSyslog/MWAgent setup with default parameters. When setup has finished, it automatically is configured to operate as a simple Syslog server. However, it does not yet use a database as we need it to. We’ll later set it up to write data into the database.

Step 3 – Install EventReporter/MWAgent

Run the EventReporter/MWAgent setup program on all systems that should be monitored. This means you need to run it on all five clients and the central hub server (as mentioned above that it is also to be monitored).

For larger installations (with many more servers) there are ways to set it up in a simpler fashion, but in a scenario like ours, it is faster to install it on each machine manually. You can install it with the default settings. When setup has finished, the program automatically is configured to operate simply to report events. However, it does not yet create the log in our database we need. So we will go ahead and change this on each of the machines or by launching it on one machine and remotely connecting to the others. It is your choice. In this sample, I use the EventReporter/MWAgent on each machine (it is easier to follow).

Step 4 – Configuring the Central Agent

The steps described are for setting up your WinSyslog/MWAgent installation on your central hub server. Some steps will be described in a mini-guide, so be sure to follow the links:

1. Start WinSyslog/MWAgent.

2. Select your language – in this example, I use English, so it might be a good idea to choose English even if that is not your preference. You can change it any time later, but using English makes it much easier to follow this guide here.

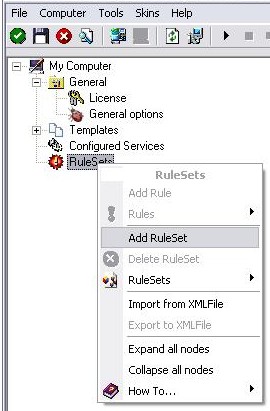
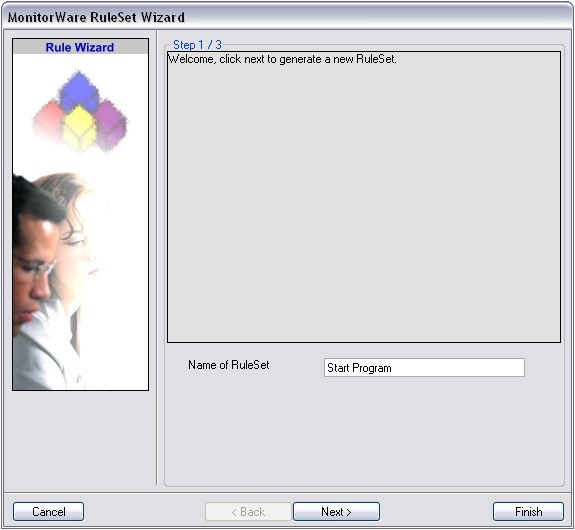
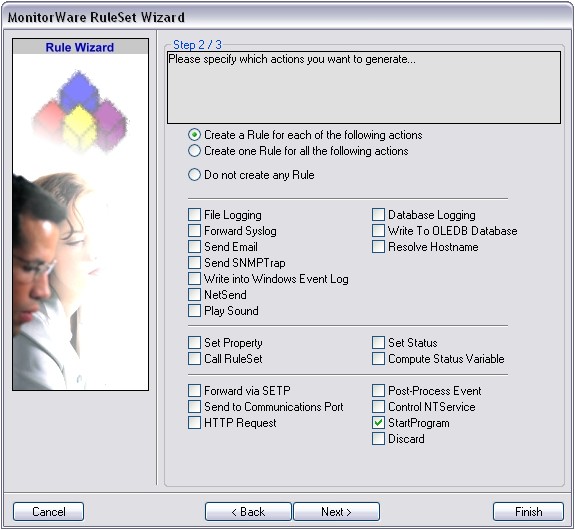
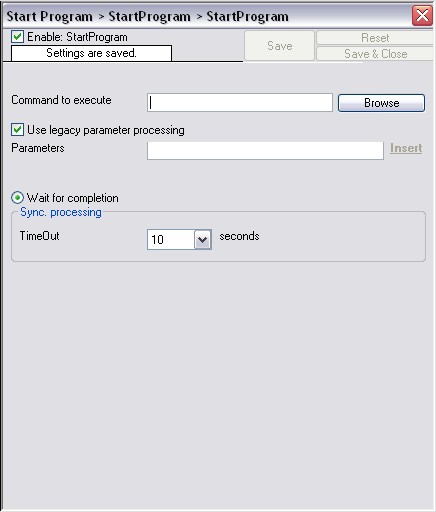
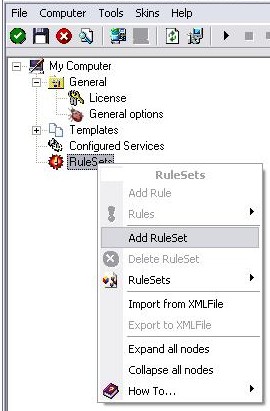
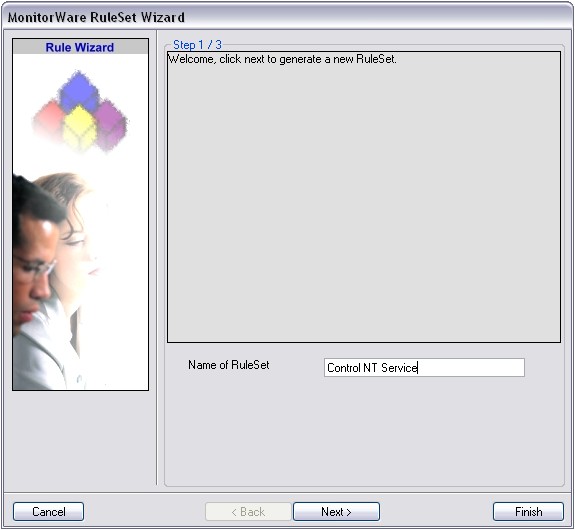
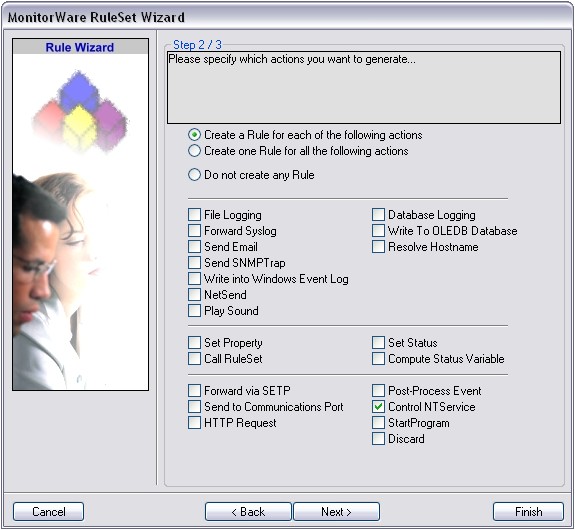
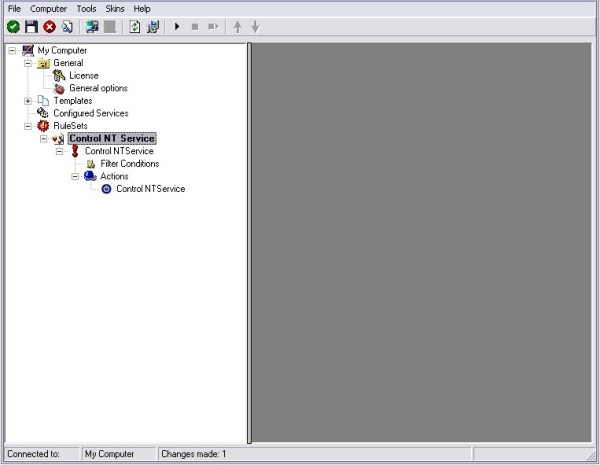
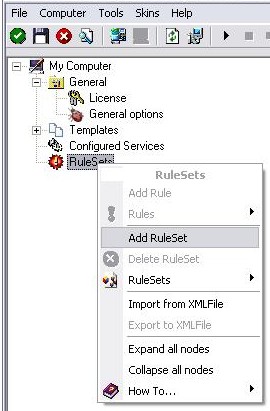
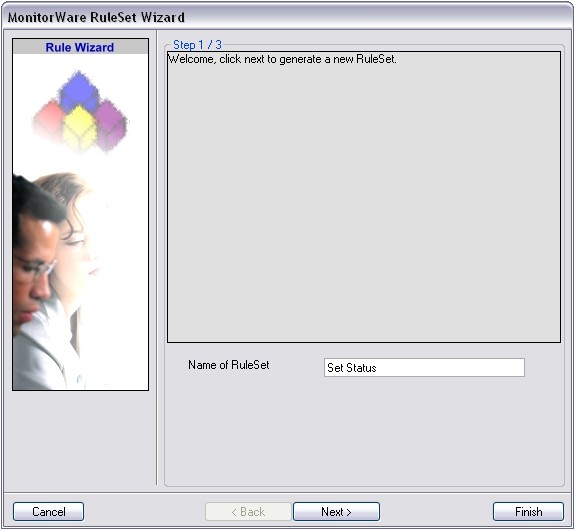
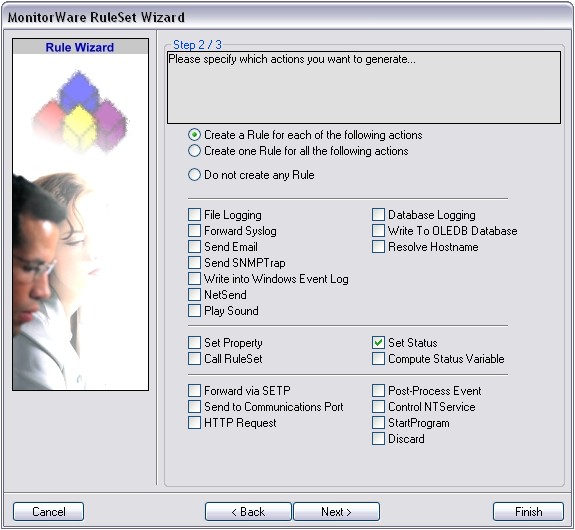
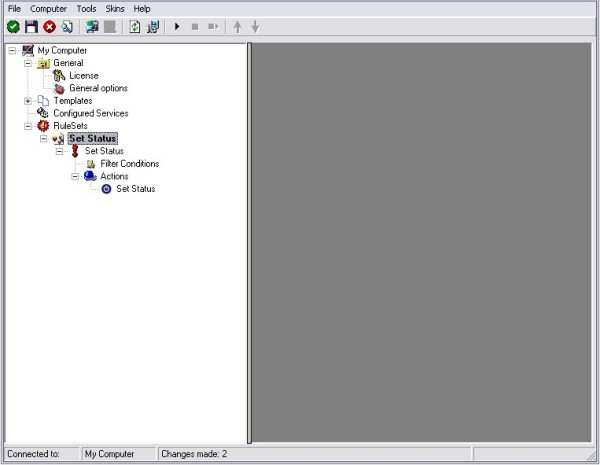
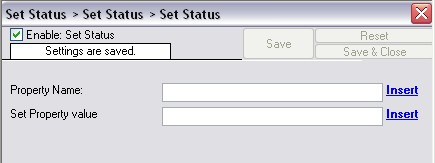
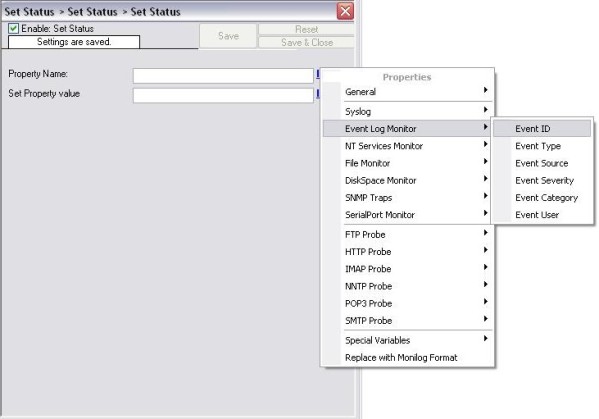
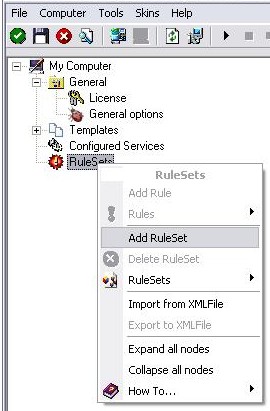
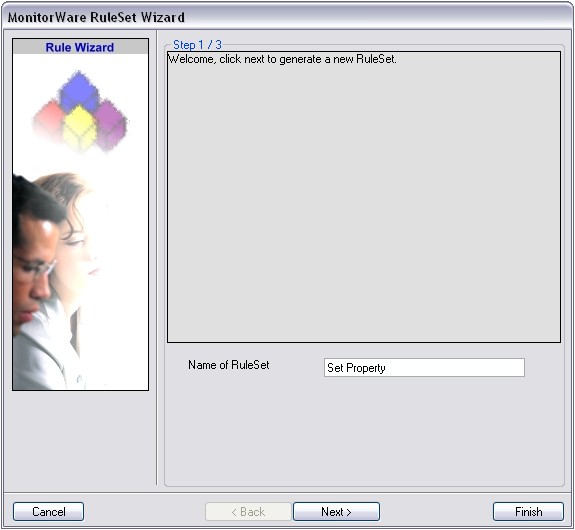
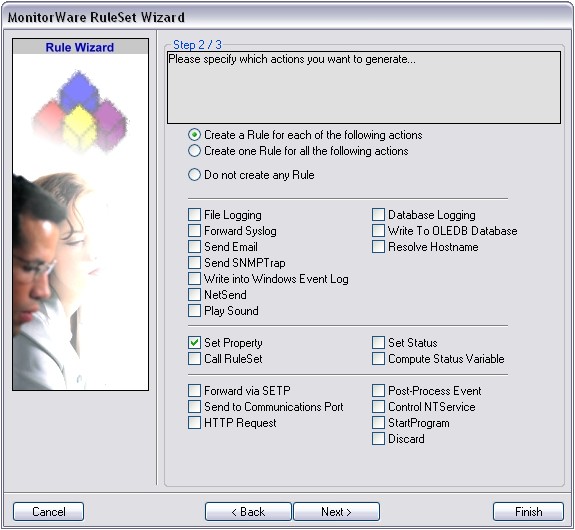
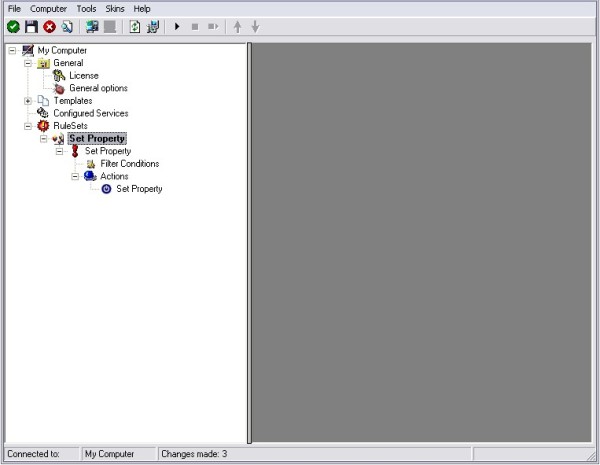
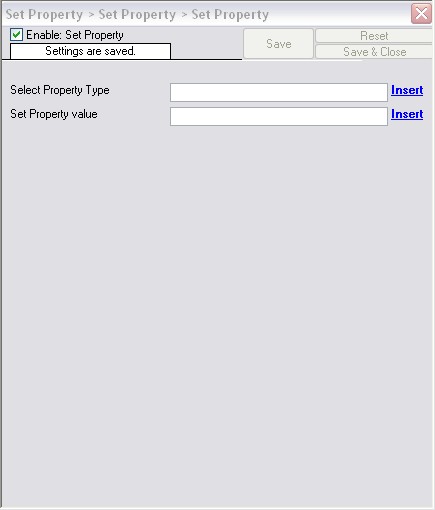
3. We will now create a ruleset for logging into a database. You can see the detailed steps in the following guide. It describes setting up the action and the ODBC datasource. In this example, a JET database will be used, but you can adapt these steps to let the ODBC driver point to a different database. For setting up the database, please refer to the software producer. Immediate troubleshooting can be done with us, too.
How to create a ruleset for database logging?

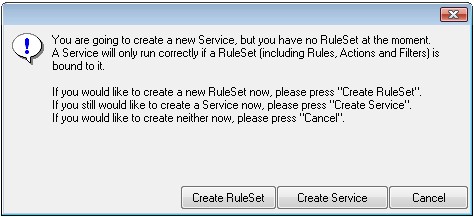
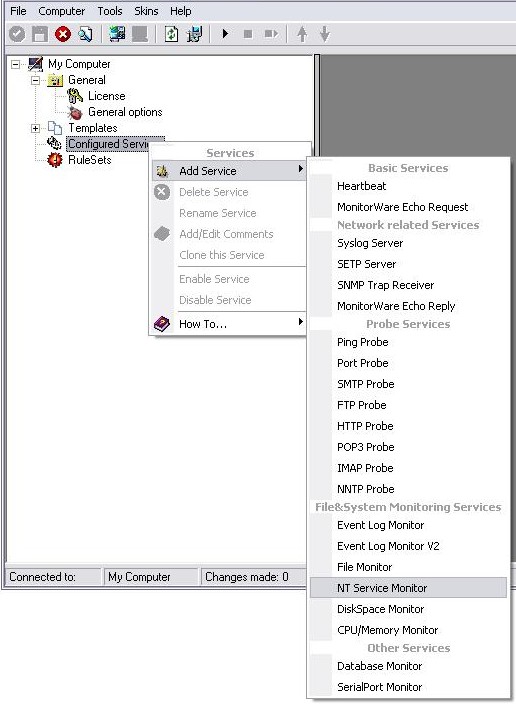
4. Now that we have created our ruleset, we are ready to configure the receiving service. Again, follow the mini-guide for the specific steps. We will create a SETP server. With this, we will be able to receive the eventlog data from our agents on our central hub server. Why not using syslog? Because syslog will change the format of the log message and for creating reports we need the correct format.
How to create a SETP server service?

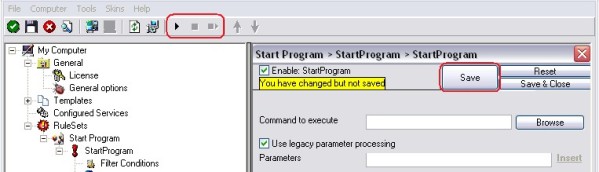
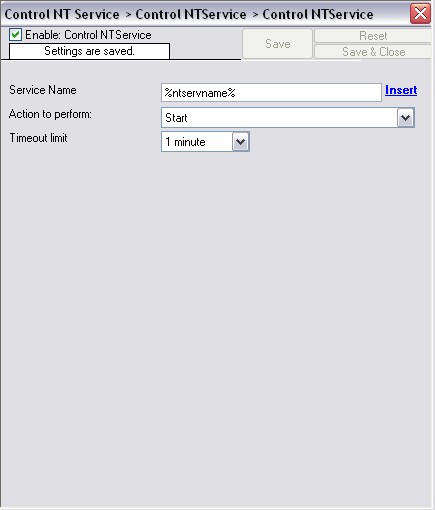
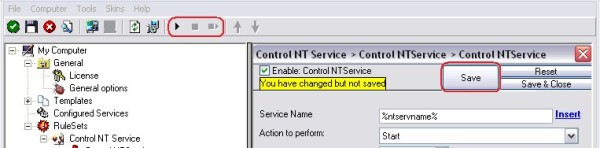
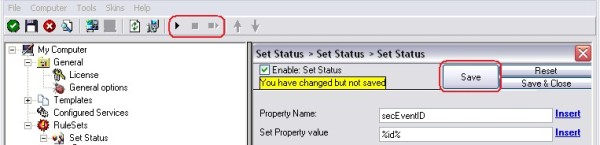
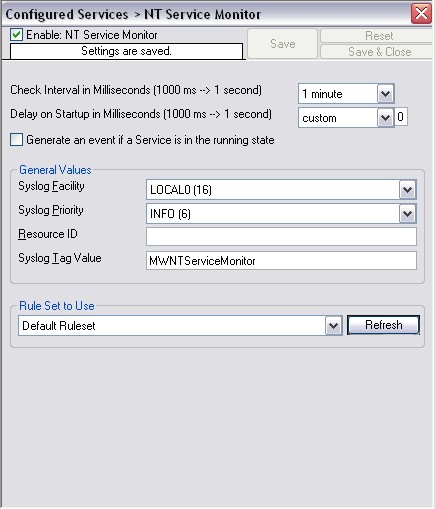
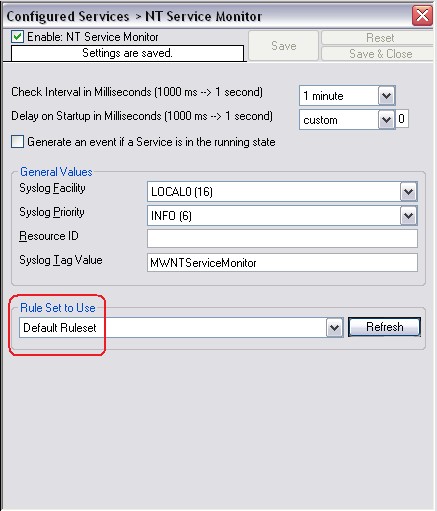
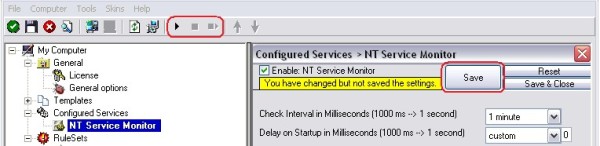
5. Make sure you press the “Save” button – otherwise your changes will not be applied. The only thing left is to start/restart the service with the Play button. Once done, your central agent is ready to receive the log data and store it into your database.

Step 5 – Configuring the Reporting Agents

The steps you will take now will show you how to setup your EventReporter/MWAgent to monitor your Windows Events and forward them via SETP to your central hub server from Step 4. The procedure is the same as above. Follow the links to the miniguides for a detailed description of the respective step.
Please Note: If you use MonitorWare Agent on your central hub server, then you do not need to install EventReporter. You can do these configuration parts in MWAgent, too. You just have to make sure, that the service uses the correct ruleset!

1. Start WinSyslog/MWAgent

2. Again, you can select the language to use. And again, I suggest using English, as this makes the guide easier to follow.

3. We will now setup a new ruleset for forwarding the log data to our central host. Please make sure, that you insert the IP 192.168.0.1 (respective the IP you noted and which belongs to your central hub server) into the forward SETP action. This is crucial or else your central hub server will not receive any data.
How to create a Forward vis SETP Action?

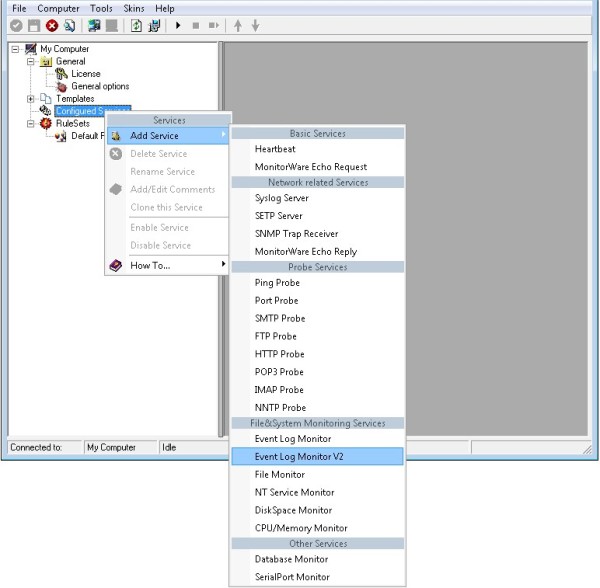
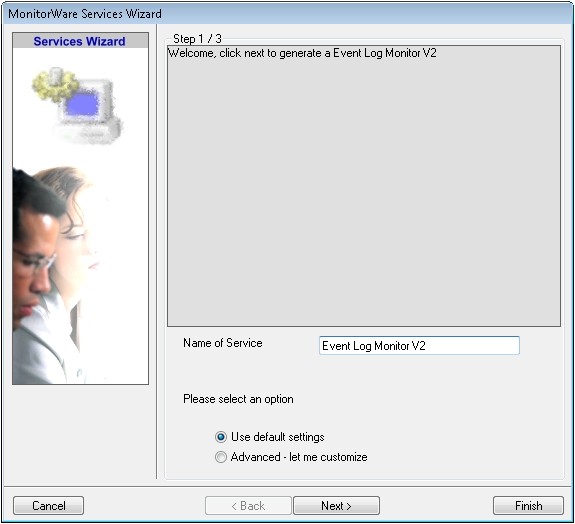
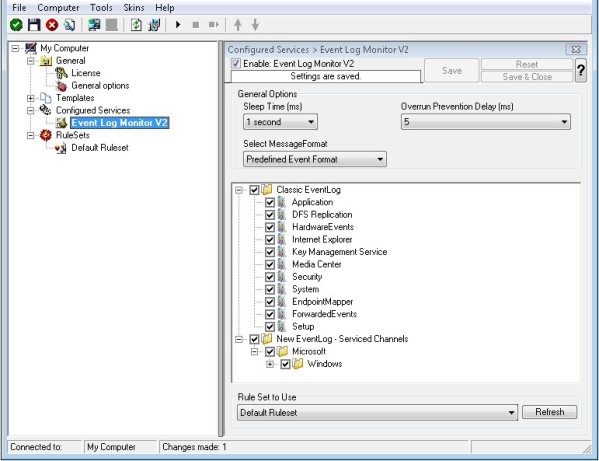
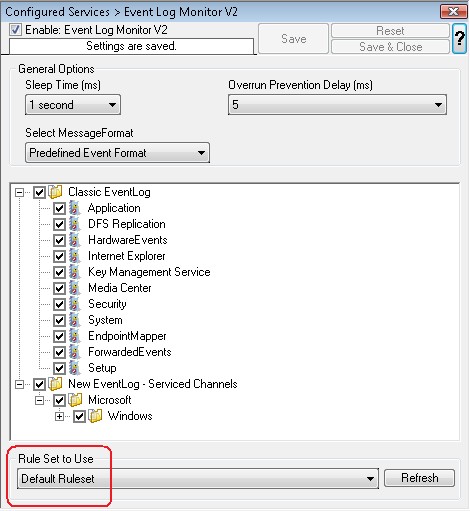
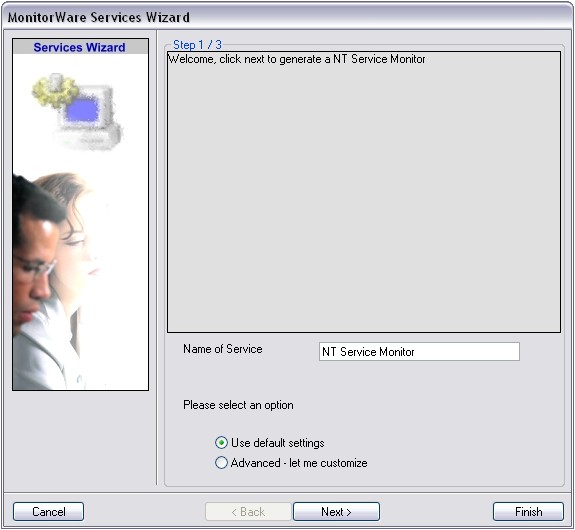
4. After creating the ruleset, we will now create the service which will poll the eventlog data for forwarding via SETP. The service we are going to create is the EventLog Monitor. It will check in set time intervals for new events and if some occurred, they will be processed by the ruleset. Here are the steps for this procedure:
How to create the EventLog Monitor Service?

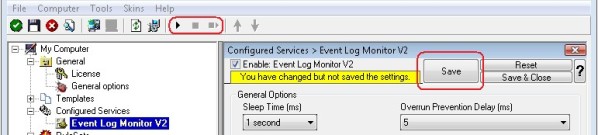
5. Again, make sure you press the “Save” button – otherwise your changes will not be applied. The only thing left is to start/restart the service with the Play button. Once done, you reporting agent will begin to poll the log data from your eventlog and forward it via SETP to your central hub.

Step 6 – Installing and Configuring MonitorWare Console

Now we will turn to MonitorWare Console. To keep traffic low, you could set this up on your central hub server as well. This will give MonitorWare Console direct access to the database and helps to perform better. In the following guide, we show you how to install MonitorWare Console and do the basic configuration steps:
MonitorWare Console 3.x – Installation and Configuration Steps

Step 7 – Generating Reports with MonitorWare Console Manually

This section explains how the reports can be generated with MonitorWare Console manually. Since “System Status” Report is most comprehensive report that tells a detailed description about the network, in this section I will explain this report only. Please note, that the procedure for generating any report is almost the same.
How To Generate Reports with MonitorWare Console 3.x Manually

Step 8 – Scheduling the Generation of Reports with MonitorWare Console

This section explains how the reports can be generated with MonitorWare Console automatically using Job Manager. With Job Manager, you can generate all the reports based on a pre-defined schedule and ask it to either store it in some location on the hard disk or send it to specified recipient via email. Once again, I will explain the scheduling of System Status Report in this section. Please note that, the procedure for scheduling any report is the same.
How To Schedule Reports with MonitorWare Console 3.x

You are done!

Well, this is all you need to do to configure the basic operations. Once you are comfortable with the basic setup, you can enhance the system with local pre-filtering of event, enhanced logging and alerting (with MonitorWare Agent) and changing report options (with MonitorWare Console).

I hope this article is helpful. If you have any questions or remarks, please do not hesitate to contact us at support@adiscon.com.

Supported Windows Versions: Windows 7 / 2008 / Vista / 2003 / XP

How To Monitor Windows machines and Syslog devices?

How To Monitor Windows machines and Syslog devices?

Article created 2007-06-15 by Florian Riedl
Article updated 2011-06-15 by Tom Bergfeld

Info:
Please note that this article was written for older versions of MonitorWare products. But of course you can also use this guide for the current versions. In newer versions you maybe will find some additional settings, but the basic settings will be the same.

This Article describes how you can monitor the EventLog of your Windows hosts and your syslog devices at the same time. All log data will be stored in a central database for further processing. The description below shows you how to setup your central log server and how to setup your Windows hosts.
What do we need for this article?

  • One MonitorWare Agent – edition depending on number of remote hosts.
  • EventReporter Professional for sending EventLog data via SETP – number depending on Windows hosts to monitor.
  • Syslog sending devices – configured and running.
  • A SQL or Jet database – configured ODBC datasource on the central host.
  • Step 1:

    The first step is, to setup the central agent. This machine will get MonitorWare Agent installed. It will be the one which receives the syslog messages from your routers, switches, firewalls or unix hosts. And it will receive all EventLog data from your windows hosts via SETP.
    Please Note: For this example you need a ODBC datasource configured for a SQL database of your choice on this machine.

    Download MonitorWare Agent configuration file.

    Step 2:

    The second step is to setup the Windows machines, which should send all EventLog data to your central server. On these machines you install EventReporter. It will read the EventLog and forward all Windows Events to your central server via SETP.

    Download EventReporter configuration file.

    Step 3:

    In the third step you need to setup your syslog sending devices correctly. These devices can be routers, switches, firewalls or unix hosts. You need to configure the device so log messages are sent via syslog to your central host. Because of the variety of devices, we cannot give any specific guides for the setup. If there comes anything up, please ask your local administrator or the vendor of the device.
    Please Note: Adiscon dissociates itself from any issues that result in wrong confguration of these devices.

    Step 4:

    You are done! Your setup is complete. And everything works correctly, then your database should fill itself with your log data.

    Now that a basic setup has been created you could go on go on and bring in more detail. Creating reports with the stored data, automatic e-mails for your administrators or filtered log data are only a few of the many possibilities. You could combine Ping or Port Probes and the send e-mail action for alerting if a machine or a service fails or apply detailed filters before sending the log data to your central host.

    How To setup a Start Program Action

    How To setup a Start Program Action

    Article created 2007-04-12 by Florian Riedl.

    1. First we define a new rule set. Right-click “Rules”. A pop up menu will appear. Select “Add Rule Set” from this menu. On screen, it looks as follows:

    2. Then, a wizard starts. Change the name of the rule to whatever name you like. We will use “Start Program” in this example. The screen looks as follows:


    Click “Next” to go on with the next step.

    3. Select only “Start Program”. Do not select any other options for this sample. Also, leave the “Create a Rule for each of the following actions” setting selected. Click “Next”. You will see a confirmation page. Click “Finish” to create the rule set.

    4. As you can see, the new Rule Set “Set Property” is present. Please expand it in the tree view until the action level of the “Set Property” Rule and select the “Set Property” action to configure.

    5. You can use this action to start programs and scripts on the occurence of special Events. Mostly this action is used in conjunction with strict filter settings. It allows you to begin with counter-measures if something happens.

    6. By clicking on the “Browse”-Button a windows opens up. Here you can specify the program or script you want to use. After that you can specify special parameters that should be used upon execution. These will be used as command-line parameters. Further there are parameters available which refer directly to message properties. That way you can use information from the messages as parameters. For more information on these, refer to the manual
    internal property list

    7. Finally, make sure you press the “Save” button – otherwise your changes will not be applied. Then start the service and you are done.

    How To setup EventLogMonitor V2 Service

    How To setup EventLogMonitor V2 Service

    Article created 2007-04-10 by Florian Riedl
    Article updated 2011-05-25 by Tom Bergfeld.

    Please note:

    Starting with EventReporter 8.3 and MonitorWare Agent 4.3 two different event log monitor services are provided. They are called “Event Log Monitor” (V1) and “Event Log Monitor V2”. In short, the V2 version is recommended for Windows Vista (and above, e.g. Longhorn Server) while the other version is for previous releases of Windows (NT, 2000, 2003, XP). Please find more information about the different EventLogMonitors at Which Event Log Monitor to use.
    There is also a guide How To setup EventLogMonitor V1 Service.

    1. First, right click on “Services”, then select “Add Service” and then “Event Log Monitor V2”:

    create service

    2. Once you have done so, a new wizard starts.
    If the following Popup appears, please select “Create Service”:

    create the service

    Again, you can use either the default name or any one you like. We will use the default name in this sample. Leave the “Use default settings” selected and press “Next”.
    service name

    3. As we have used the default, the wizard will immediately proceed with step 3, the confirmation page. Press “Finish” to create the service. The wizard completes and returns to the configuration client.

    4. Now, you will see the newly created service beneath the “Services” as part of the tree view. To check its parameters, select it:

    view service
    As you can see, the service has been created with the default parameters.

    Note: The “Default RuleSet” has been automatically assigned as the rule set to use. By default, the wizard will always assign the first rule set visible in the tree view to new services.

    5. Finally we, bind a ruleset to this service. If you already have a ruleset, simply choose one. If not, then you will have to create one, or insert the actions you want to take in the default ruleset.
    Remember, this is only an example. You can do it in any way you want.

    6. The last step is to save the changes and start the service. This procedure completes the configuration of the syslog server.

    The NT Service cannot dynamically read changed configurations. As such, it needs to be restarted after such changes. In our sample, the service was not yet started, so we simply need to start it. If it already runs, you need to restart it.

    That’s it. This is how you create a simple EventLog Monitor V2 for Vista.

    How To setup a Control NT Service Action

    How To setup a Control NT Service Action

    Article created 2007-04-05 by Florian Riedl.

    1. First we define a new rule set. Right-click “Rules”. A pop up menu will appear. Select “Add Rule Set” from this menu. On screen, it looks as follows:

    2. Then, a wizard starts. Change the name of the rule to whatever name you like. We will use “Control NT Service” in this example. The screen looks as follows:


    Click “Next” to go on with the next step.

    3. Select only “Control NT Service”. Do not select any other options for this sample. Also, leave the “Create a Rule for each of the following actions” setting selected. Click “Next”. You will see a confirmation page. Click “Finish” to create the rule set.

    4. As you can see, the new Rule Set “Control NT Service” is present. Please expand it in the tree view until the action level of the “Control NT Service” Rule and select the “Control NT Service” action to configure.

    5. Here you can configure the control options which include the service name (which is the actual service name, not the display name), the action to perform and a timeout value. For the service name, you can take a concrete name for a specific service or leave the property in conjunction with the NT Service Monitor. For now we leave the default values.

    6. Finally, make sure you press the “Save” button – otherwise your changes will not be applied. Then start the service and you are done.

    How To setup a Set Status Action

    How To setup a Set Status Action

    Article created 2007-04-05 by Florian Riedl.

    1. First we define a new rule set. Right-click “Rules”. A pop up menu will appear. Select “Add Rule Set” from this menu. On screen, it looks as follows:

    2. Then, a wizard starts. Change the name of the rule to whatever name you like. We will use “Set Status” in this example. The screen looks as follows:


    Click “Next” to go on with the next step.

    3. Select only “Set Status”. Do not select any other options for this sample. Also, leave the “Create a Rule for each of the following actions” setting selected. Click “Next”. You will see a confirmation page. Click “Finish” to create the rule set.

    4. As you can see, the new Rule Set “Set Status” is present. Please expand it in the tree view until the action level of the “Set Status” Rule and select the “Set Status” action to configure.

    5. With this action you can create your own properties which can be used in the whole rule and filter engine. Or you can take a already existing property and just change it’s value. Properties are a variable for specified information units. More detailed information is available in the manual.

    6. You can enter your own property name in the corresponding field, or choose one from the internal list. For this example I choose the property name secEventID. The “Set Property value” can be filled with any valid value or the property replacement. Here I chose my property to be filled with the EventID value. Click on “Insert” to open the menu with the already available properties. This would look like that.
    internal property list

    7. Finally, make sure you press the “Save” button – otherwise your changes will not be applied. Then start the service and you are done.

    How To setup a Set Property Action

    How To setup a Set Property Action

    Article created 2007-04-05 by Florian Riedl.

    1. First we define a new rule set. Right-click “Rules”. A pop up menu will appear. Select “Add Rule Set” from this menu. On screen, it looks as follows:

    2. Then, a wizard starts. Change the name of the rule to whatever name you like. We will use “Set Property” in this example. The screen looks as follows:


    Click “Next” to go on with the next step.

    3. Select only “Set Property”. Do not select any other options for this sample. Also, leave the “Create a Rule for each of the following actions” setting selected. Click “Next”. You will see a confirmation page. Click “Finish” to create the rule set.

    4. As you can see, the new Rule Set “Set Property” is present. Please expand it in the tree view until the action level of the “Set Property” Rule and select the “Set Property” action to configure.

    5. With this action you can set your custom properties which then can be used in the whole rule and filter engine with the new values. Or you can take a already existing property and just change it’s value. Properties are a variable for specified information units. More detailed information is available in the manual.

    6. You can enter your custom property name in the corresponding field, or choose one from the internal list. For this example I chose to replace the value of the property timegenerated with the value of the property timereported. Click on “Insert” to open the menu with the already available properties. This would look like on the following screen. Of course you could choose your own properties, too.
    internal property list

    7. Finally, make sure you press the “Save” button – otherwise your changes will not be applied. Then start the service and you are done.

    How To setup NT Service Monitor Service

    How To setup NT Service Monitor Service

    Article created 2007-04-05 by Florian Riedl.

    This service helps you keeping track of your running services. At severeal time intervals it checks all services which are in the automatic start state if they are running. If not, a Event is generated and passed to the rule engine for further processing.

    1. First, right click on “Services”, then select “Add Service” and the “NT Service Monitor”.

    Once you have done so, a new wizard starts.

    2. Again, you can use either the default name or any one you like. We will use “NT Service Monitor” in this sample. Leave the “Use default settings” selected and press “Next”.

    3. As we have used the default, the wizard will immediately proceed with step 3, the confirmation page. Press “Finish” to create the service. The wizard completes and returns to the configuration client.

    4. Now, you will see the newly created service beneath the “Services” part of the tree view. To check its parameters, select it:

    As you can see, the service has been created with the default parameters.

    5. The default settings are quite capable. The only thing you should adjust now would be the Check Interval or the Delay on Startup. The first value specifies the time interval when the services are checked. The second value should be altered so that no events will be generated unintentionally after a reboot for example.

    6. Now we still need to set a ruleset for this service to work with. Since we have no configured ruleset available at the moment, simply use the Default Ruleset, if it’s not being used automatically. Else you have to adjust this later.

    7. Last, save the changes and then restart the application. This procedure completes the configuration of the FileMonitor Service.

    The Application cannot dynamically read changed configurations. As such, it needs to be restarted after such changes.