Release Date: 2023-06-21
Build-IDs: Service 14.4.0.556, Client 14.4.0.1645
Bugfixes |
|
You can download Free Trial Version of MonitorWare Agent.
Log Consolidator and Alerter
Release Date: 2023-06-21
Build-IDs: Service 14.4.0.556, Client 14.4.0.1645
Bugfixes |
|
You can download Free Trial Version of MonitorWare Agent.
Release Date: 2018-04-11
Build-IDs: Service 12.0.0.515, Client 12.0.0.1590
Features |
|
Bugfixes |
|
You can download Free Trial Version of MonitorWare Agent.
Build-IDs: Service 11.2.0.502, Client 11.2.0.1580
Features |
|
Bugfixes |
|
You can download Free Trial Version of MonitorWare Agent.
Build-IDs: Service 10.2.466, Client 10.2.0.1559
Features |
|
Bugfixes |
|
You can download Free Trial Version of MonitorWare Agent.
Build-IDs: Service 10.1.453, Client 10.1.1538
Features |
|
Bugfixes |
|
You can download Free Trial Version of MonitorWare Agent.
Last updated 2016-08-26 by Jan Gerhards, using Winsyslog 13.2.
In this scenario, a simple Syslog server will be created. No other services are configured. The Syslog server will operate as a standard Syslog server on the default port of 514/UDP. All incoming data will be written to a single text file.
The rule set specifies what action to carry out. You might be tempted to define the service first, but starting with the rule set makes things easier as it will be already present when the service is defined later and needs to be bound to a rule set.
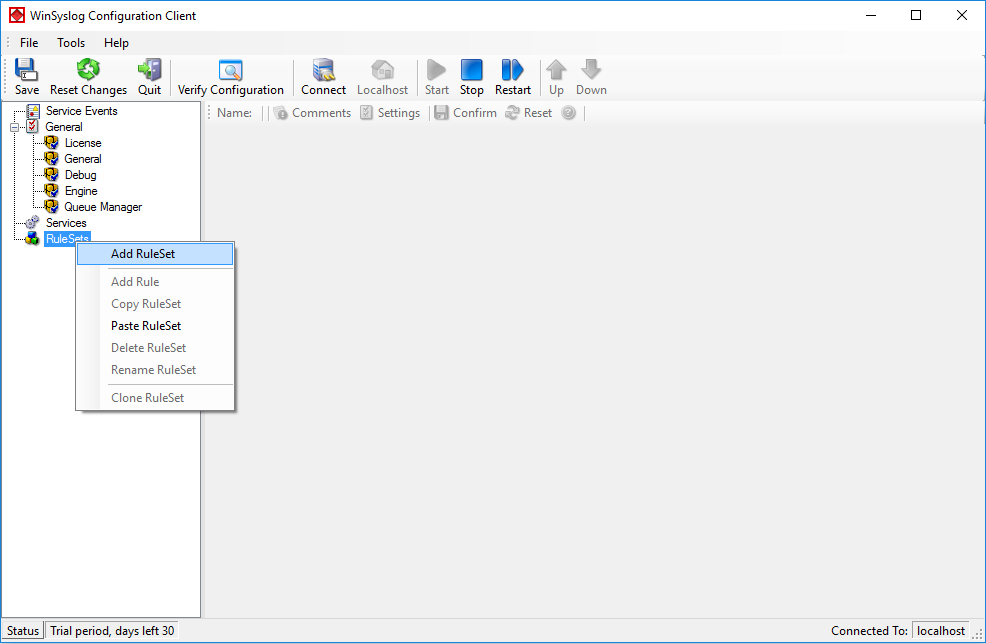
To define a new rule set, right click “RuleSets”. A pop up menu will appear. Select “Add Rule Set” from this menu. On screen, it looks as follows:
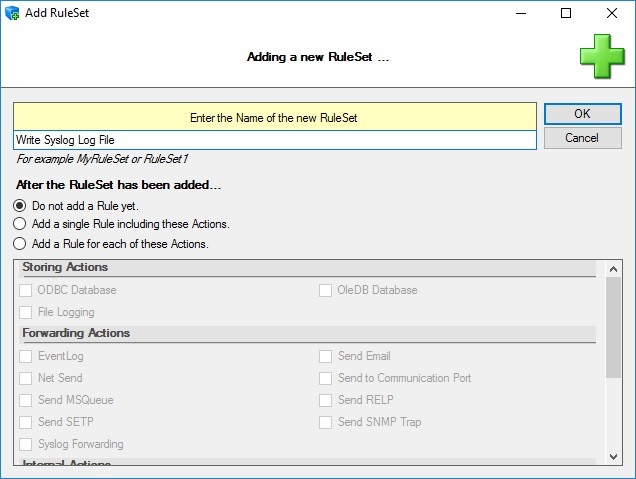
Then, a wizard starts. Change the name of the rule set to whatever name you like. We will use “Write Syslog Log File” in this example. The screen looks as follows:
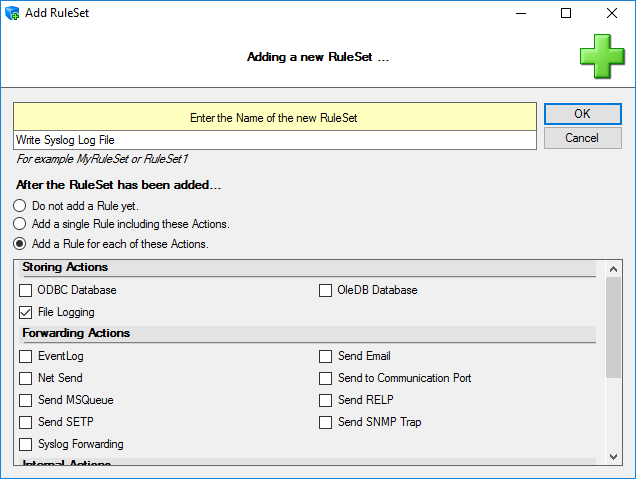
After that, select “Add a Rule for each of these Actions”. You should then be able to change settings in the before greyed-out area. There, select “File Logging” (subitem of “Storing Actions”). Your screen should now look like this:
After that, click “OK” and the wizard will close. The client will now show a newly created rule set.
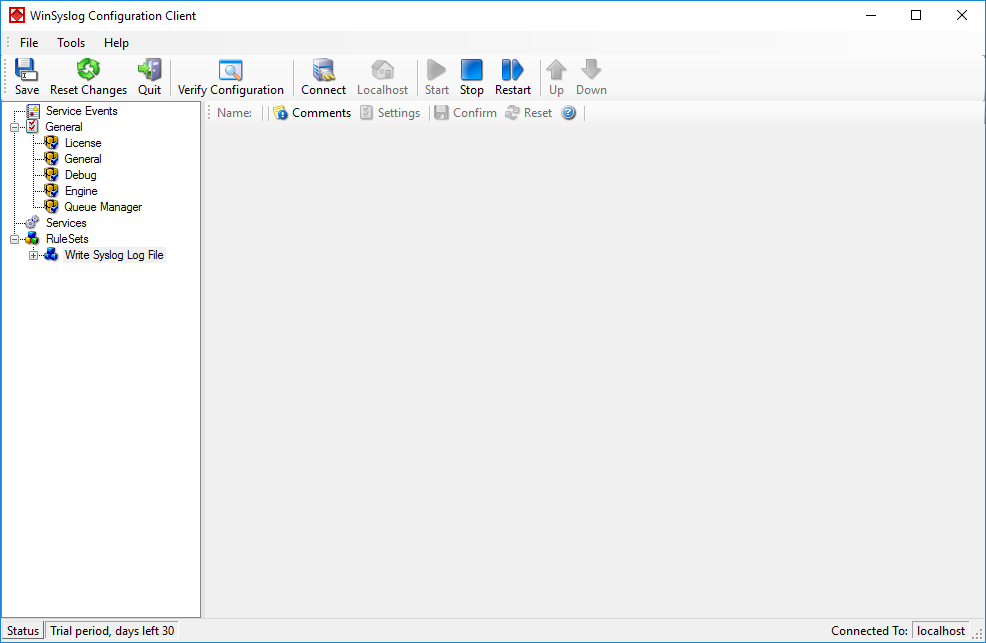
As you can see, the “Write Syslog Log File” rule set is now present. Please expand it in the tree view until you have the following screen contents:
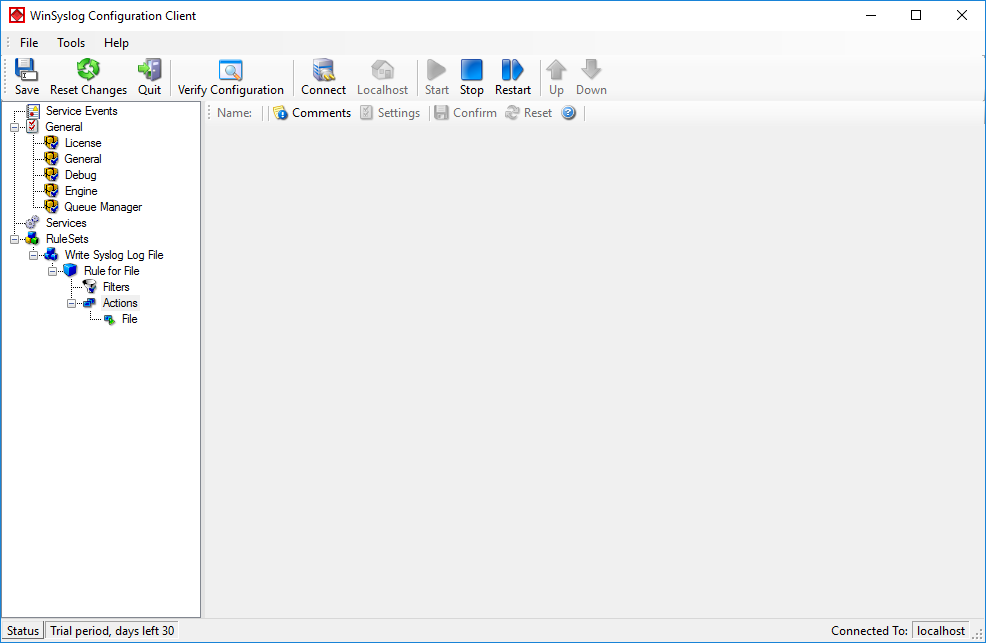
As you can see, we have a “File” action configured. We will review the settings just for your information. Click on “Filters”:
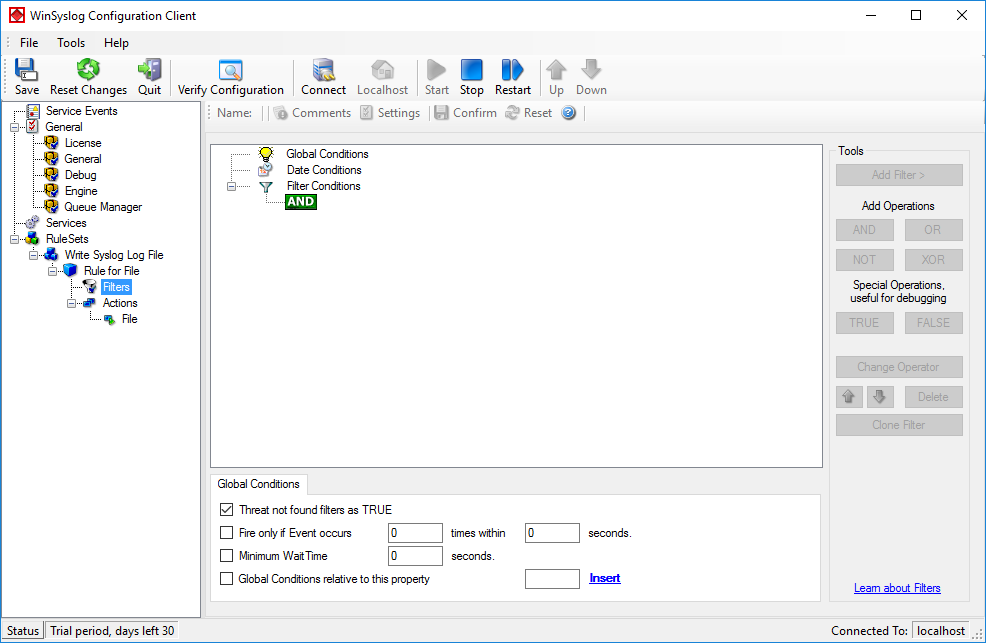
As you can see, none of the filter conditions are enabled. This means that the all information units (incoming messages) will be matched by these filter conditions. As such, the rules for the “File Logging” action will always be carried out for all messages.
Please note that this also means that all Syslog priorities and facilities will be written to the same file.
Now let us check the “File” action itself. Please select it in the tree view:
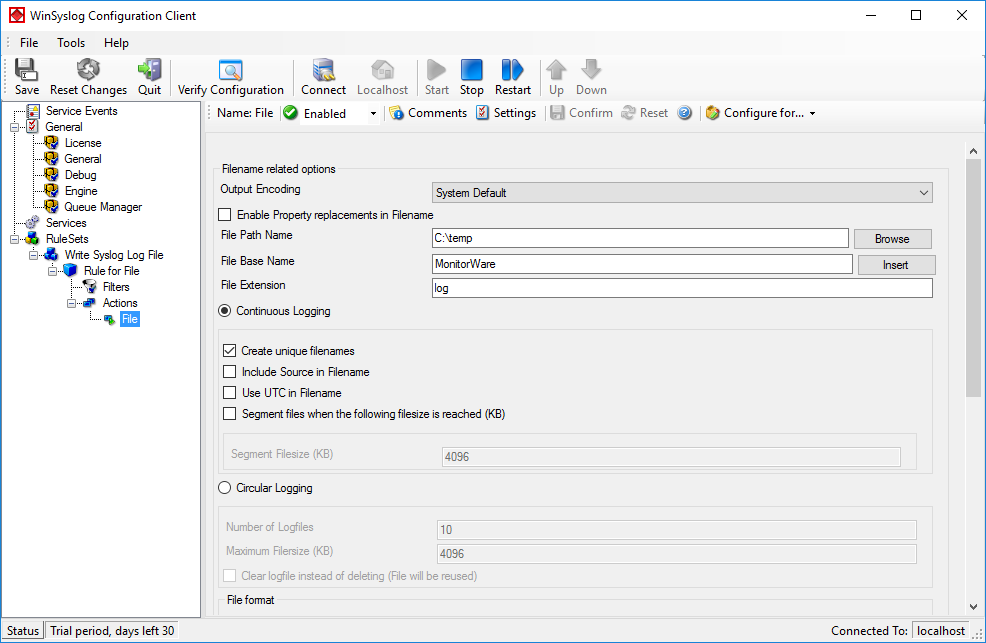
As you can see, it has been created with the default parameters. Each day, a file will be created in the C:\temp directory and its base name will be MonitorWare (meaning the name of the generated file will be MonitorWare-*date*, i.e. “MonitorWare-2016-08-26.log”). It will include all information items in the file (you can select the information items that will be in the file by scrolling down and ticking the boxes).
If you would like to store it into a separate directory or change the file name, here is the place to do it. Important: please make sure the directory you specify exists! If it does not yet exist, please create it before you start the service. If the directory does not exist, the service is not able to store any files.
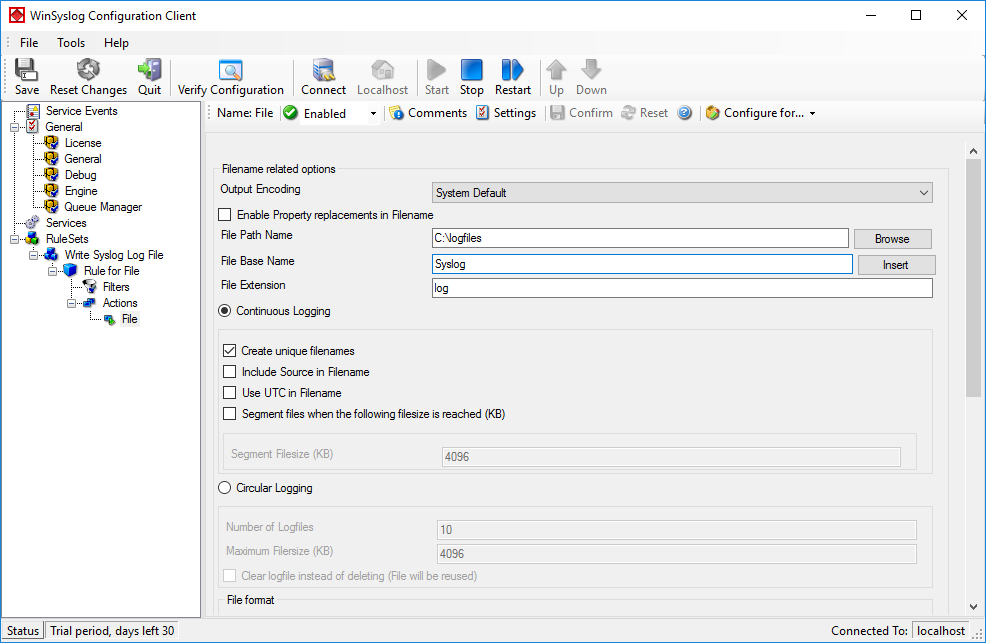
In our example, we would like to save it to “C:\logfiles” with a base name of “Syslog”. Therefore, we change these properties.
After doing so, please remember to save your changes. To do so press “Save” (upper left corner).
Now you have a useable rule set for logging incoming messages to a text file.
Now we need to define a Syslog server service. A Syslog server is also sometimes called a “Syslog daemon”, “Syslogd” or “Syslog listener”. It is the process that receives incoming messages.
To define it, right click on “Services”, then select “Add Service” and the “Syslog Server”:

Once you have done so, a configuration pane opens.
Also, you will see a newly created service beneath the “Services” part of the tree. View and can rename it if you want (in this example, we will name it “My Syslog Server”). After this, press save.
Your screen should now look like this:
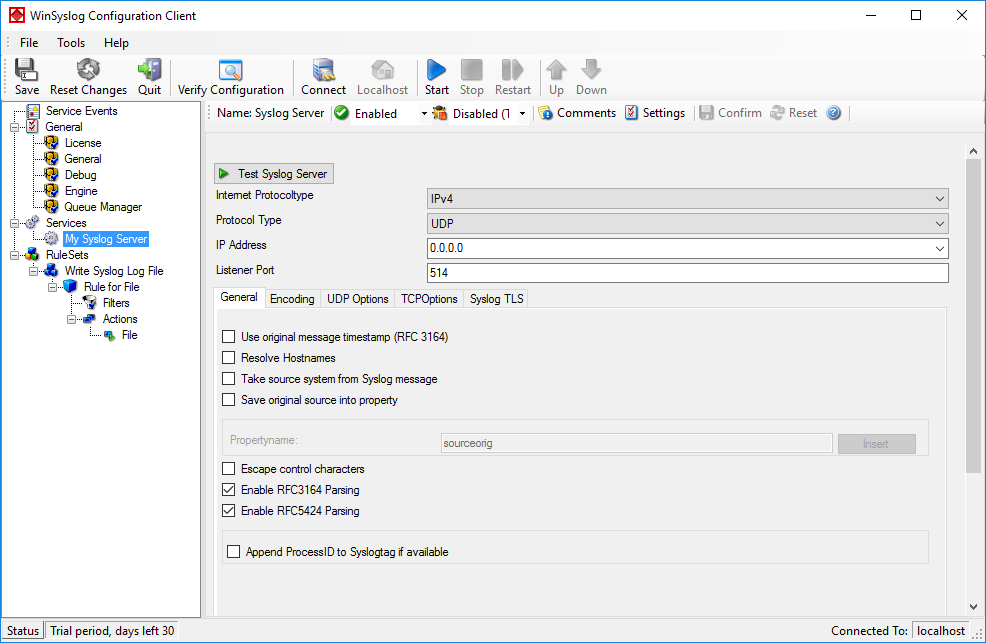
As you can see, the service has been created with the default parameters. As such, it operates as a RFC compliant standard Syslog server.
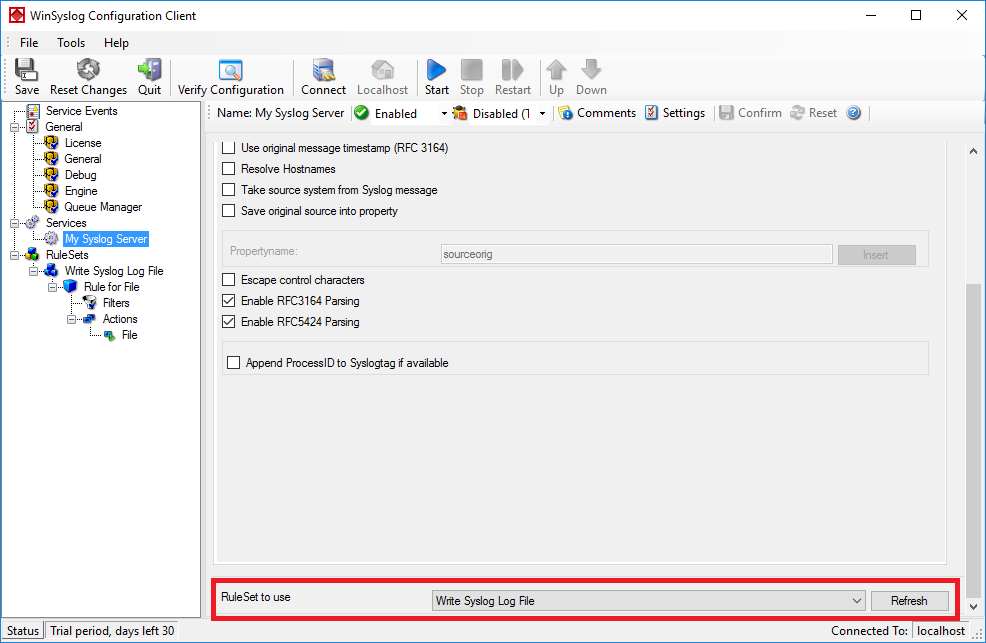
Please note that the “Write Syslog Log File” has been automatically assigned as the rule set to use. This is the case because we already created it and it is the only rule set. If another one is to be used, you can change it to another ruleset here (you might have to scroll down to view the option):
This procedure completes the configuration of the Syslog server.
The application cannot dynamically read changed configurations. As such, it needs to be restarted after such changes. In our example, the service was not yet started, so we simply need to start it. If it’s already running, you need to restart it.
Service control can be done with both the respective operating system capabilities or with the configuration client. These are highlighted in the screenshot below:
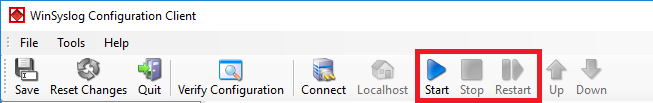
The buttons resemble Windows service manager – start, stop and restart. In this example, stop and restart are grayed out because the service is not running.
After service restart, the new definitions are active and the application is ready to accept and store incoming messages.
Even though application is now ready, it can only receive messages if some devices send them. Remember, Syslog is a protocol where the server is passively waiting for incoming messages. As long as no device sends message, the Syslog server will not log anything.
Since there are a large variety of devices, we unfortunately cannot provide device specific instructions. However, almost all devices need to be configured with their specific configuration tool. Typically, only two settings need to be made: one to activate Syslog messages at all and one with the Syslog server IP address or name.
Remember: the computer running application now acts as a Syslog server. As such, you need to find out its IP address or name and supply it to the device as the Syslog server. Please note that not all devices can operate with computer names. Use the IP address, if in doubt.
We still need to implement the Linux clients into our logging network. This could be Linux workstations or servers. Currently, rsyslog is already shipped with many Linux Distributions as the default syslog daemon already. Though, often a rather old version is installed (mostly v3), this will be sufficient for our current goals.
For our example we will use a Fedora system and alter the configuration accordingly. In the end, rsyslog should use the logs, that are logged locally and forward them via TCP to the central log server.
Please note: The example has been made with Fedora 13. Some steps may vary with other Linux distributions. Since there are so many possibilities, we cannot list them all. So we only concentrate on one version.
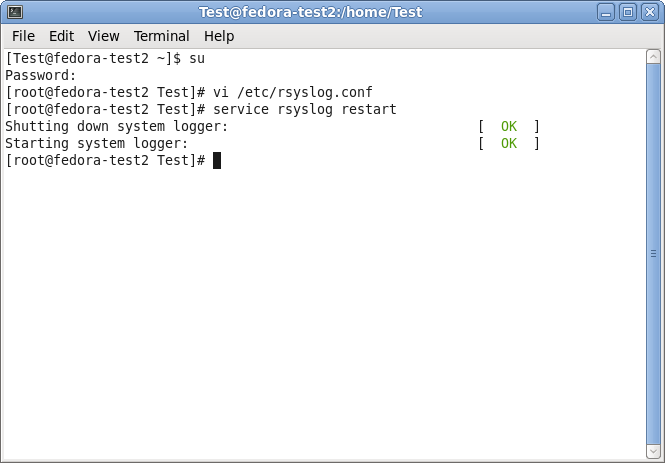
First of all, we need a terminal or command line and go into root mode with su. We do not need the root rights desperately, but it is a bit easier to achieve our goals.
We need to alter the configuration accordingly. We will use the vi text-editor to do so. If you are not familiar with vi, you should consider getting some knowledge first with the vi man page.
You can find the default configuration file in
/etc/rsyslog.conf
This configuration file will be loaded once rsyslog is started.
Open the configuration file by the following command:
vi /etc/rsyslog.conf
Your terminal should look like this:
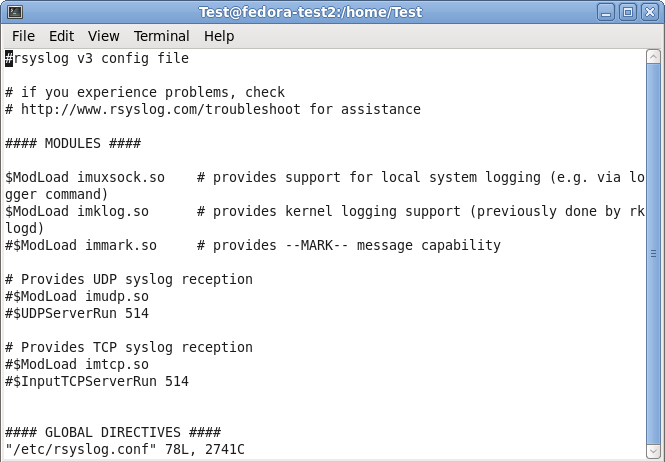
Under the header “#### MODULES ####” you can see the loaded modules. The ones we need are already loaded. For sending syslog, we do not need a extra module to be loaded. Basically, the imuxsock.so is listening to the local log socket and imklog.so provides the support for kernel logging. More is currently not needed.
When going further down in the configuration, we see parts that are called UDP and TCP syslog reception. They are uncommented. We don’t need them, so we leave them that way. As you can see, there is the command to load a module (introduced my $ModLoad) and then a specific command that is given to the module which tells it to run as a syslog server on a specific port.
When scrolling further down in the configuration file, we will find the header “#### RULES ####“.
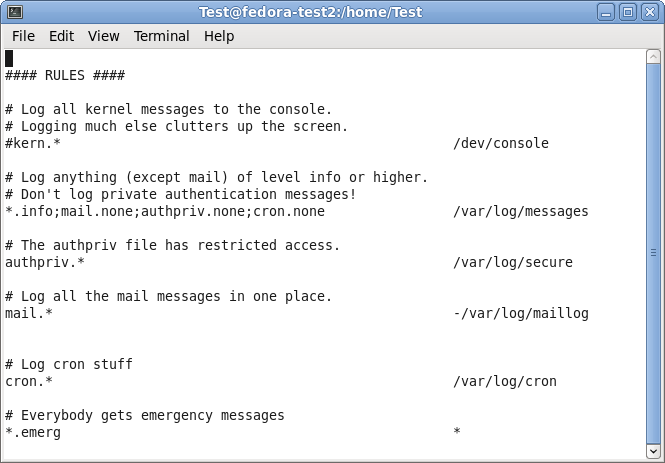
Here, some rules are defined about which logs are stored in which location. These rules have a basic format. Basically, this looks like this:
facility.severity storage_location
The facility roughly determines, what has generated the log message. The severity tells you, how urgent the message is. And the storage location determines, where to store the logs. In the default config, there are several rules for some important log files. They will all be stored in the folder /var/log.
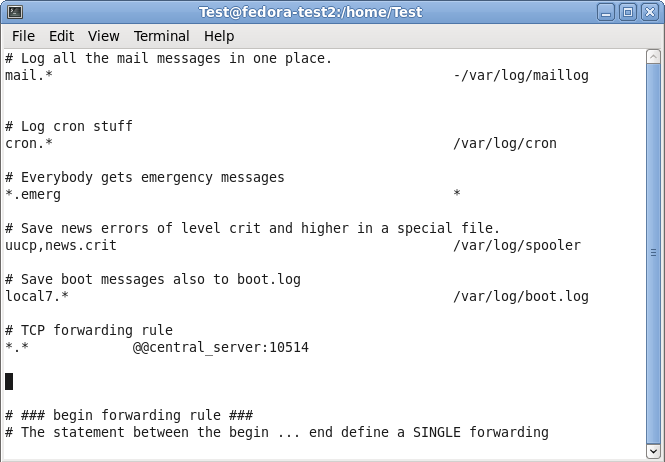
We need to add another rule for forwarding all log messages via TCP syslog. For now, go to the last of the rules and insert the following:
*.* @@central_server:10514
This rule means that all messages, no matter the facility or severity, will be forwarded via TCP to the central server on port 10514. We need to choose port 10514, since our central server will listen to TCP syslog on this port.
In the configuration file, this should look like this:
You can now save and quit vi.
Now that we have altered our configuration according to our needs (which hasn’t been too much), we still have one more thing to do. We need to restart the service.
Now that we are back on the command line, we can easily use the following command:
service rsyslog restart
This will tell the rsyslog service to stop and start again. Thus, the configuration will be loaded with the changes we made.
We are now finished with setting up rsyslog correctly. It will take all the logs it receives and forwards them to our central log server via TCP on port 10514. In addition to that, the default log rules still exist and will log messages to the local harddrive.
Though, there could be many more scenarios and configurations. We decided to keep it simple for a basic setup.
We already have the central server and the regular Windows clients set up. We now need to set up the other Windows servers. We assume, that we have other Windows 2008 Servers. On these servers we want to monitor the local Event Log and textfile-based log files. The log messages shall be transferred to the central server via TCP again.
To achieve this, we need MonitorWare Agent installed on those servers. This is simply because it is able to monitor textfiles in addition to the regular Event Log. In addition to MonitorWare Agent, we need nothing to be installed. Since we want to monitor textfile-based log files, we assume there is an IIS running.
First, we will set up the ruleset. By doing this, we can create the services and they will automatically bound to the ruleset.
Right-click on RuleSets in the left hand list. A context menu will appear. Click on Add RuleSet
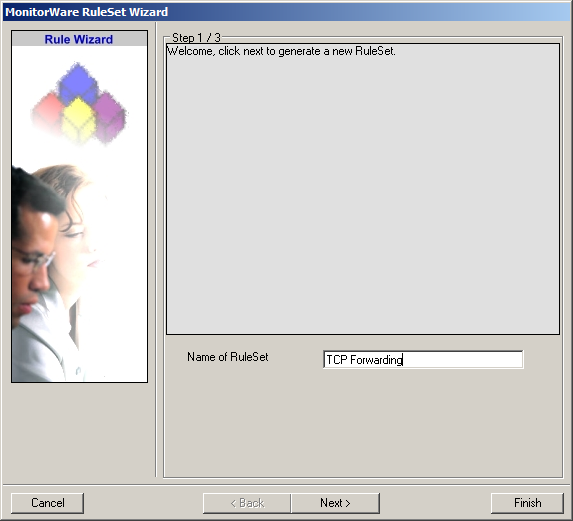
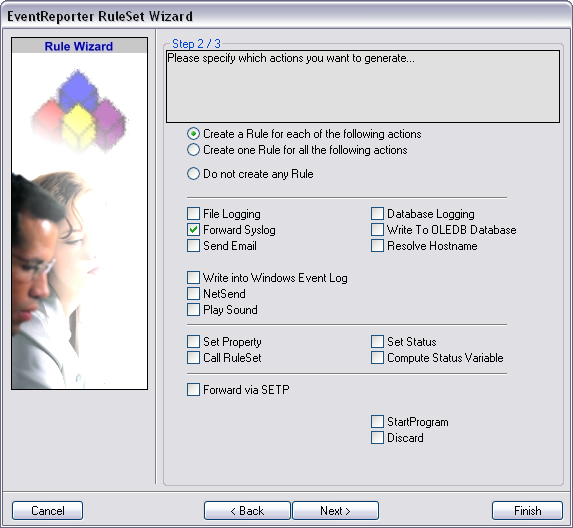
The RuleSet Wizard will appear now. You can give your ruleset a name of course. We will use TCP Forwarding for this example. After that, click on “Next”.
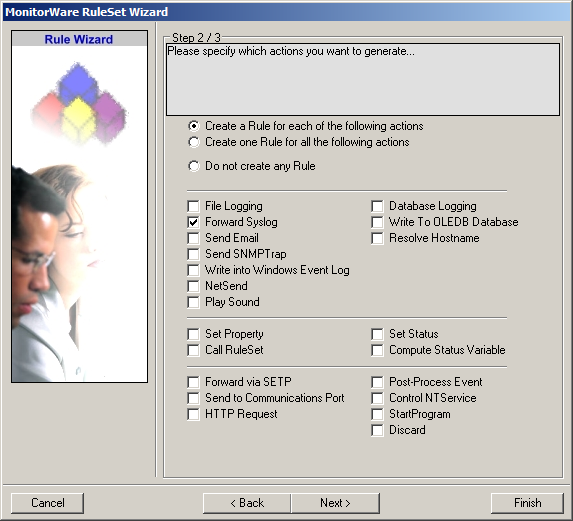
On the second page of the wizard we can specify what actions we want. Since we only want the log messages to be forwarded via syslog, check the box next to “Forward Syslog”. After that, click “Finish” to create the ruleset and action.
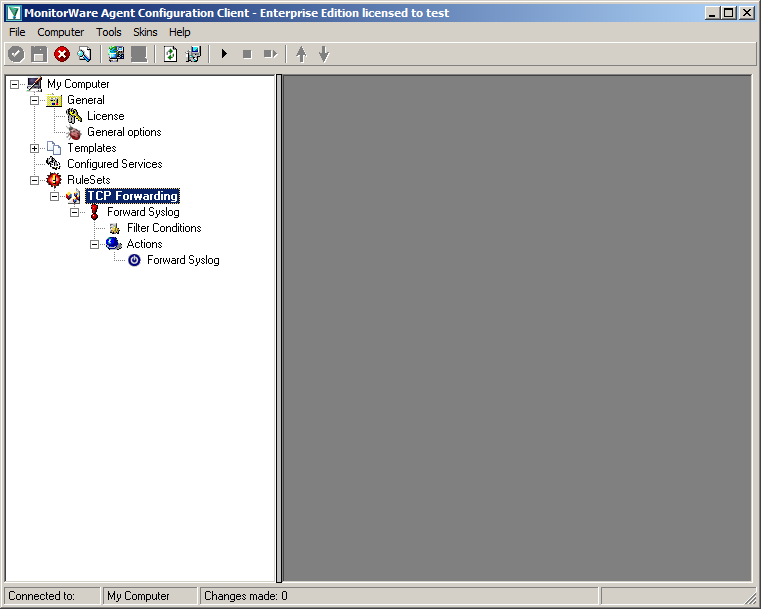
When you expand the treeview now, you will find a rule named “Forward Syslog” with an attached action of the same name.
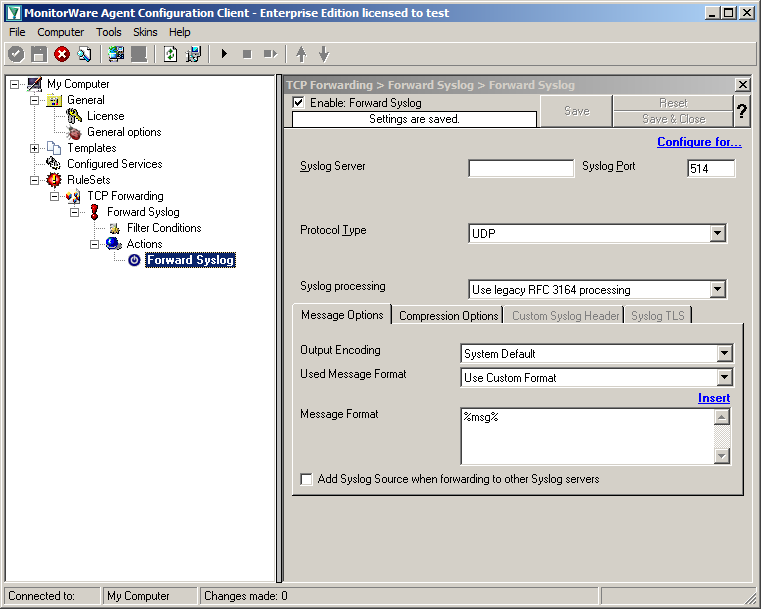
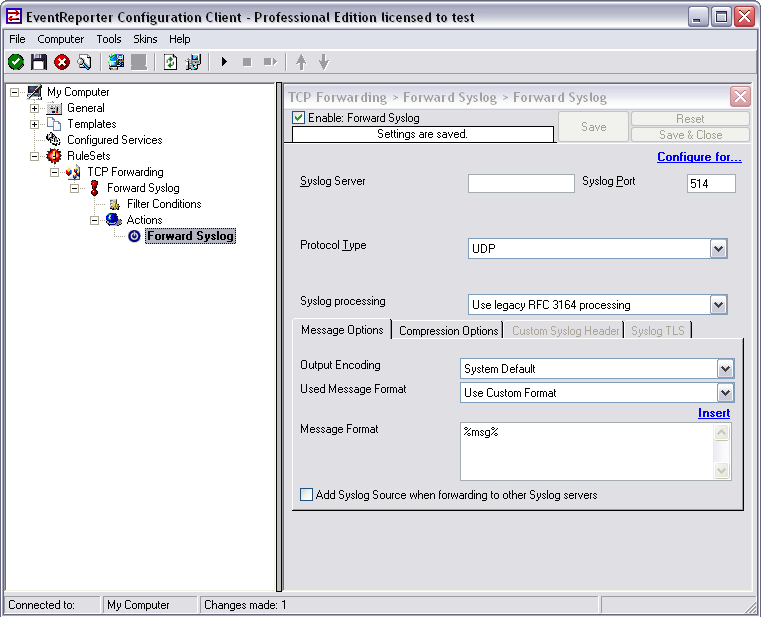
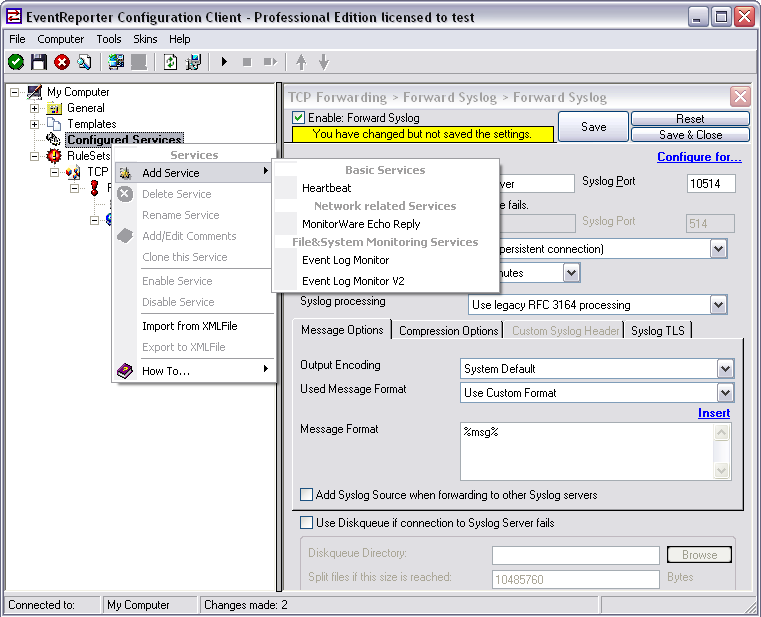
Now click on the action “Forward Syslog. You can see the default values now.
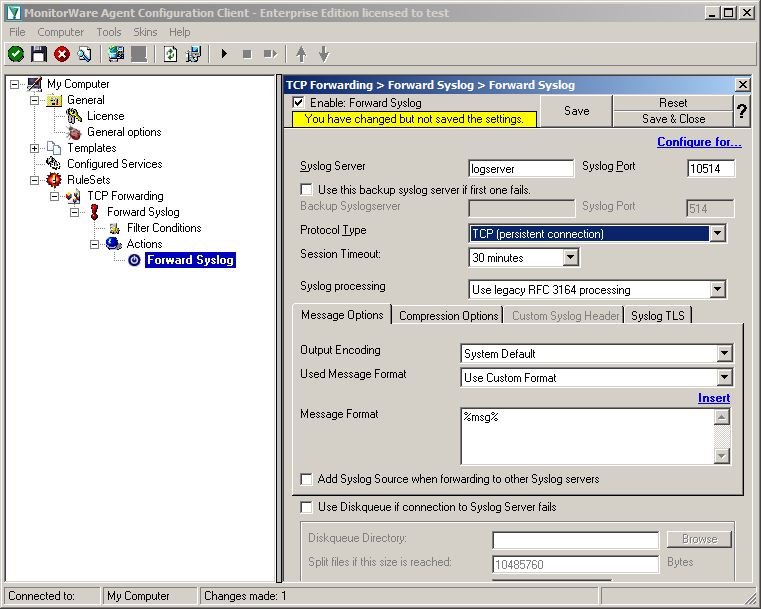
We need to change some of those settings now. First of all we need to enter the IP or hostname of our central server into the field “Syslog Server”. After that, change the port to 10514, since our central server will listen to syslog on this port. And we need to change the protocol type. Change is to TCP (persistent connection). That is all for now. Click on the Save button on the top so we can go on configuring the Service itself.
Currently, when clicking on Configured Services you will not see a thing. But we will configure the services now. Without them, MonitorWare Agent is not able to get any log messages. We will setup 1 EventLog Monitor and 1 File Monitor.
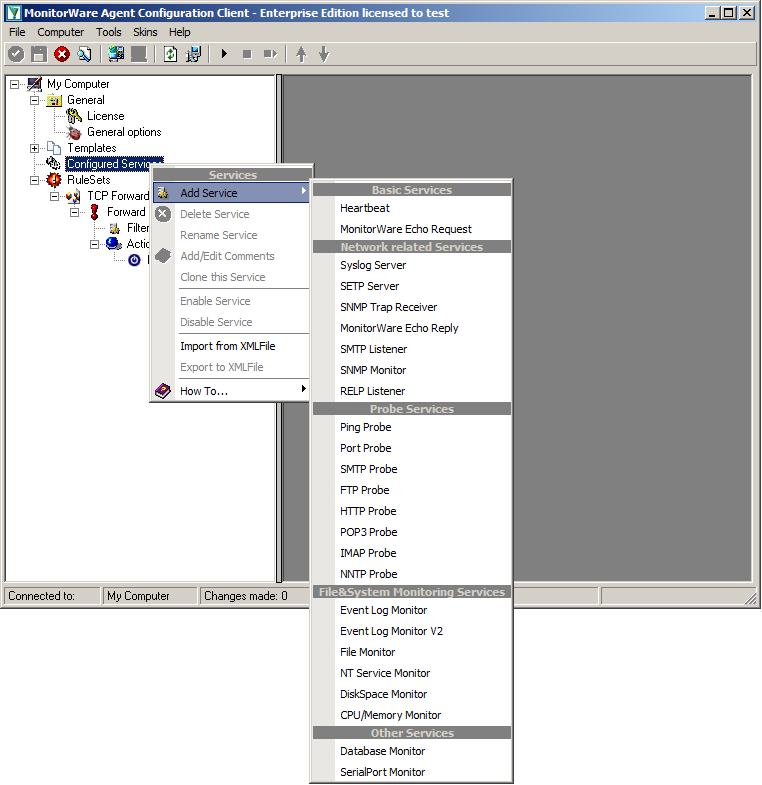
When right clicking on Configured Services a context-menu will open. By moving your cursor to “Add Service” you can see a list of Services, that may be configured. The list seems pretty long, but we basically need 2 services of them.
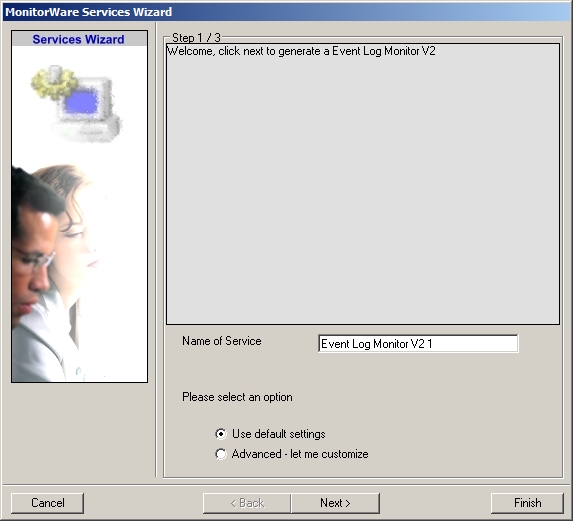
Click on “EventLog Monitor V2” first. The Services Wizard will open. Simply click on Finish for now. Repeat this again for the File Monitor.
In the end, you should have a list with 2 Services. For our example I renamed the services by doing a right-click on the Service name I wanted to change and the choosing “Rename Service”.
Settings for Event Log Monitor V2
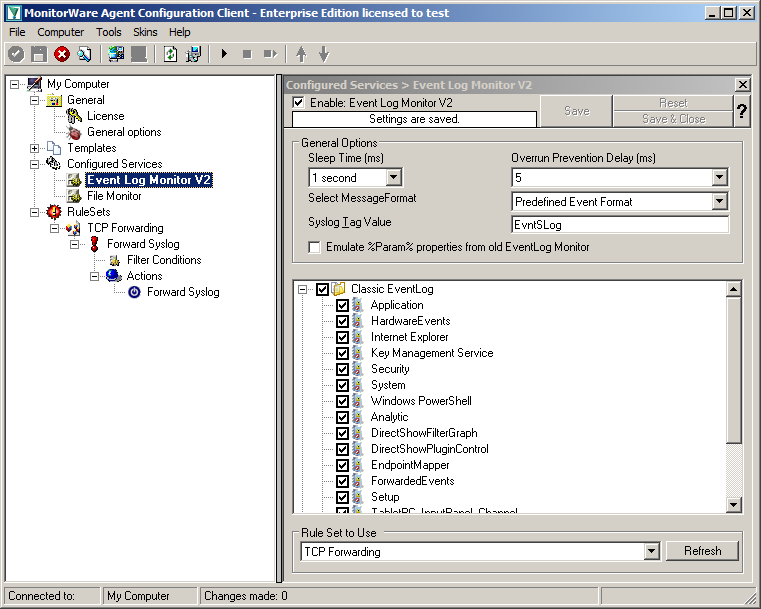
The Event Log Monitor V2 needs no additional setup. Again the default values are ok. If you want specific Event categories not to be stored, you can disable the options. But the basic format is sufficient.
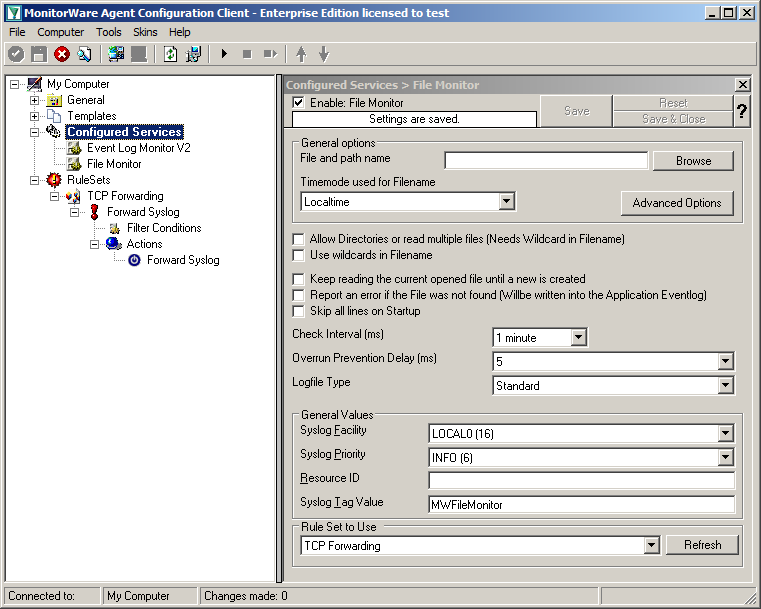
Settings for File Monitor
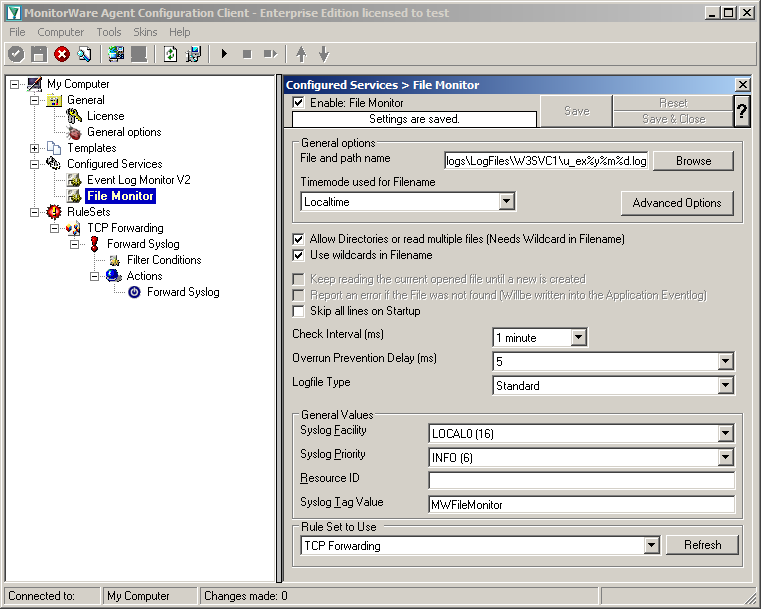
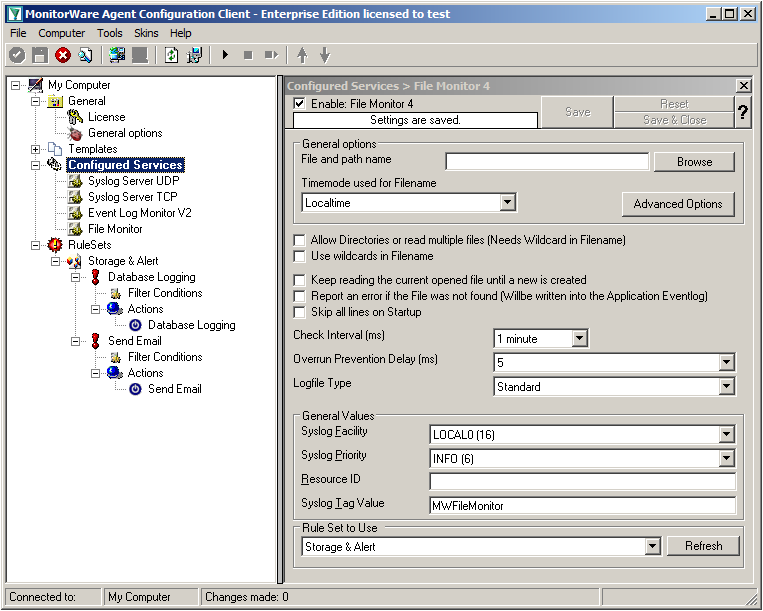
The File Monitor needs some additional settings. First, enable the option “Allow Directories or read multiple files”. You will see, that the use of wildcards will be automatically enabled and some other options completely being disabled.
Then we need to set the source files. For our example, we want to monitor the IIS logfiles. At the top of the File Monitor configuration you can see the option “File and path name”. There is a Browse button right next to it. Click it.
A windows explorer window will open, where you can choose the file you want to monitor. Navigate to the path C:\inetpub\logs\LogFiles\W3SVC1\. This is the location where the log files are stored. Please note, that the file location could be different when using another version of IIS. Choose the first file in the list. (Note: Daily Internet Information Server log files are named “u_exyymmdd.log”, with yy being the 2 digit year, mm the month and dd the day of month. To generate the same name with file monitor, use the following name “u_ex%y%m%d.log”.)
Set the Logfile Type to “W3C WebServer Logfile”.
Please note, that this step can be easily adapted for other log files (e.g. DHCP log files) as well.
We have now finished setting up the other server. You only need to Save the configuration and start the Service with the “Play” button at the top of the Configuration Client. MonitorWare Agent will pull the logs from the Event Log and the text files and forward them via TCP syslog to our central log server.
Setting up the Windows Clients is rather easy. To do this, we only need to have EventReporter installed. EventReporter will be configured to pull the Windows Event Logs and forward them to our central syslog server via TCP syslog. Our example system will be Windows XP.
When you open the Configuration Client, you will see the configuration tree on the left. Most important are the part “Configured Services” and “Rulesets”. Right now, both have no content. But we will change that now.
As a first step, we will set up the ruleset again.
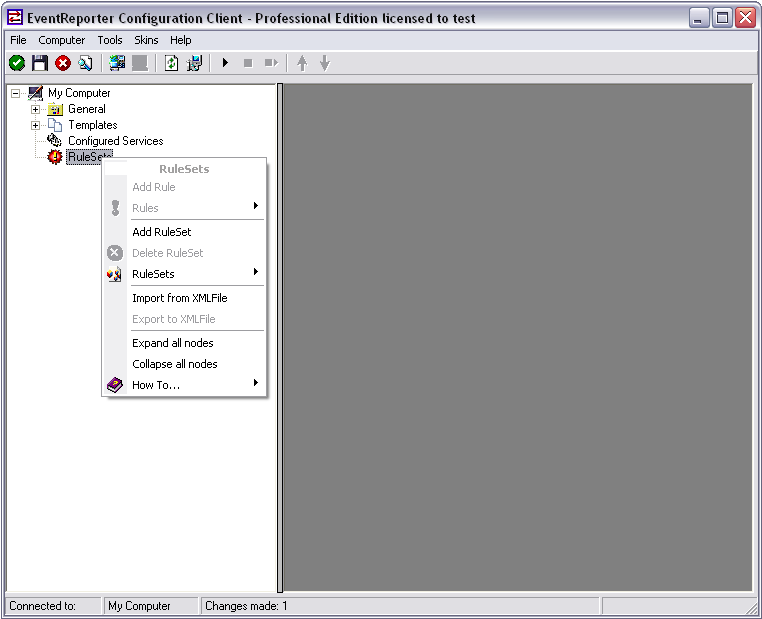
Right-click on RuleSets in the left hand list. A context menu will appear. Click on Add RuleSet
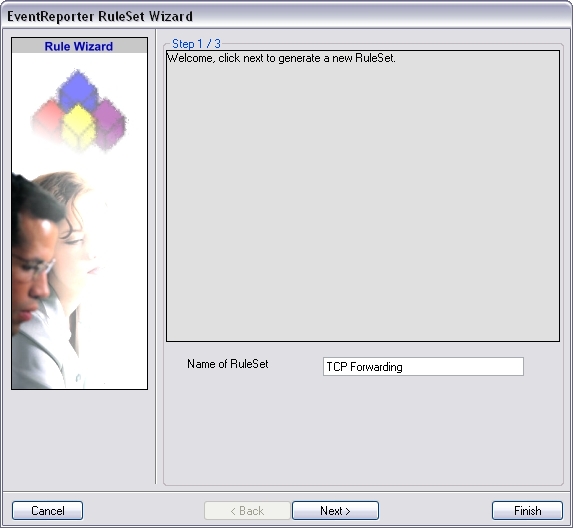
The RuleSet Wizard will appear now. You can give your ruleset a name of course. We will use TCP Forwarding for this example. After that, click on “Next”.
On the second page of the wizard we can specify what actions we want. Since we only want the log messages to be forwarded via syslog, check the box next to “Forward Syslog”. After that, click “Finish” to create the ruleset and action.
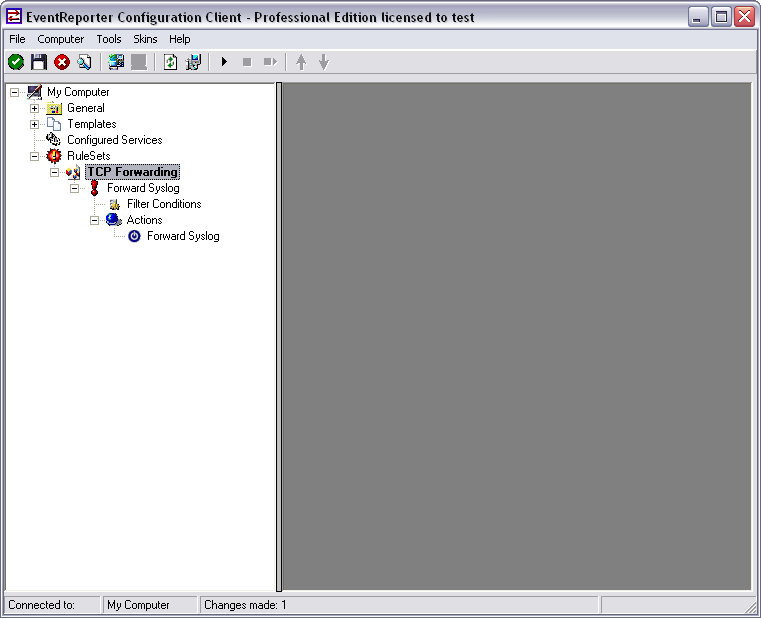
When you expand the treeview now, you will find a rule named “Forward Syslog” with an attached action of the same name.
Now click on the action “Forward Syslog. You can see the default values now.
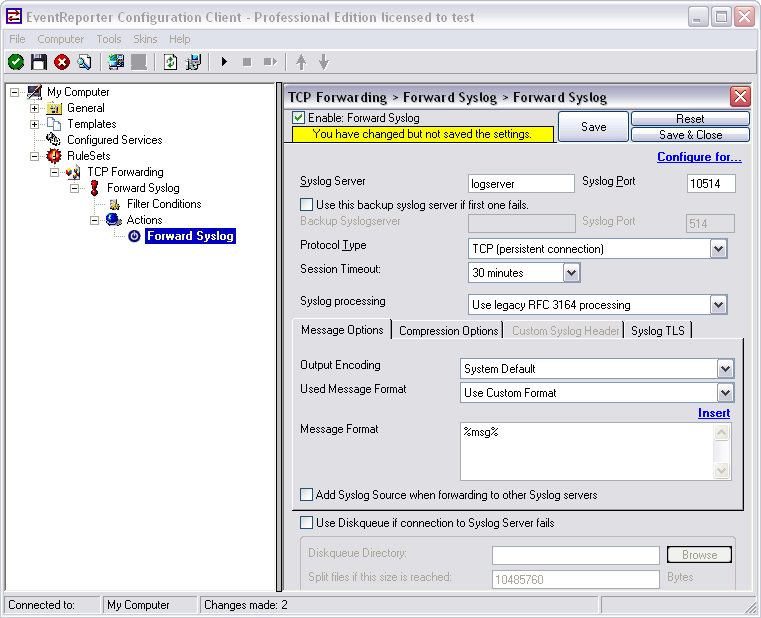
We need to change some of those settings now. First of all we need to enter the IP or hostname of our central server into the field “Syslog Server”. After that, change the port to 10514, since our central server will listen to syslog on this port. And we need to change the protocol type. Change is to TCP (persistent connection). That is all for now. Click on the Save button on the top so we can go on configuring the Service itself.
We need to configure our service now. Right-click on “Configured Services” in the configuration tree on the left to pop up a context menu.
When you go to “Add Service” you will see the list of available Services. The list is a lot smaller than in MonitorWare Agent. We need the regular Event Log Monitor in this case.
Note: If you are using Windows Vista, 7 or Server 2008 you might consider using the Event Log Monitor V2, since it is optimized for the new EventLog that has been introduced with Windows Vista.
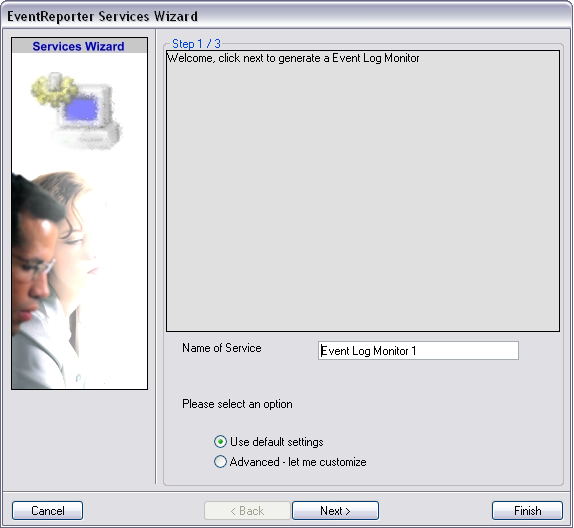
When you have clicked on Event Log Monitor in the list, a wizard will open. Since we will not do any configuration now, just click on “Finish”.
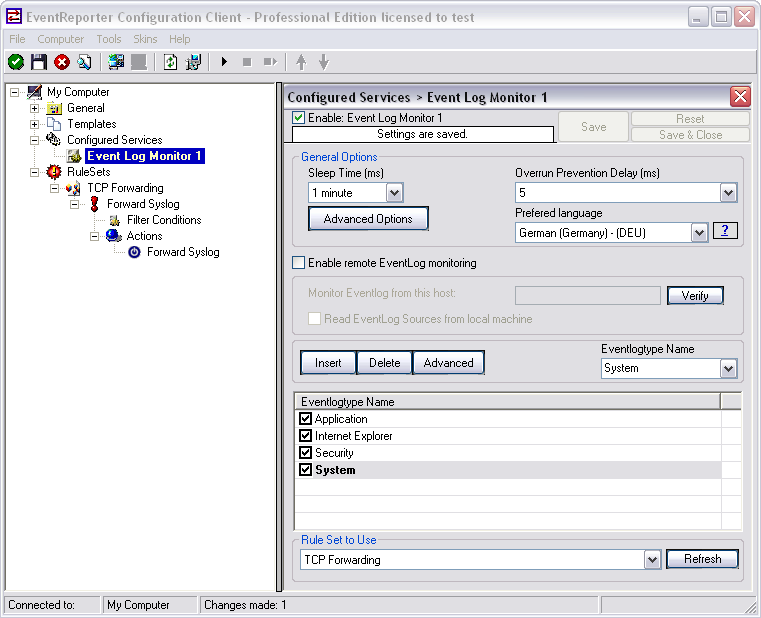
When clicking on Event Log Monitor in the configuration tree you will see the default options. We can leave these settings as they are. Probably you might want to change the preferred language or the sleep time. As you can see at the bottom, the service is already assigned to our ruleset we created earlier. Newly created services will automatically be assigned to the first ruleset in the list.
Basically, that is it. Save the configuration and then start the service with the button that looks like the “Play” symbol. EventReporter will then start to pull Events from the Windows Event Log and forward them via TCP syslog to your central server.
The central log server is the most important part of our central log storage and thus will be configured as the first part. And due to all the things it needs to do, it has the most work of course. When selecting your machine to install the central log server on, please keep in mind, that you need quite a good machine for larger networks. If you have a very large environment, it might be a good idea to use multiple servers for this scenario with a load balancer and a separate database server. But in this guide, we will have it all on one machine.
Prerequisites:
The following should be installed and working:
The list holds the things necessarily needed. In the brackets is schon which we will use in this example. Please note, that this will work with other versions as well, especially with MonitorWare Agent.
As mentioned before, MonitorWare Agent will have multiple purposes. It should receive syslog via TCP and UDP, monitor the local EventLog and textbased logfiles as well as writing everything into a database and sending email messages in case of error and critical messages occuring.
First of all, we will set up the processing rules and actions. We will start this way due to the design of MonitorWare Agent. Since the Services need to be bound to a ruleset upon creation, we will start this way, so the ruleset is there already when creating the service.
When starting MonitorWare Agent the first time, you will see on the lefthand side our overview of “Configured Services” and “Rulesets”. Right now, there shouldn’t be any entries here.
Right click on “Rulesets”. A context-menu will open.

Choose “Add Ruleset”. The ruleset wizard will open. On this first screen, we can choose the name of the ruleset.
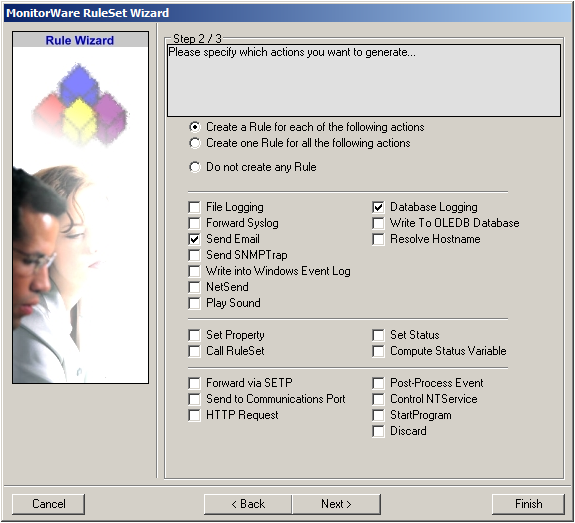
After choosing a name (in this example “Storage & Alert”), click on “Next”. Here we can set, what we will need. Leave the marker for “Create a Rule for each of the following actions” and choose “Send Email” and “Database Logging”.
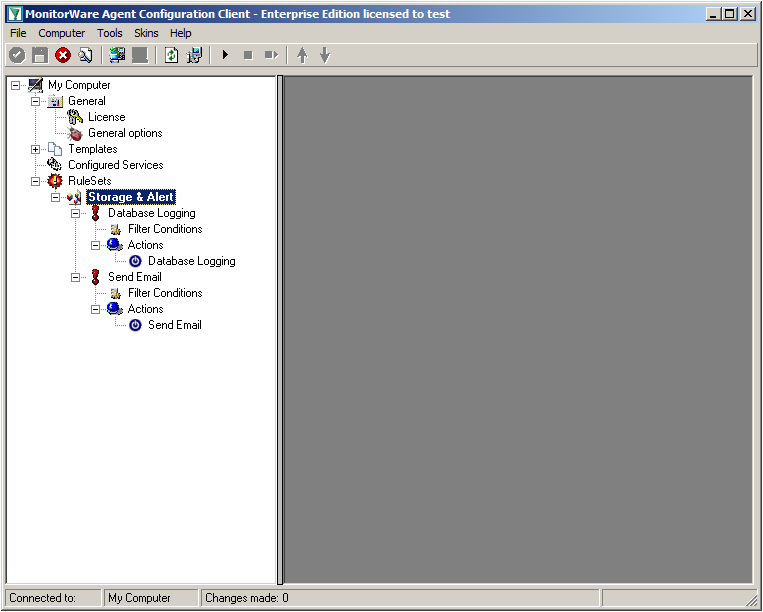
You can now click on Finish. You will now see a new ruleset in the treeview on the left hand side. If you expand this view completely, you can see the two rules that have been created and the actions that are in there. You should have a rule “Database Logging” and a rule “Send Email”.
We will now start with configuring the action for “Database Logging”. Expand the branch called “Database Logging” completely. Under actions you will find the “Database Logging” action. When you click it, you will see the configuration window.
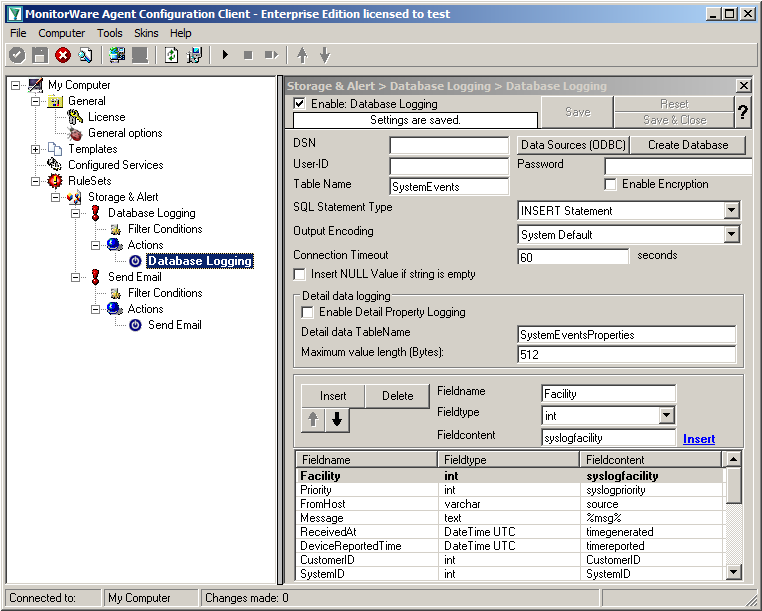
Click on the button “Data Source (ODBC)”. This will open the ODBC Data Source Administrator.
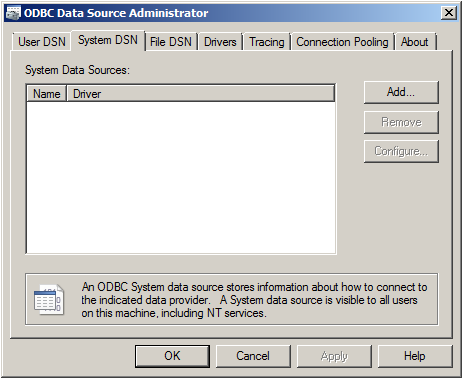
Go to System DSN and click “Add…”.
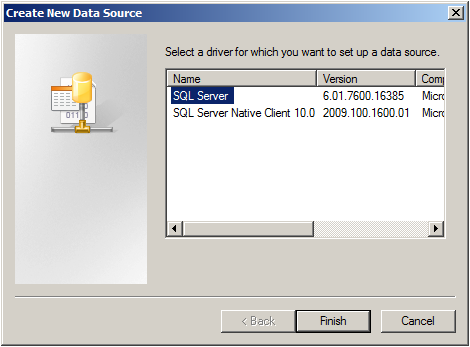
Select SQL Server from the list and click “Finish”.
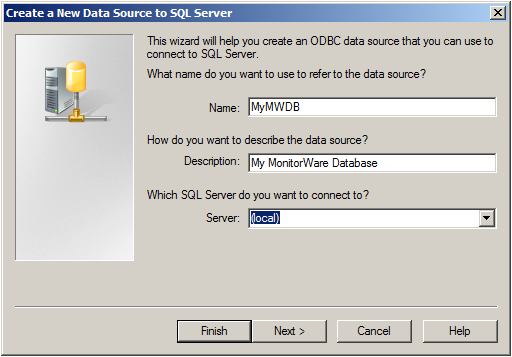
Choose a name for the datasource and a description. In this case we choose MyMWDB as name. As server choose the name of the server where the database is. In our example we use localhost. Now click on “Next”.
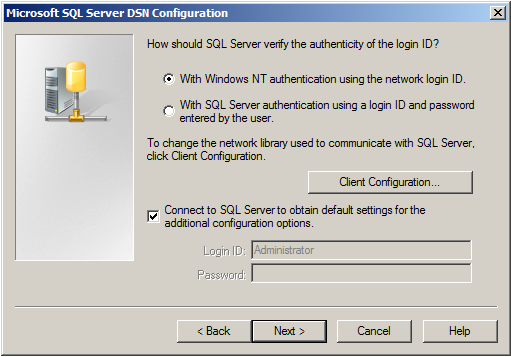
Select “SQL Server Authentication” and type in your MSSQL Login ID and Password. If you have Windows NT authentication like in our case, leave it as is. Click on “Next”.
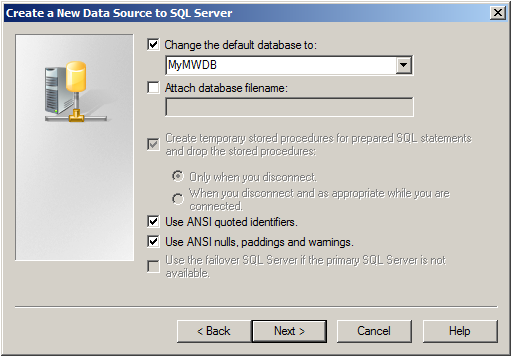
Select “Change the default Database to:” and choose your new created Database, in our example we use “MyMWDB” which we created beforehand. Click on “Next”.
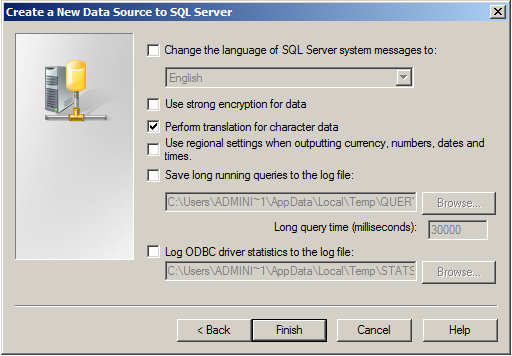
Leave all at default settings and click “Finish”, a test Window will appear:
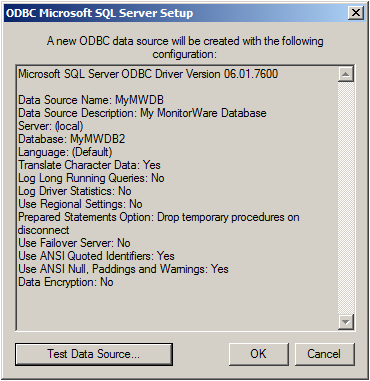
Click on “Test Data Source”, normally the following Window should be displayed:
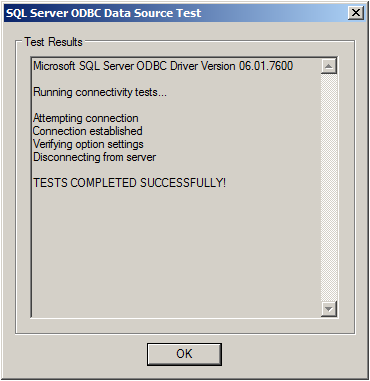
If not, go back and check your Settings, if yes, Click “OK” and exit the System-DSN Wizard.
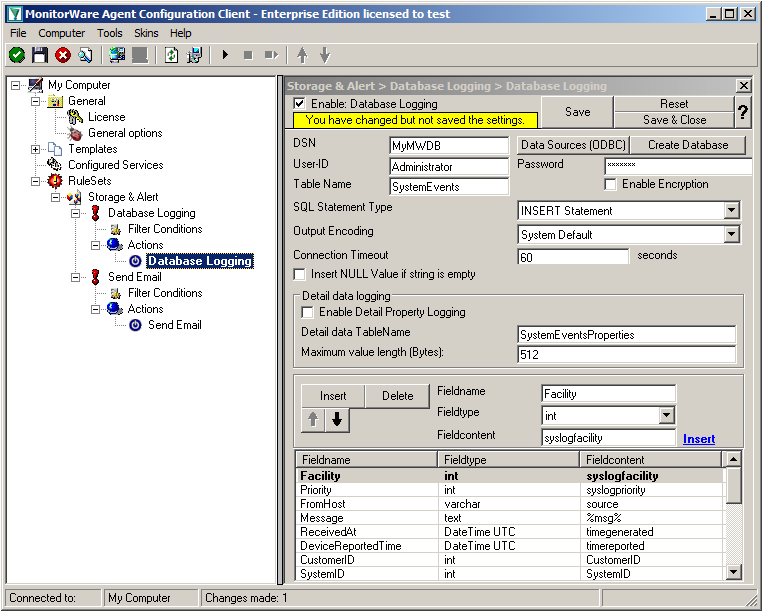
Now we are back in MonitorWare Agent. Insert the DSN for your database, User-ID and Password.
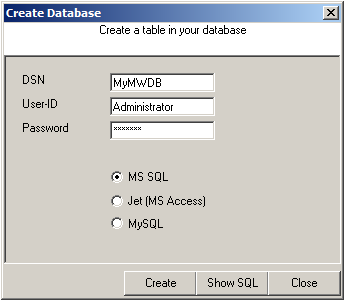
After that, click the “Create Database” button. We still need the tables that the log messages will be stored in. After clicking the button, a small window will open. Insert the DSN, User-ID, Password and choose the type of database you are using, in our case MS SQL. By clicking on the “Create” Button, the tables needed for the default database format of the MonitorWare Products will be created. After that, close the window.
Since we want to log all messages into the database, there is no need to set up any filters.
In the next step, we want to set up the Send Email rule. But since we only want error log messages, we need to set some filters. Click on the Filter Conditions. You will see the overview over the filters for this rule.
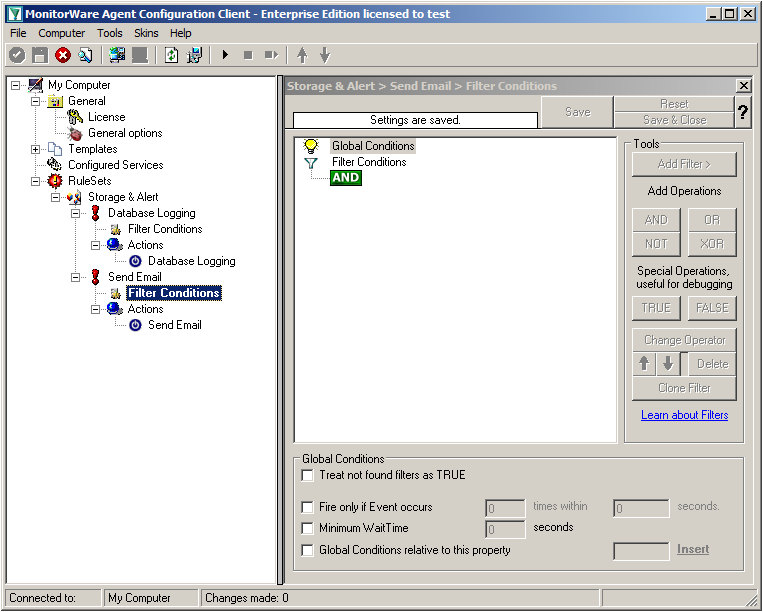
Right now, the view is empty except for a AND operator. Double-click it to change it into a OR operator.
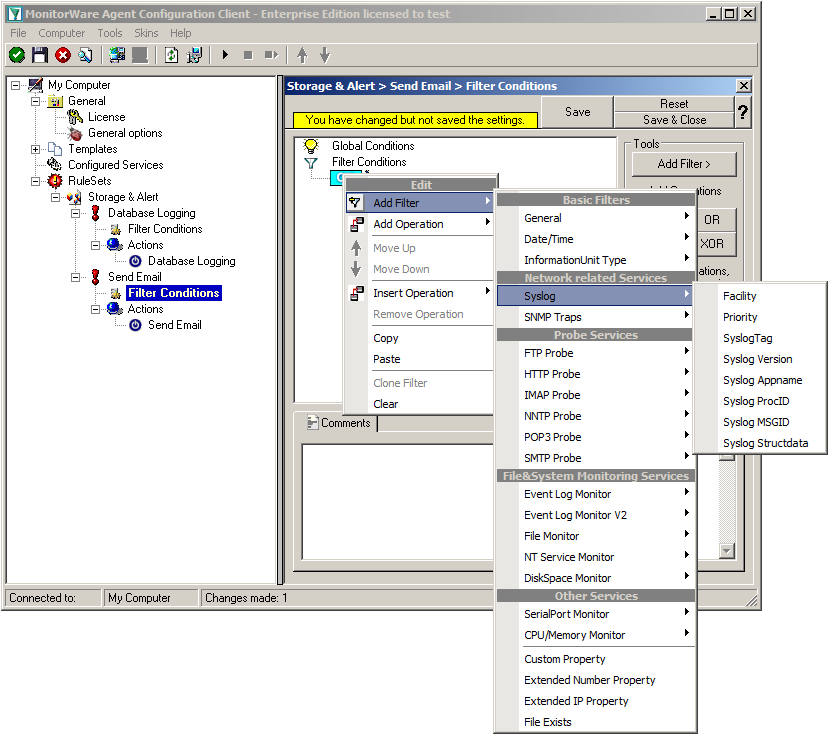
Right-click on the OR operator. A context menu will open. Go to Add Filter -> Syslog -> Priority.
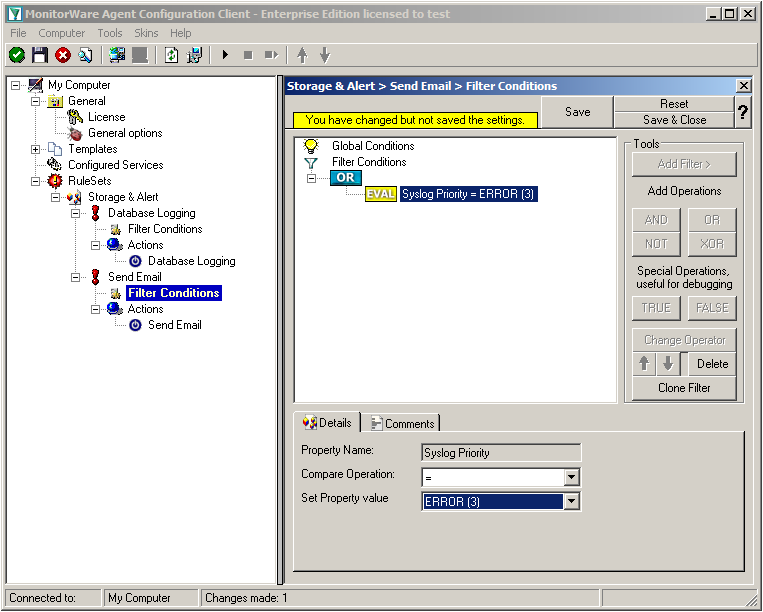
Click on the filter setting and change the property value to “Error (3)”.
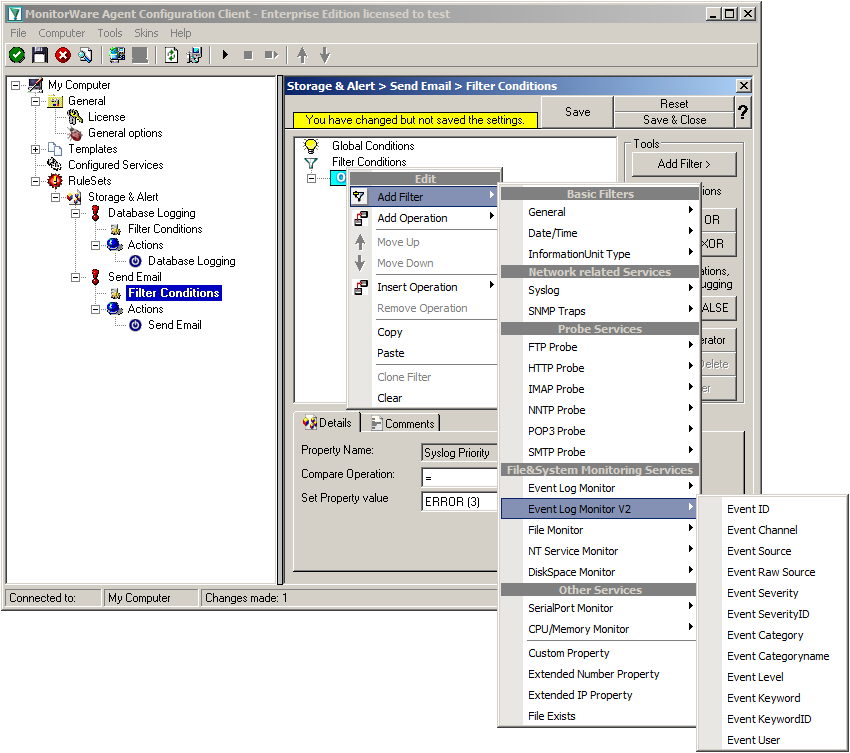
Again click on Add Filter -> EventLog Monitor V2 -> Event Severity.
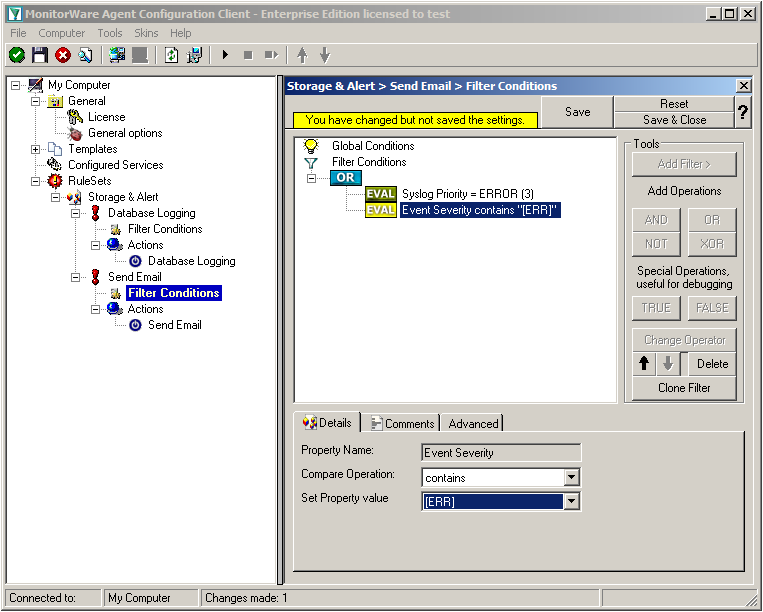
Click on the second filter setting and change the property value to “[ERR]”.
We are now finished with the filter settings. The filter will accept all log messages that are either of syslog proiority error or critical or Windows Event severity error. The OR operator ensures, that every of these cases will be accepted. When the messages are approved of fitting into the filter, the action will process them.
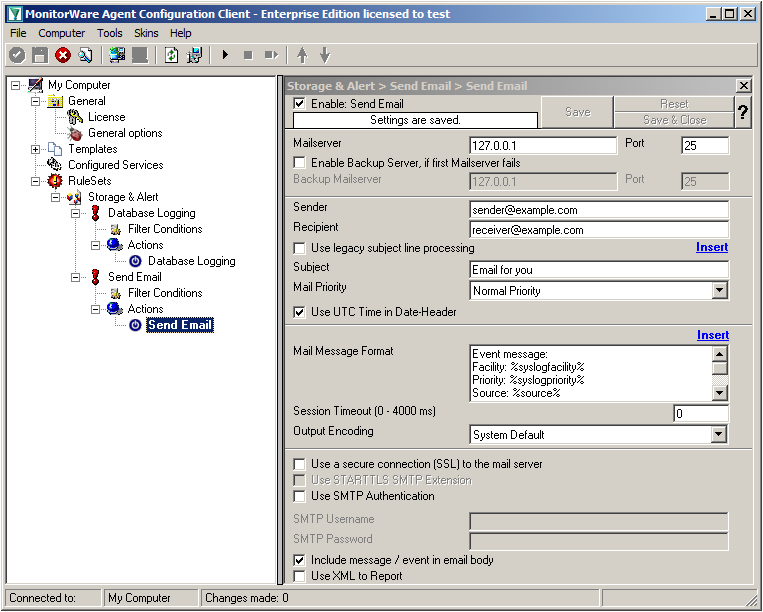
Click on the “Send Email” action now. You will see the configuration window on the right pane. Currently, there are only the default values in there.
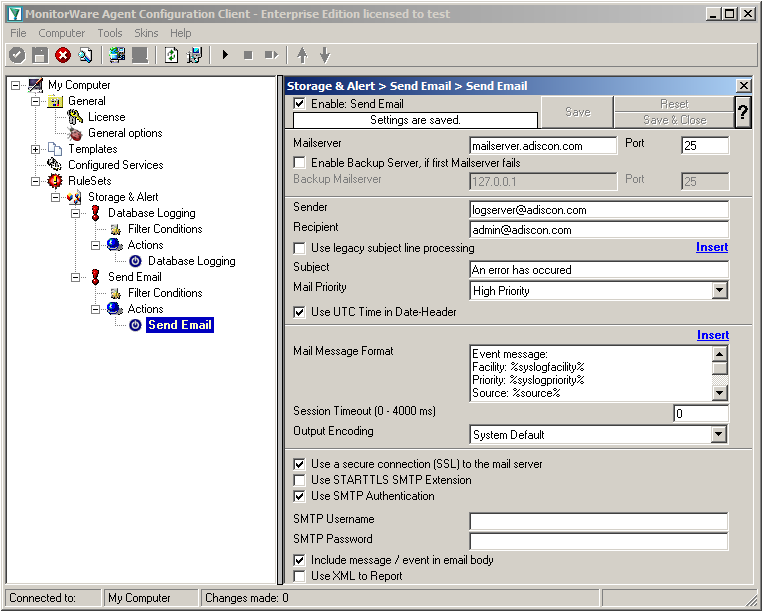
We need to change some settings here, like the Mailserver, Sender and Recipient, the subject and the Mail Priority. If necessary for your mail server, you need to change the authentification settings at the bottom as well. in our example we need SMTP Authentication for that. If you want, you could even enable the backup mail server.
Now we have all actions fully configured. It is now time to setup the configured services.
Currently, when clicking on Configured Services you will not see a thing. But we will configure the services now. Without them, MonitorWare Agent is not able to get any log messages. We will setup 2 Syslog Receiver, 1 EventLog Monitor and 1 File Monitor.
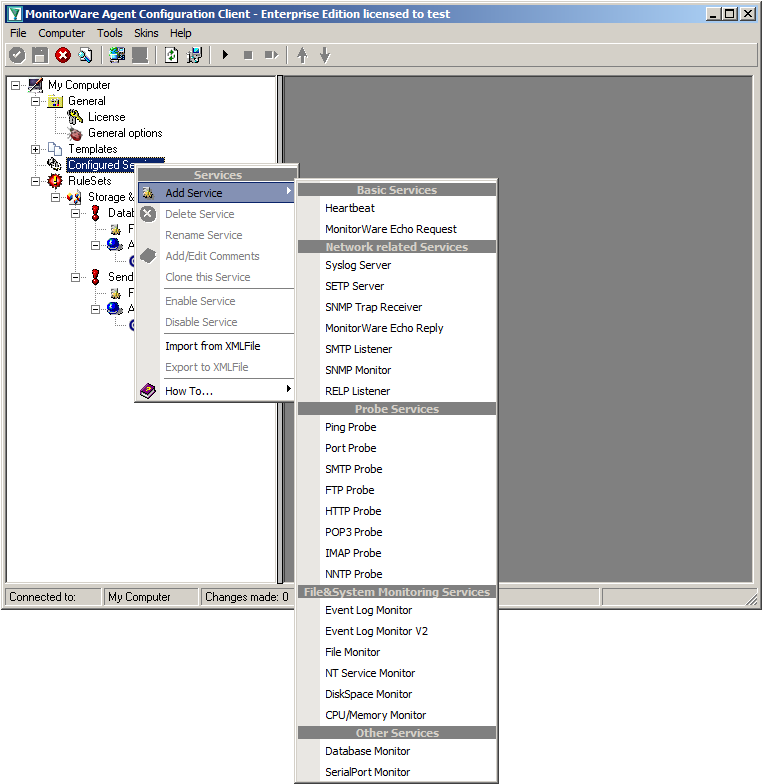
When right clicking on Configured Services a context-menu will open. By moving your cursor to “Add Service” you can see a list of Services, that may be configured. The list seems pretty long, but we basically need 3 services of them.
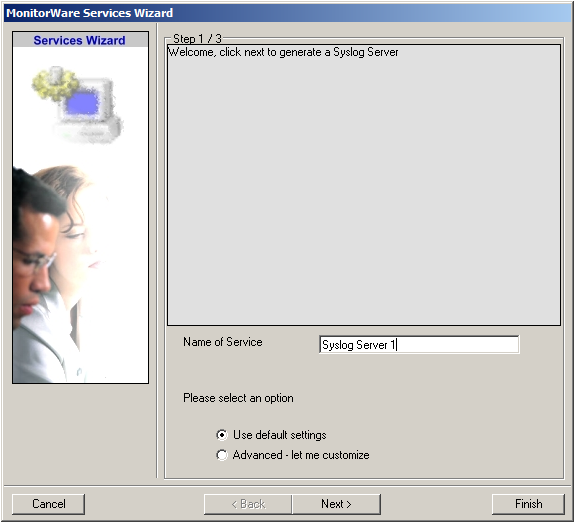
Click on “Syslog Server” first. The Services Wizard will open. Simply click on Finish for now. Repeat this again for Syslog Server, EventLogMonitor V2 and File Monitor.
In the end, you should have a list with 4 Services. For our example I renamed the services by doing a right-click on the Service name I wanted to change and the choosing “Rename Service”. This was mostly to distinct the two Syslog Servers.
Settings for Syslog Server UDP
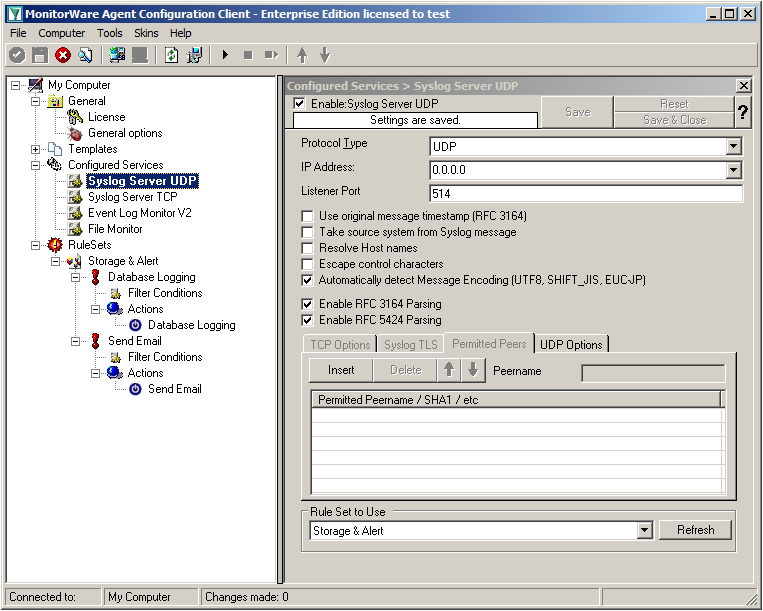
We can leave the “Syslog Server UDP” on default settings. It is already listening to UDP on port 514. The rest of the default settings is just fine.
Settings for Syslog Server TCP
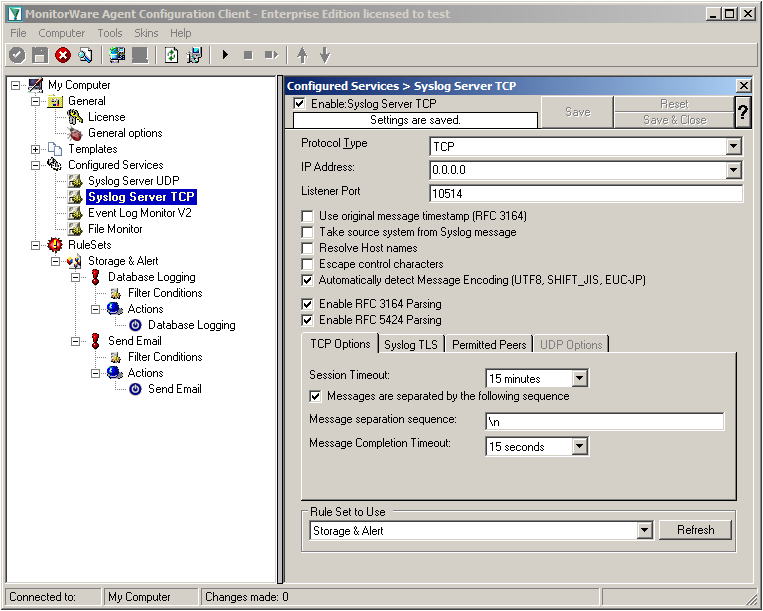
We will now go to the “Syslog Server TCP” now. Here we need to change several settings. Change the protocol type to TCP and the Listener Port to 10514. Further, we need to enable the option “Messages are separated by the following sequence” in the TCP options. It should look like this now:
Settings for Event Log Monitor V2
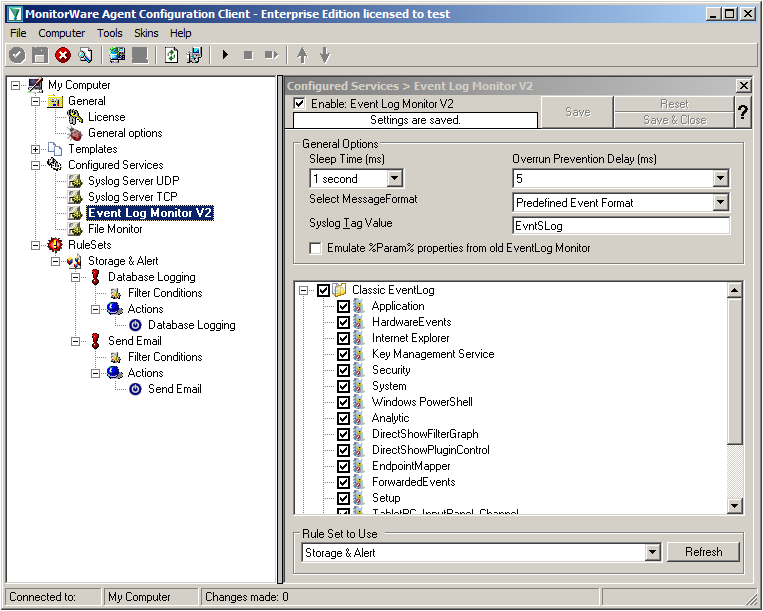
The Event Log Monitor V2 needs no additional setup. Again the default values are ok. If you want specific Event categories not to be stored, you can disable the options. But the basic format is sufficient.
Settings for File Monitor
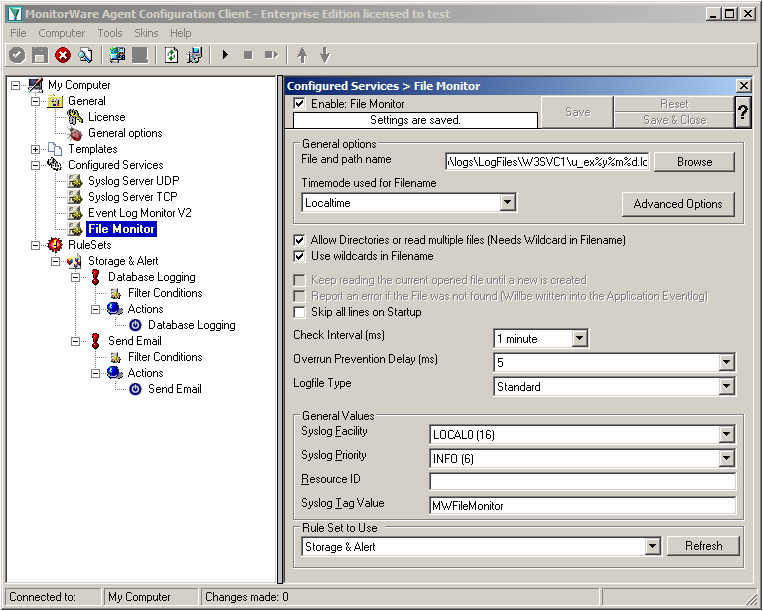
The File Monitor needs some additional settings. First, enable the option “Allow Directories or read multiple files”. You will see, that the use of wildcards will be automatically enabled and some other options completely being disabled.
Then we need to set the source files. For our example, we want to monitor the IIS logfiles. At the top of the File Monitor configuration you can see the option “File and path name”. There is a Browse button right next to it. Click it.
A windows explorer window will open, where you can choose the file you want to monitor. Navigate to the path C:\inetpub\logs\LogFiles\W3SVC1\. This is the location where the log files are stored. Please note, that the file location could be different when using another version of IIS. Choose the first file in the list. (Note: Daily Internet Information Server log files are named “u_exyymmdd.log”, with yy being the 2 digit year, mm the month and dd the day of month. To generate the same name with file monitor, use the following name “u_ex%y%m%d.log”.)
Set the Logfile Type to “W3C WebServer Logfile”.
Please note, that this step can be easily adapted for other log files (e.g. DHCP log files) as well.
We have now finished the configuration for our central server. It will now be able to receive syslog either via TCP (port 10514) or UDP (port 514), monitor the local Event Log as well as the IIS logfiles. Once more click the “Save” button to save the configuration (if not done already) and start the service. All log messages will now be stored into the database as they arrive/occur. Further, administrators will be alerted via email once an error occurs.