How To Generate Reports with MonitorWare Console Manually (For Windows
Reporting Module – applicable for 2.0)
Article created 2004-03-10 by
Tamsila-Q-Siddique.
1. You would need Base Product Key and Window Reporting Module Key for this
scenario.
2. Once MonitorWare Console 2.0 is opened, on the left hand side, you can see a
tree view with a node called “Reports”. Click on that node. It will show you
the list of available reports under it as well as on the right hand side. You
will see something similar to the following figure:
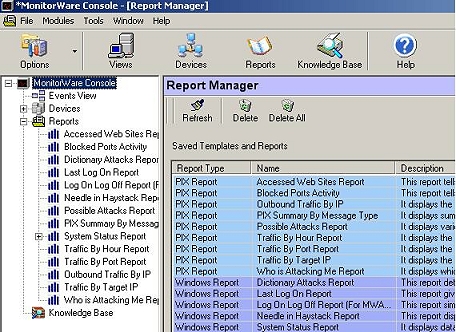
You can now click on any of the displayed reports. For the purpose of this
article, I have selected “System Status Report” because it is a very
comprehensive report and summarizes the overall network activity very well.
Once you click on the System Status Report, you will see something similar to
the figure shown below.
Note: Windows Reports are displayed in a band of Lilac whereas the PIX
Reports are displayed in a band of Blue.
3. Once you click on System Status Report, the following form will be displayed
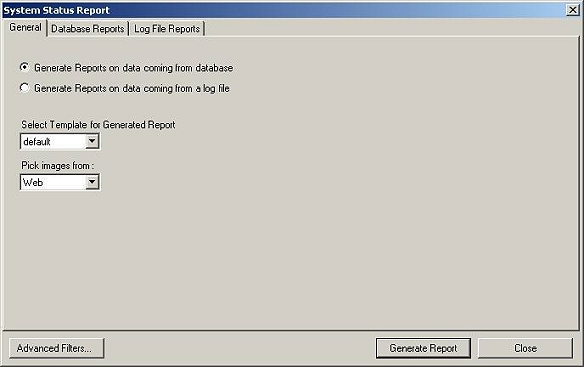
4. This form displays the report options. If you double clicked on any “Report”,
then in that case, this form will open up with default options that you had
set. (For details about defining global settings, please refer to MonitorWare
Console’s Manual which can be accessed by pressing the Help button in
MonitorWare Console’s tool bar). These settings help you out if you want to
generate many reports with almost the same settings.
Of course, you have the liberty to overwrite these settings. You can generate
reports on the data using the underlying database (even from an another
database) or from a log file.
You have the option of generating the reports on the fly. Even if MonitorWare
Console is connected to some other database, still you can give any DSN, its
user name and its password and the report will be generated on that
particular
database to which the DSN is pointing to. The same approach can be used with
the log files. You can override the default log file settings and MonitorWare
Console can generate reports using some other log file, still you can give Log
File Configurations in the above fields and the report will be generated on
that particular log file.
If “Generate Reports on data coming from database” is checked then all of the
controls on “Log File Reports” tab will be disabled. If “Generate Reports on
data coming from a log file ” is checked then then all of the controls on
“Database Reports” tab will be disabled. It means that these are mutually
exclusive.
You can select various templates for the HTML reports that will be generated
from the general tab and this tab also allows you to pick images from web or
from the local disk
5. MonitorWare Console provides a powerful feature of letting users define and
apply filters on any report. Using this form is further explained in the
upcoming steps, you can apply the filters of your own choice on the underlying
database or on the log files. (For details about the filters, please refer to
MonitorWare Console’s Manual which can be accessed by pressing the Help button
in MonitorWare Console’s tool bar).
Case 1:
6. Lets assume in this scenario that, I am interested in getting a report for
the records that were logged (into the underlying database) after March 12, 2004
and were from the machine computer01.
7. For this scenario select the “Generate Reports on data coming from database”
option from the general tab. Switch to the Database Reports tab and setup the
filter in the following way:
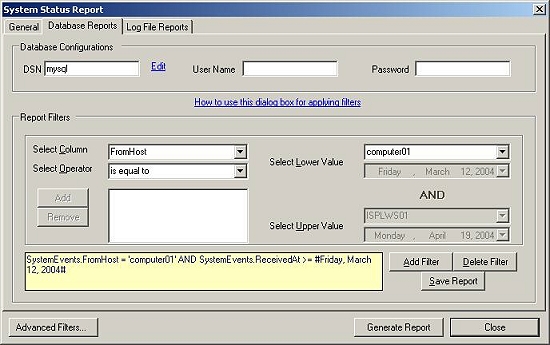
8. At the bottom left of the screen shot above, you can see there is a button
which is called “Advanced Filters”. The settings made in this form applies on
the form as a whole. If you click on this button, a form similar to the one
shown below will pop up:
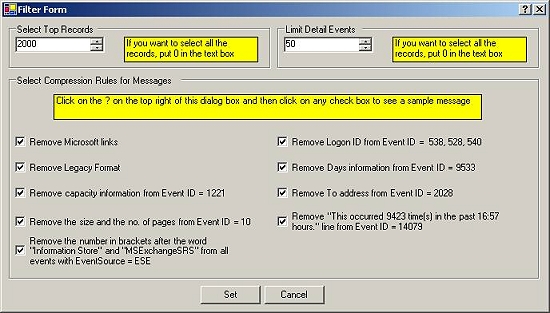
With this Advanced Filters’ Form, you can specify some additional filters for
the System Status Report. This Advanced Filter form provides an opportunity to
consolidate the records to a great extent. I will give one example to clarify
this. Some events that are generated in the Windows Event Log have the same
message but sometimes contain different Microsoft links. If you select the
check box “Remove Microsoft links” above, it will remove the Microsoft links
before consolidating them and hence a number of different events with count 1
could be consolidated to just a single line. Please note that it doesn’t remove
the information permanently from the database. It just removes this information
for generating this report. Similarly other check boxes can be checked to
provide a greater level of consolidation.
9. Once you define the advanced filters in the form shown above, press the “Set”
button. You will be taken back to the previous Filter From.
10. Once you have defined all the filters, you can actually save all of your
settings by pressing the “Save Report” Button in the Filter Form so that you
don’t have to define these filters daily if you are interested in seeing this
report daily.
11. You can now press the “Generate Report” button. It will open up a report in
HTML format according to your defined filters as shown below: (Please note that
some information has been removed purposely for security reasons)
In this report, you also have the option of expanding and contracting the node
of From Host, Event Log Type, Event Source and Event Id.
Case 2:
12. Lets assume in this scenario that, I am interested in getting a report on
all the records that were logged (into the log file).
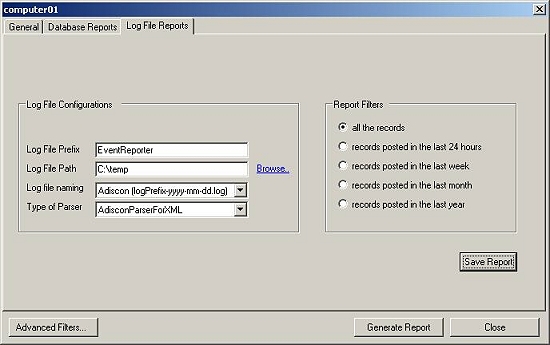
13. For this scenario select the “Generate Reports on data coming from a log
file” option from the general tab. Switch to the Log File Reports tab and setup
the filter in the following way:
14. Once you have defined the filters, you can actually save all of your
settings by pressing the “Save Report” Button in the Filter Form so that you
don’t have to define these filters daily if you are interested in seeing this
report daily.
15. You can now press the “Generate Report” button. It will open up a report in
HTML format according to your defined filters as shown below:
In this report, you also have the option of expanding and contracting the node
of From Host, Event Log Type, Event Source and Event Id.
Note: You can have a look at other available
Windows Reports.