Last updated 2016-08-26 by Jan Gerhards, using Winsyslog 13.2.
In this scenario, a simple Syslog server will be created. No other services are configured. The Syslog server will operate as a standard Syslog server on the default port of 514/UDP. All incoming data will be written to a single text file.
Step 1 – Defining a Rule Set for File Logging
The rule set specifies what action to carry out. You might be tempted to define the service first, but starting with the rule set makes things easier as it will be already present when the service is defined later and needs to be bound to a rule set.
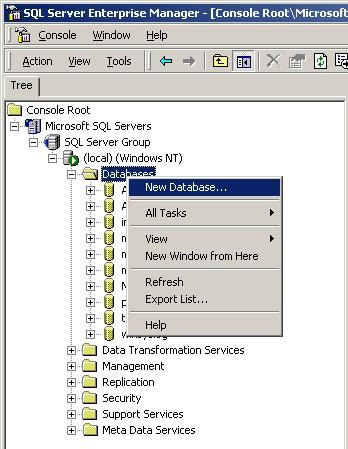
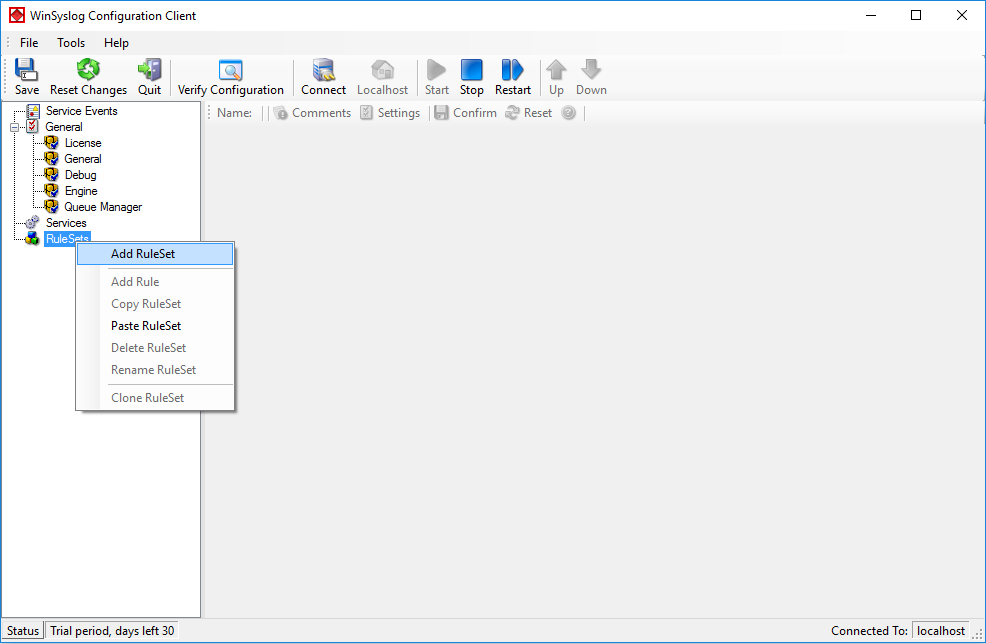
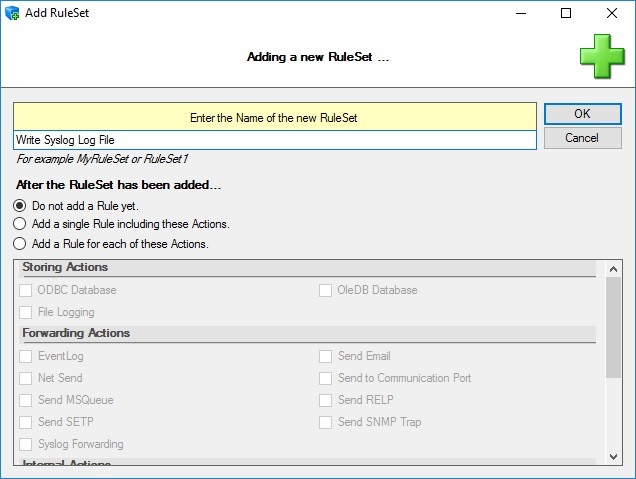
To define a new rule set, right click “RuleSets”. A pop up menu will appear. Select “Add Rule Set” from this menu. On screen, it looks as follows:
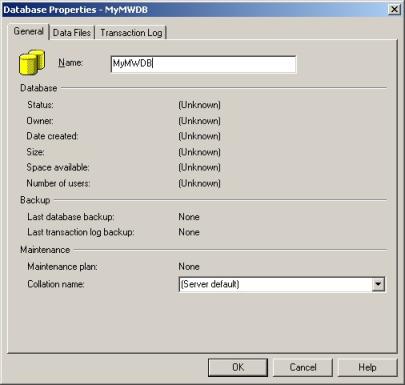
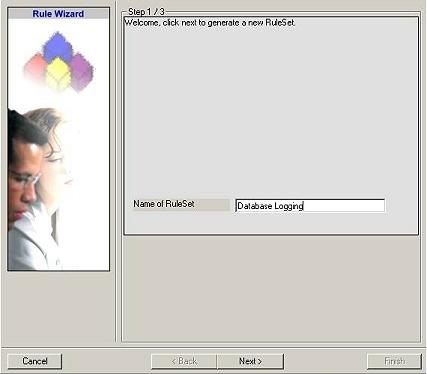
Then, a wizard starts. Change the name of the rule set to whatever name you like. We will use “Write Syslog Log File” in this example. The screen looks as follows:
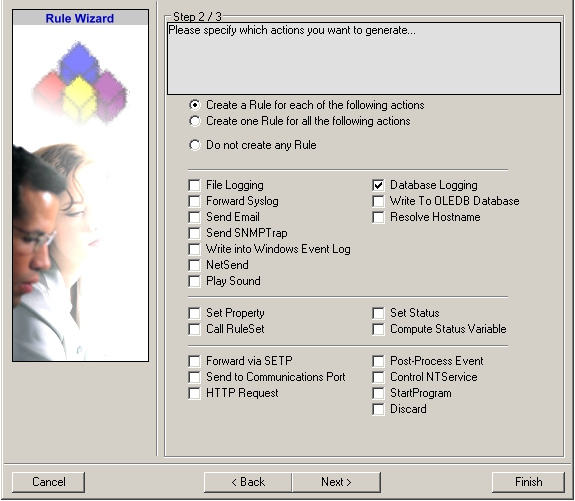
After that, select “Add a Rule for each of these Actions”. You should then be able to change settings in the before greyed-out area. There, select “File Logging” (subitem of “Storing Actions”). Your screen should now look like this:
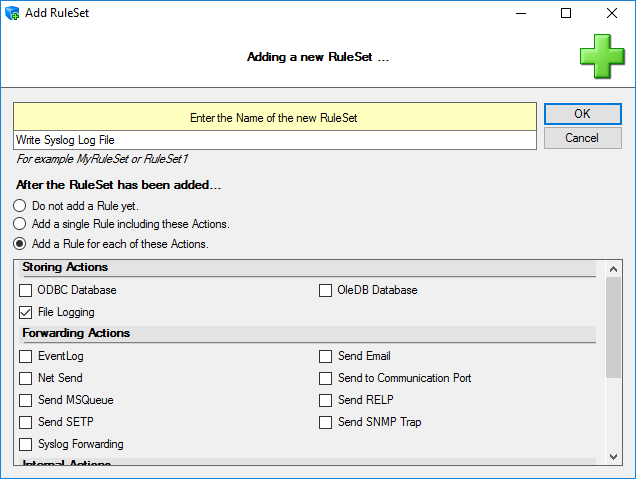
After that, click “OK” and the wizard will close. The client will now show a newly created rule set.
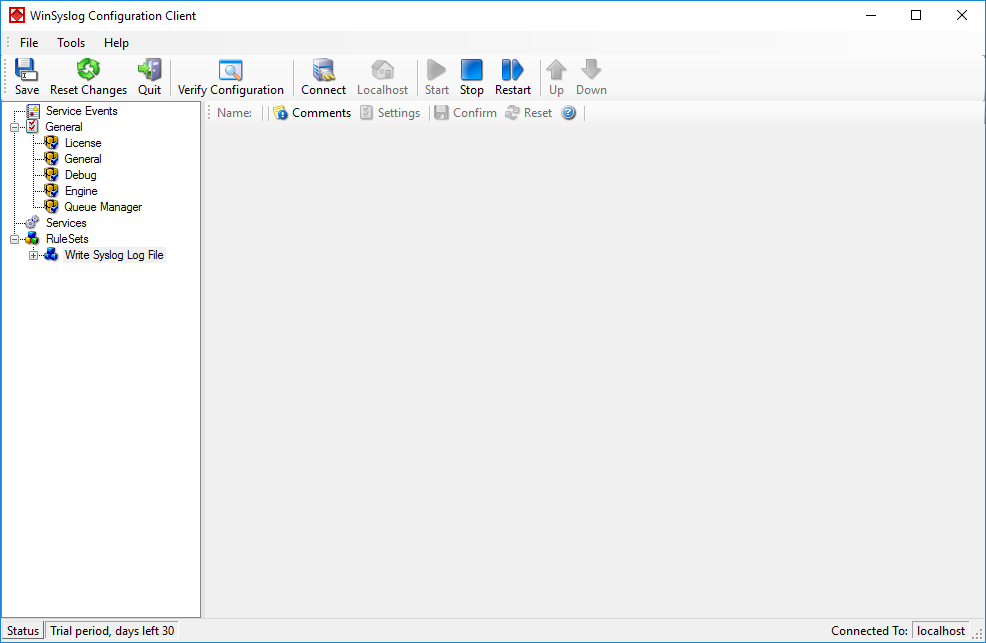
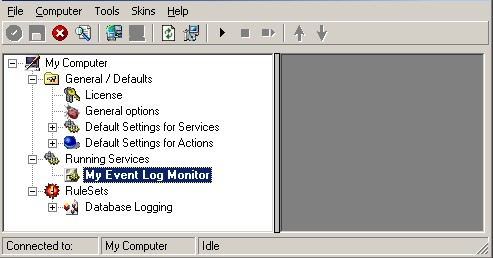
As you can see, the “Write Syslog Log File” rule set is now present. Please expand it in the tree view until you have the following screen contents:
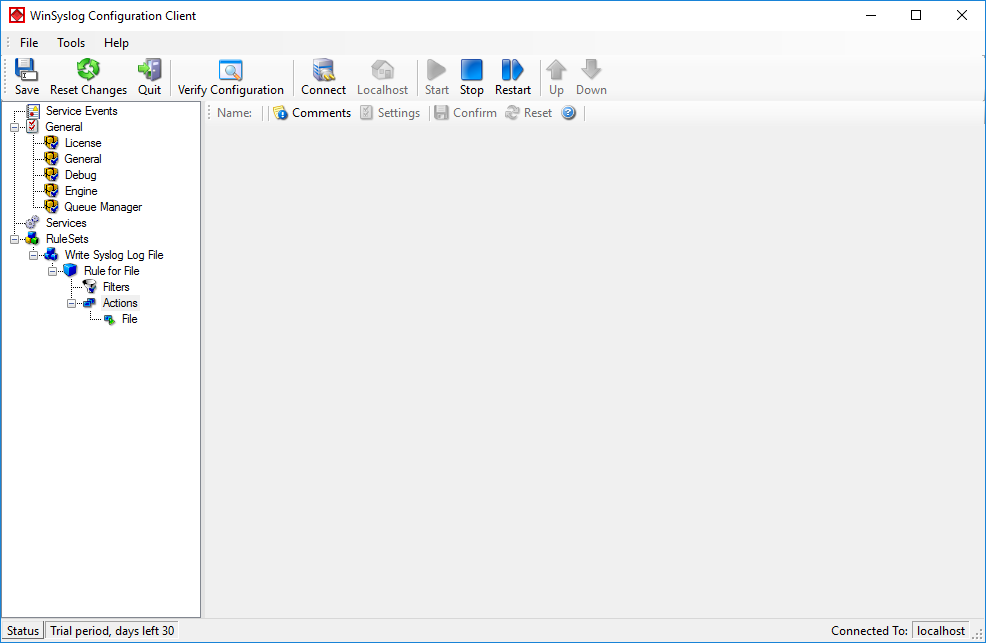
As you can see, we have a “File” action configured. We will review the settings just for your information. Click on “Filters”:
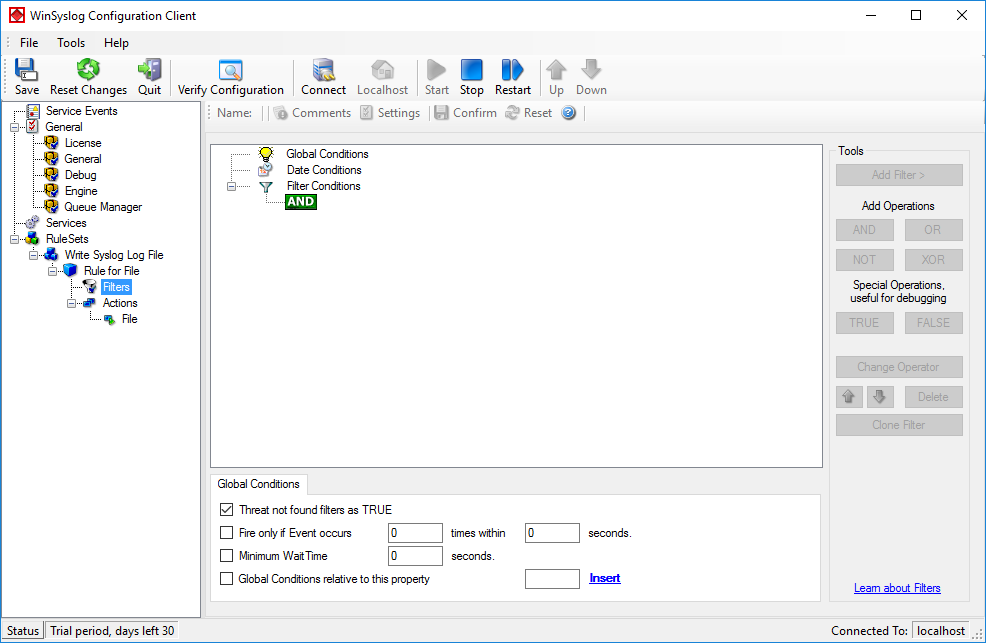
As you can see, none of the filter conditions are enabled. This means that the all information units (incoming messages) will be matched by these filter conditions. As such, the rules for the “File Logging” action will always be carried out for all messages.
Please note that this also means that all Syslog priorities and facilities will be written to the same file.
Now let us check the “File” action itself. Please select it in the tree view:
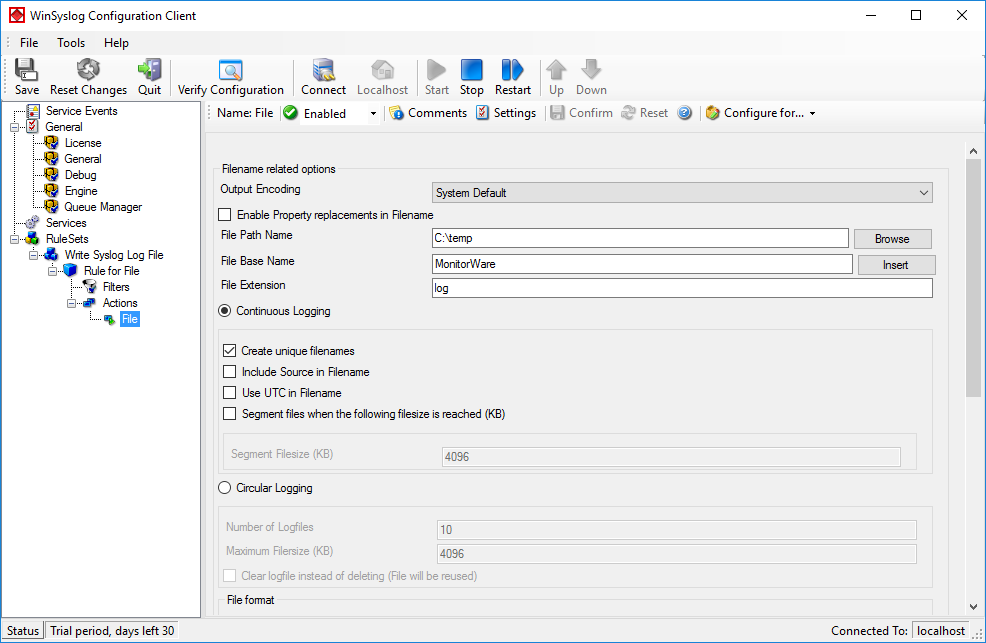
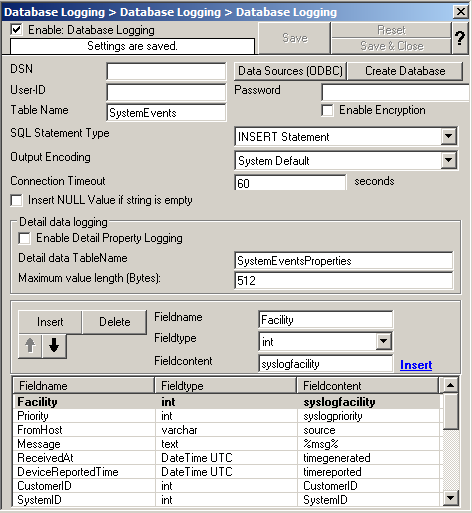
As you can see, it has been created with the default parameters. Each day, a file will be created in the C:\temp directory and its base name will be MonitorWare (meaning the name of the generated file will be MonitorWare-*date*, i.e. “MonitorWare-2016-08-26.log”). It will include all information items in the file (you can select the information items that will be in the file by scrolling down and ticking the boxes).
If you would like to store it into a separate directory or change the file name, here is the place to do it. Important: please make sure the directory you specify exists! If it does not yet exist, please create it before you start the service. If the directory does not exist, the service is not able to store any files.
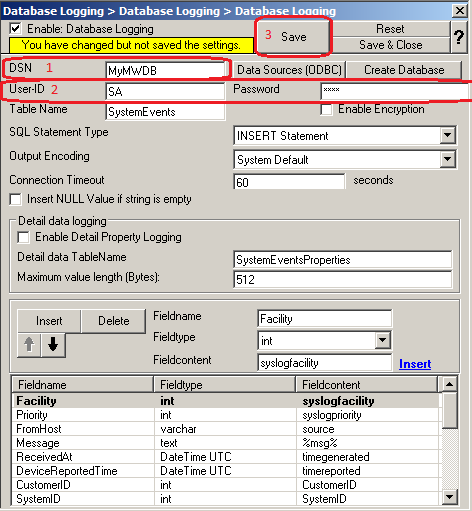
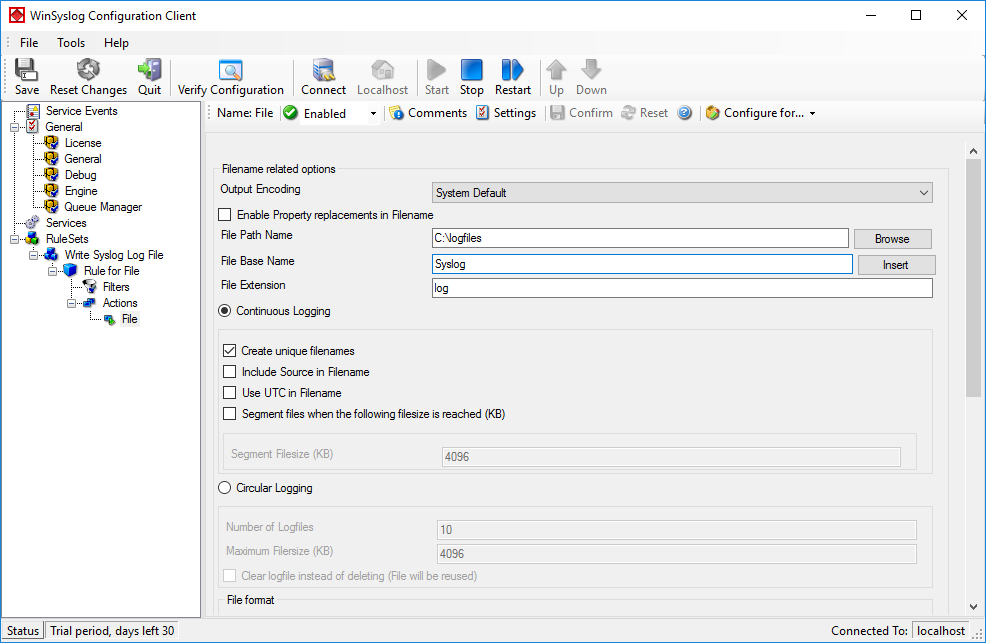
In our example, we would like to save it to “C:\logfiles” with a base name of “Syslog”. Therefore, we change these properties.
After doing so, please remember to save your changes. To do so press “Save” (upper left corner).
Now you have a useable rule set for logging incoming messages to a text file.
Step 2 – Create a Syslog Server Service
Now we need to define a Syslog server service. A Syslog server is also sometimes called a “Syslog daemon”, “Syslogd” or “Syslog listener”. It is the process that receives incoming messages.
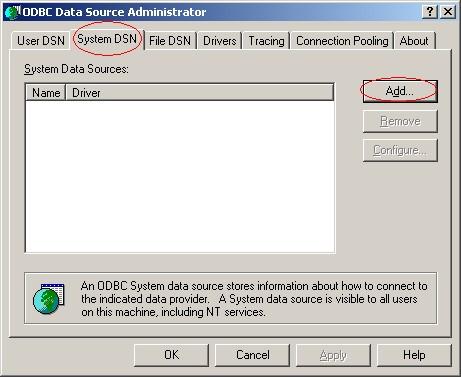
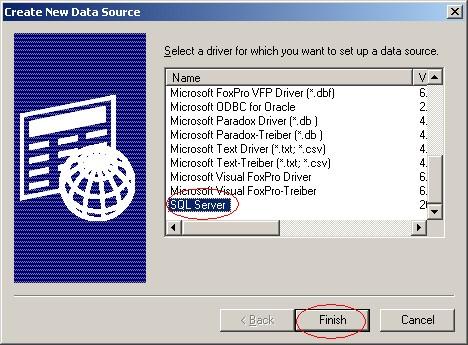
To define it, right click on “Services”, then select “Add Service” and the “Syslog Server”:

Once you have done so, a configuration pane opens.
Also, you will see a newly created service beneath the “Services” part of the tree. View and can rename it if you want (in this example, we will name it “My Syslog Server”). After this, press save.
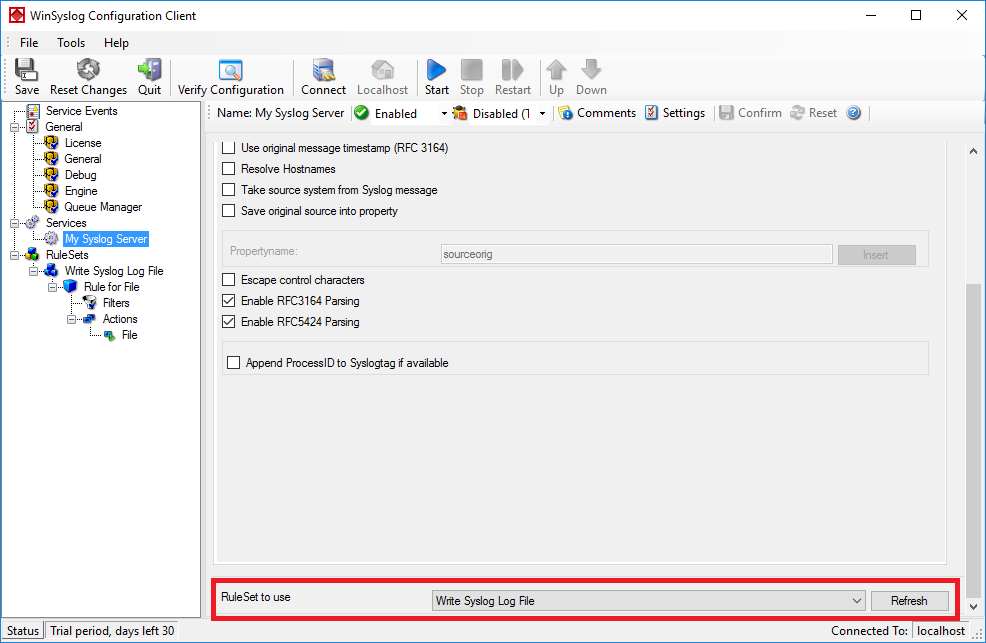
Your screen should now look like this:
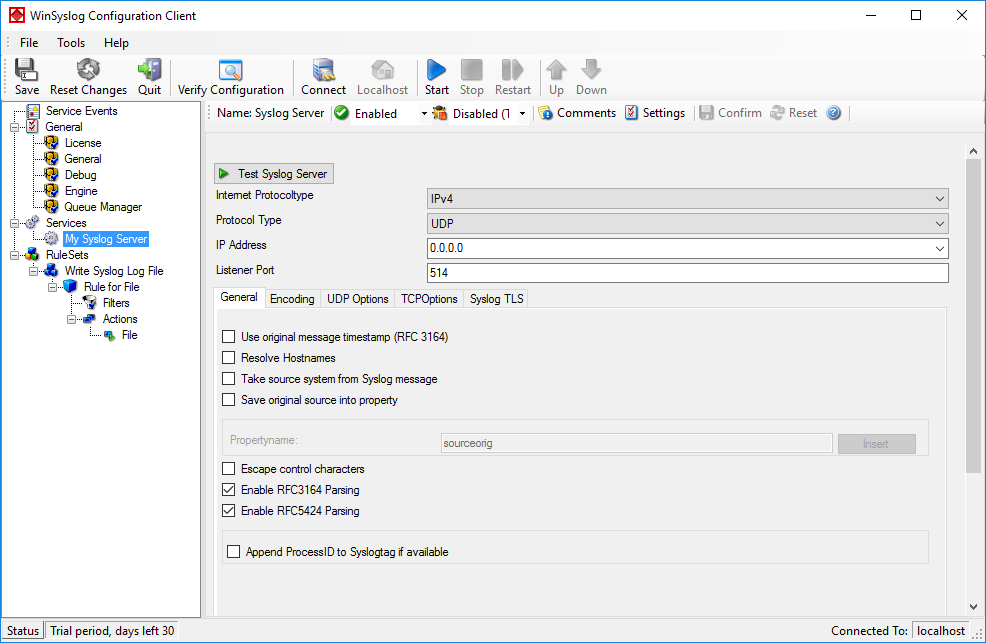
As you can see, the service has been created with the default parameters. As such, it operates as a RFC compliant standard Syslog server.
Please note that the “Write Syslog Log File” has been automatically assigned as the rule set to use. This is the case because we already created it and it is the only rule set. If another one is to be used, you can change it to another ruleset here (you might have to scroll down to view the option):
This procedure completes the configuration of the Syslog server.
Step 3 – (Re-) Start the Service
The application cannot dynamically read changed configurations. As such, it needs to be restarted after such changes. In our example, the service was not yet started, so we simply need to start it. If it’s already running, you need to restart it.
Service control can be done with both the respective operating system capabilities or with the configuration client. These are highlighted in the screenshot below:
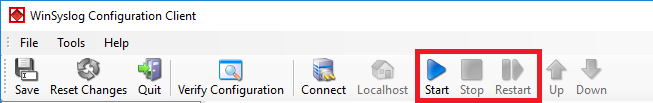
The buttons resemble Windows service manager – start, stop and restart. In this example, stop and restart are grayed out because the service is not running.
After service restart, the new definitions are active and the application is ready to accept and store incoming messages.
Step 4 – Configure your Syslog-Enabled Devices
Even though application is now ready, it can only receive messages if some devices send them. Remember, Syslog is a protocol where the server is passively waiting for incoming messages. As long as no device sends message, the Syslog server will not log anything.
Since there are a large variety of devices, we unfortunately cannot provide device specific instructions. However, almost all devices need to be configured with their specific configuration tool. Typically, only two settings need to be made: one to activate Syslog messages at all and one with the Syslog server IP address or name.
Remember: the computer running application now acts as a Syslog server. As such, you need to find out its IP address or name and supply it to the device as the Syslog server. Please note that not all devices can operate with computer names. Use the IP address, if in doubt.