Step-By-Step Guides
Article created 2003-05-08 by Rainer Gerhards.
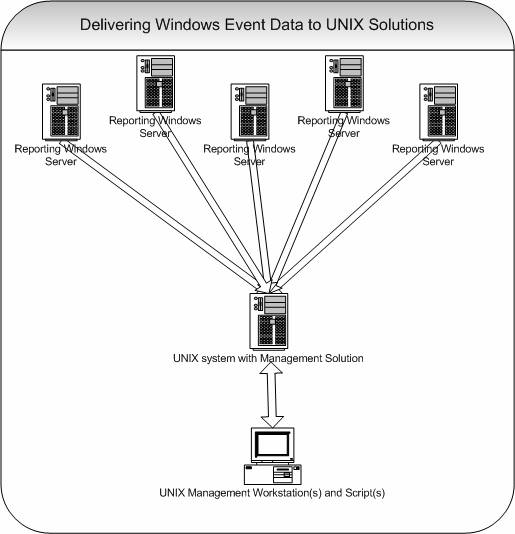
Centralized Event Reports with MoniLog
In this step-by-step guide, MonitorWare Agent is configured to work together with Adiscon’s MoniLog to automatically generate event summaries for the monitored servers and other devices.
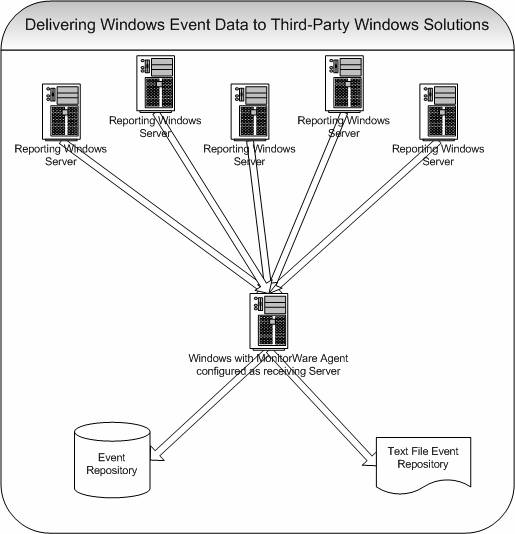
This guide focuses on a typical small to medium business topography with a single geographical location and 5 Windows clients and a central hub server. All systems are well connected via a local Ethernet. Event reports from all machines should be stored in a database. The administrator shall receive daily consolidated event reports.
What you need
In this guide, I am focusing on building a solution with Adiscon’s MonitorWare Agent and MoniLog. This combination allows you to centralize all your event logs and report events from them. Free 30 day trial versions are available at the respective product sites (links below), so you can try the system without the need to buy anything.
You need to run the following products:
- 1 MonitorWare Agent for each system that is to be monitored. In our scenario, this means 6 copies, one for each client and one for the central hub server to be monitored.
- 1 MoniLog to automatically generate consolidated reports based on the gathered log data.
- To deliver MoniLog reports, you need a local web server (for example Microsoft’s IIS or Apache) and a mail server capable of talking SMTP (most modern servers support this)
You need administrative privileges on each of the machines. This is required both for installation and configuration. Make sure you log on with a sufficiently privileged user account.
Our new product called, MonitorWare Console (still in its beta stages) can also be used with MonitorWare Agent. MonitorWare Console is a very strong and comprehensive tool that will help you out in carrying out sophisticated analysis of your system. For more information about MonitorWare Console, please refer to its manual.
Step 1 – Download Software
As you read the MonitorWare Agent manual, you most probably downloaded the MonitorWare Agent. If you haven’t, please visit www.mwagent.com/en/download to do so. In addition to the agent, you need also the MoniLog product. A free, full-featured 30 day trial is available at www.monilog.com/en/download/.
Step 2 – Install MonitorWare Agent
Run the MonitorWare Agent setup program on all systems that should be monitored. This means you need to run it on all 5 clients and the central hub server. Take a note of the central hub server IP address or host name. You’ll need this value when configuring the agents on the client machine. For our example, we assume this system has an IP address of 192.168.0.1.
For larger installations (with many more servers) there are ways to set it up in a simpler fashion, but in a scenario like ours, it is faster to install it on each machine manually. You can install it with the default settings. When setup has finished, the program automatically is configured to operate as a simple syslog server. However, it does not yet create the log in our database we need. So we will go ahead and change this on each of the machines or by launching it on one machine and remotely connecting to the others. It is your choice. In this sample, I use the MonitorWare Agent on each machine (it is easier to follow).
Step 3 – Create a RuleSet for Forward by SETP
The steps to configure the agents are as follows (repeat this on each of the 5 client machines). This step needs not to be done on the central hub server!:
- Start the MonitorWare Agent.
- Select your language – in this example, I use English, so it might be a good idea to choose English even if that is not your preference. You can change it any time later, but using English makes it much easier to follow this guide here.
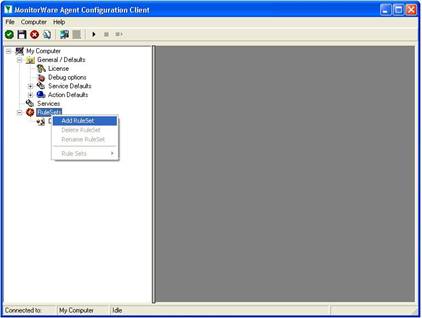
- Then define a new rule set, right click “Rules”. A pop up menu will appear. Select “Add Rule Set” from this menu. On screen, it looks as follows:

- Then, a wizard starts. Change the name of the rule to whatever name you like. We will use “Forward SETP” in this example. The screen looks as follow:
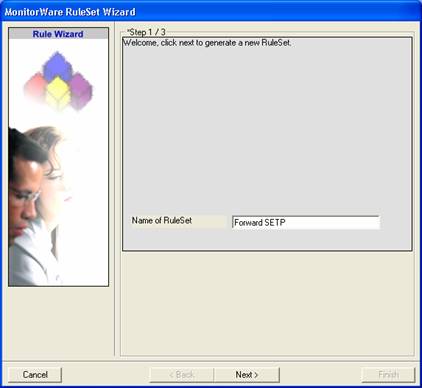 Click “Next”. A new wizard page appears.
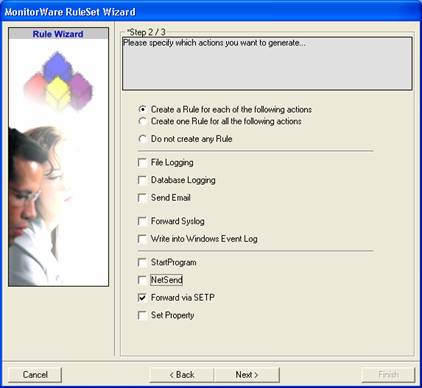
 - Select only Forward by SETP. Do not select any other options for this sample. Also, leave the “Create a Rule for each of the following actions” setting selected. Click “Next”. You will see a confirmation page. Click “Finish” to create the rule set.
- As you can see, the new Rule Set “Forward SETP” is present. Please expand it in the tree view until the action level of the “Forward SETP” Rule and select the “Forward by SETP” action to configure.
- Now, type the IP address or host name of our central hub server in the “Servername” field:
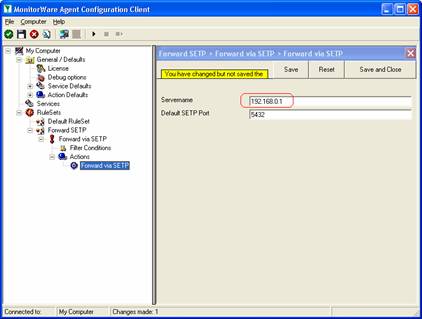
- Make sure you press the “Save” button – otherwise your changes will not be applied.
Step 4 – Create a RuleSet for database logging
This step needs only to be done on the central hub server!
- Start the MonitorWare Agent
- Again, you can select the language to use. And again, I suggest using English, as this makes the guide easier to follow.
- Then define a new rule set, right click “Rules”. A pop up menu will appear. Select “Add Rule Set” from this menu. On screen, it looks as follows:
- Then, a wizard starts. Change the name of the rule to whatever name you like. We will use “Database Logging” in this example. The screen looks as follows:
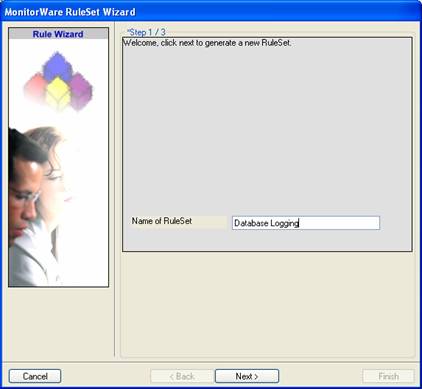 Click “Next”. A new wizard page appears.
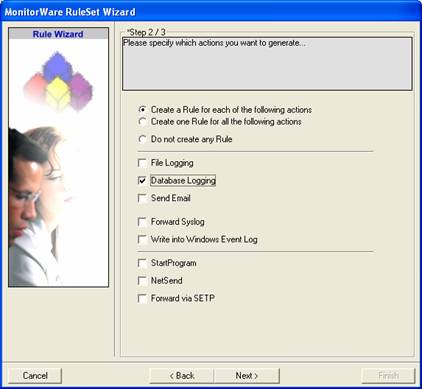
 - Select only Database Logging. Do not select any other options for this sample. Also, leave the “Create a Rule for each of the following actions” setting selected. Click “Next”. You will see a confirmation page. Click “Finish” to create the rule set.
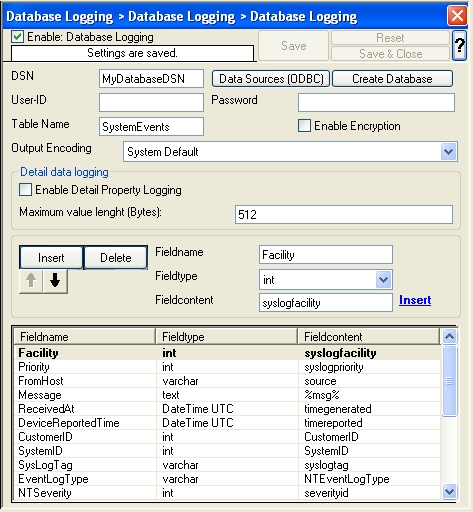
- As you can see, the new Rule Set “Database Logging” is present. Please expand it in the tree view until the action level of the “Database Logging” Rule and select the “Database Logging” action to configure.
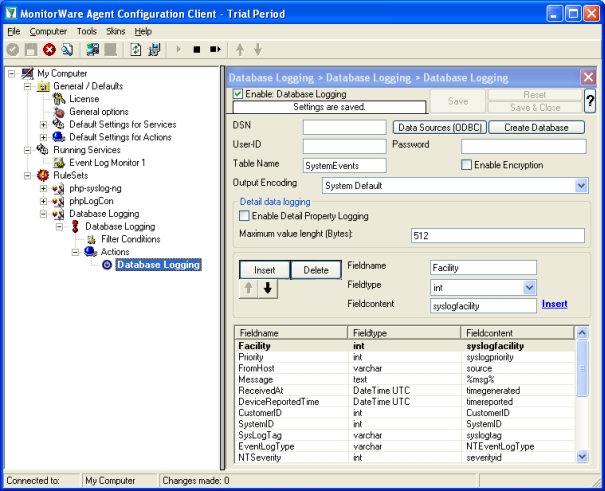
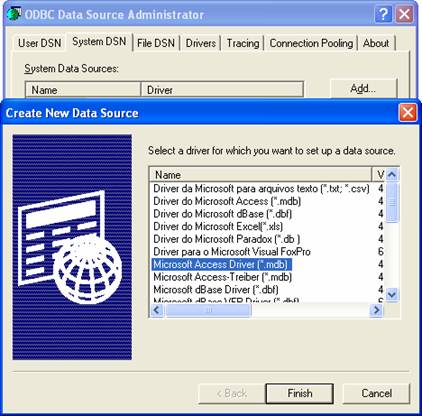
- Now click on the Data Sources (ODBC) button to open the ODBC Data Source Administrator. Then choose the “System DSN” tab an click the “Add” button to add a new System-DSN (Select the Microsoft Access driver like in the screenshot below).
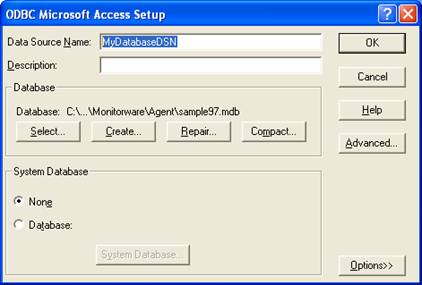
- In the next step, click the “Select” button and go to the MonitorWare Agent installation directory (Usually C:\program files\MonitorWare\Agent\) and choose the sample database called sample97.mdb. After that name the new DSN with “MyDatabaseDSN” like in the following screenshot and press OK.
- Now close the ODBC Data Source Administrator and switch back to the MonitorWare Agent Client and insert “MyDatabaseDSN” in the DSN field. Leave all other settings in their default and save the changes.
Step 5 – Create an Event Log Monitor Service
The steps to configure the MonitorWare Agents are as follows (repeat this step on each of the 5 client machines and the central hub server!):
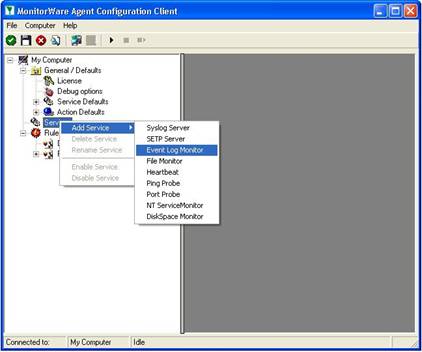
- First, right click on “Services”, then select “Add Service” and the “Event Log Monitor”.
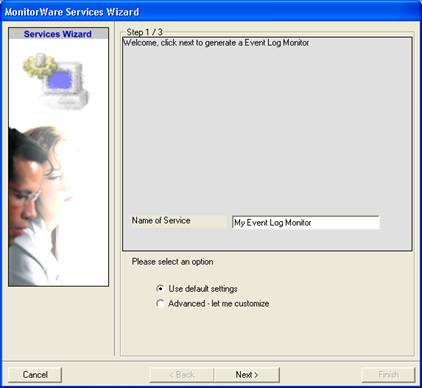
 Once you have done so, a new wizard starts.
 - Again, you con use either the default name or any one you like. We will use “My Event Log Monitor” in this sample. Leave the “Use default settings” selected and press “Next”.
- As we have used the default, the wizard will immediately proceed with step 3, the confirmation page. Press “Finish” to create the service. The wizard completes and returns to the configuration client.
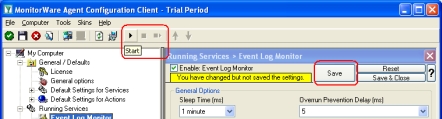
- Now, you will see the newly created service beneath the “Services” part of the tree view. To check its parameters, select it:
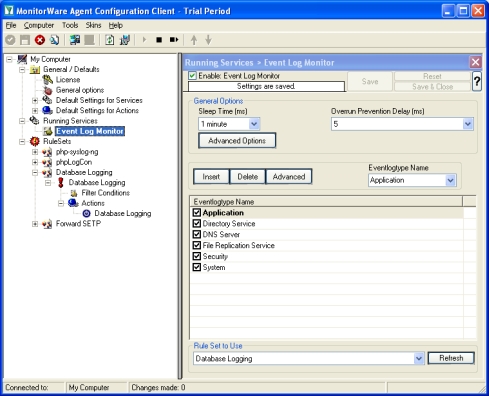 As you can see, the service has been created with the default parameters.Please note that the “Default RuleSet” has been automatically assigned as the rule set to use. By default, the wizard will always assign the first rule set visible in the tree view to new services. In our case, this is not correct and will be corrected soon.
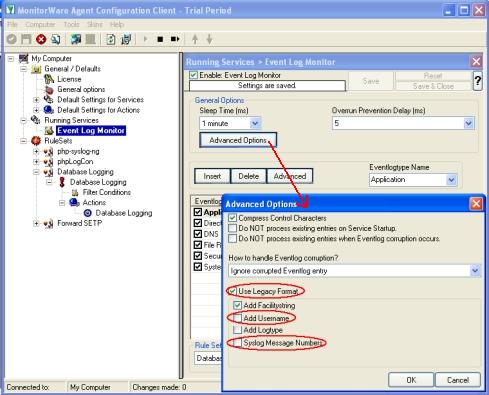
 - Check “UseLegacyFormat”. Next is to uncheck “Syslog Message Number” and uncheck “Add Username”.
- Now you must differentiate between clients and central hub server. In clients use the “Forward ” RuleSet we have created in Step 2, select it as rule set to use. In central hub server select the “Database Logging” RuleSet we have created in Step 3. Leave all other settings in their default.Clients:
 Central hub server:
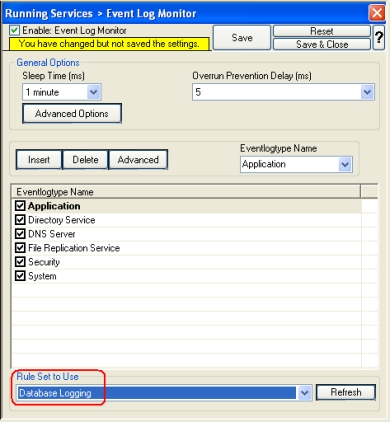
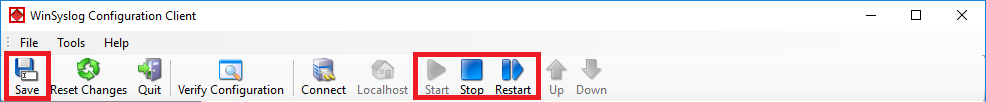
- Finally, save the changes and start MonitorWare Agent. This procedure completes the configuration of the syslog server.
 MonitorWare Agent cannot dynamically read changed configurations. As such, it needs to be restarted after such changes. In our sample, the service was not yet started, so we simply need to start it. If it already runs, you need to restart it.
With step 5 the client machines configuration has finished. All the next steps are only concerned with the central hub server.
Step 6 – Create a SETP Server Service
The steps to configure the agents are as follows (only central hub server!):
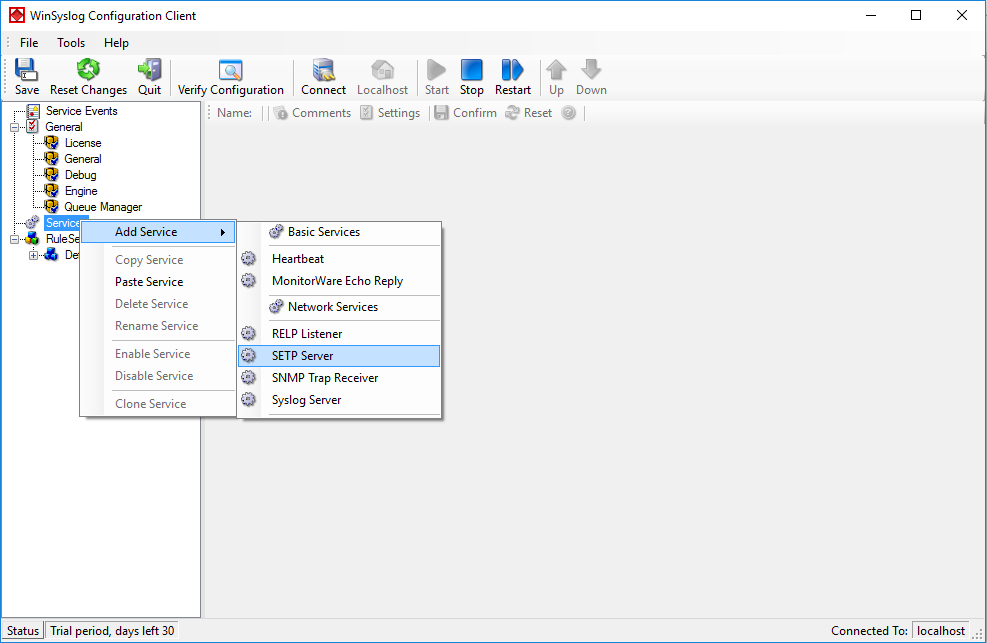
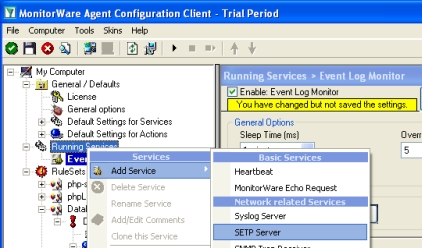
- First, right click on “Services”, then select “Add Service” and the “SETP Server”.
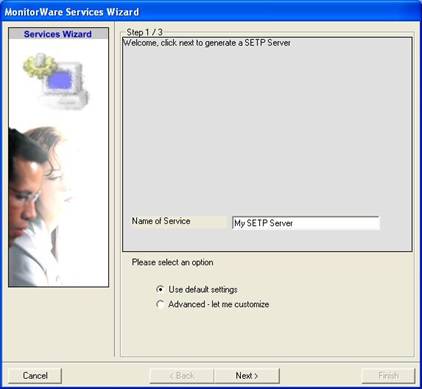
 Once you have done so, a new wizard starts.
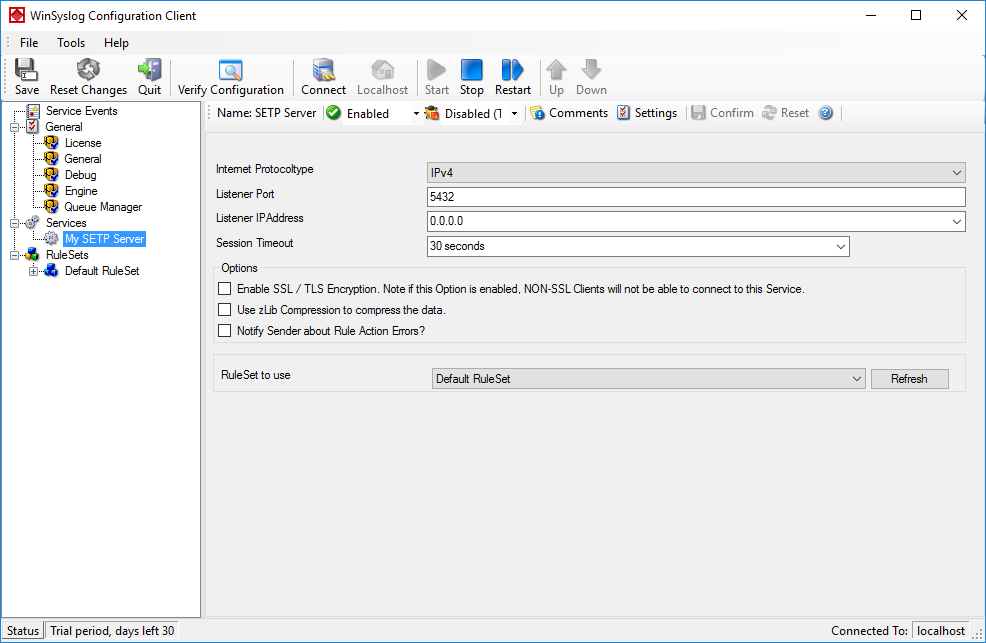
 - Again, you con use either the default name or any one you like. We will use “My SETP Server” in this sample. Leave the “Use default settings” selected and press “Next”.
- As we have used the default, the wizard will immediately proceed with step 3, the confirmation page. Press “Finish” to create the service. The wizard completes and returns to the configuration client.
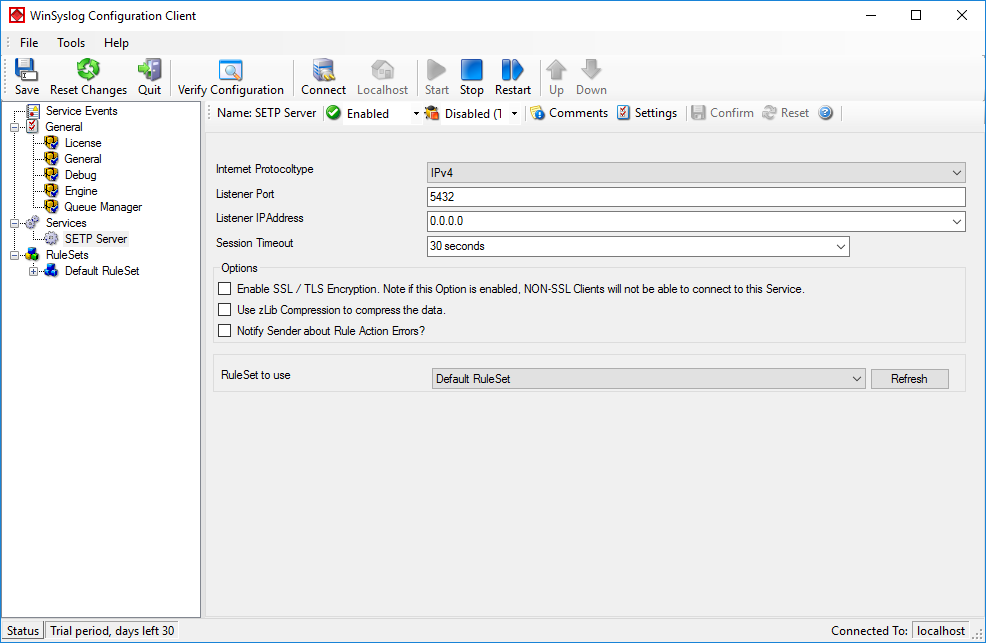
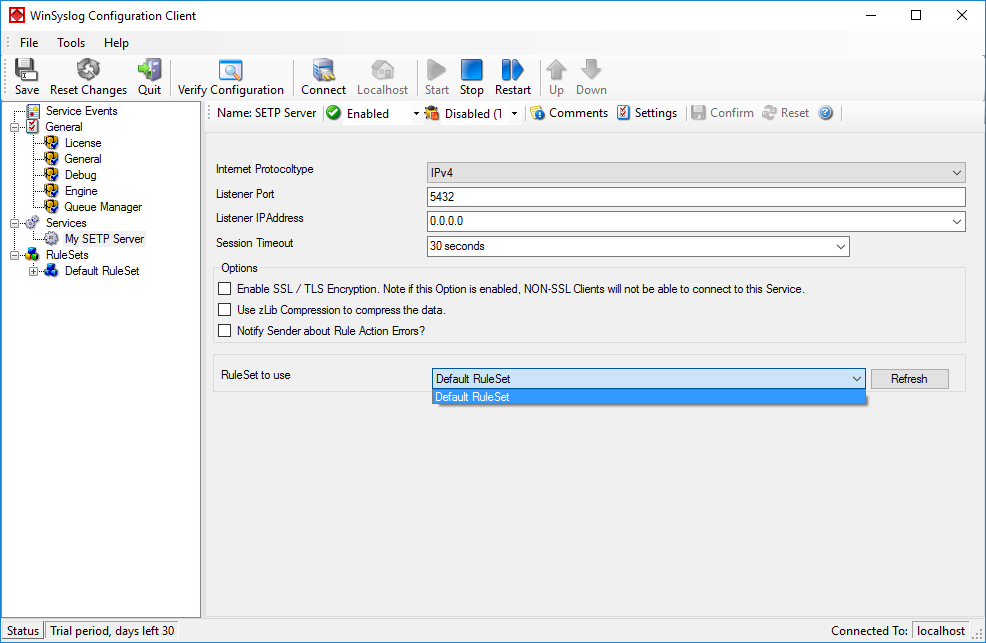
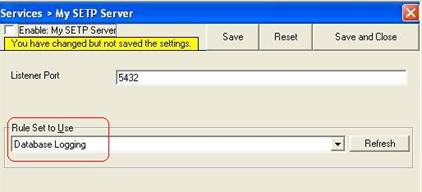
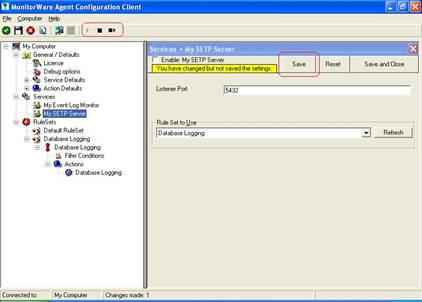
- Now, you will see the newly created service beneath the “Services” part of the tree view. To check its parameters, select it:
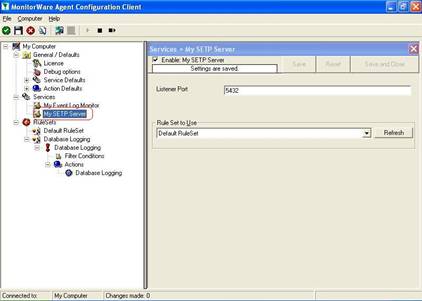 As you can see, the service has been created with the default parameters.
 - To use the “Database Logging” RuleSet we have created in Step 4, select it as rule set to use.
- Lastly, save the change and than restart MonitorWare Agent. This procedure completes the configuration of the syslog server.
 MonitorWare Agent cannot dynamically read changed configurations. As such, it needs to be restarted after such changes.
Step 7 – Preparing Web Server for MoniLog
MoniLog publishes its reports through the local web server (central hub server).
To avoid confusion, we recommend creating a separate directory on the web server for MoniLog. Let us assume you use Microsoft Internet Information Server and run it in the default configuration. Then, you web pages are stored in the c:\inetpub\wwwroot directory. Create a subdirectory “monilog” directly beneath this directory.
Step 8 – Installing and Configuring MoniLog
Log on interactively to the web server. Then, run the MoniLog setup with default parameters. When setup has finished, perform the following steps:
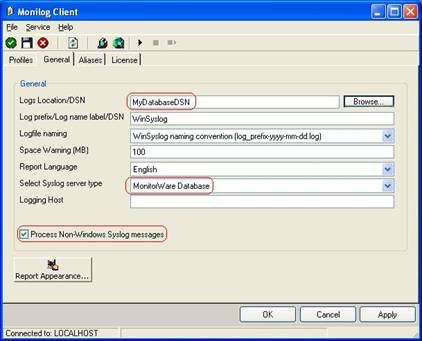
- First, switch to the “general” tab.
- “Logs Location” expects the DSN from the database in our scenario. Type in “MyDatabaseDSN”.
- Select MonitorWare Database in “Select Syslog server type”.
- Next is to check the “Process Non-Windows Syslog messages” box. Leave all other options by default. Now it should look as follow:
 Click “Apply” after making your changes!
 - This has already enabled MoniLog reporting. Now, we can verify the installation. To do so, switch back to the “Profiles” tab. Click the “New Profile” button and enter a name. In this example I use the name “Profile1”.
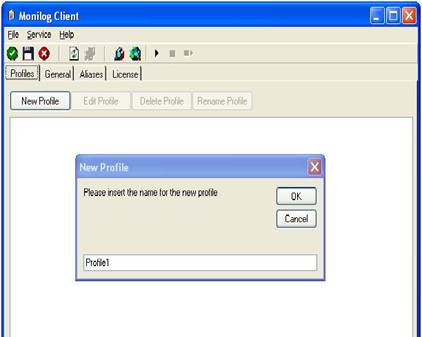 Click the “OK” button to create a new profile.
 - Under “Reports Location”, enter the directory where MoniLog reports should be stored. In our sample, we use “c:\inetpub\wwwroot\monilog”. Leave all other settings as default. The tab should look like this one:
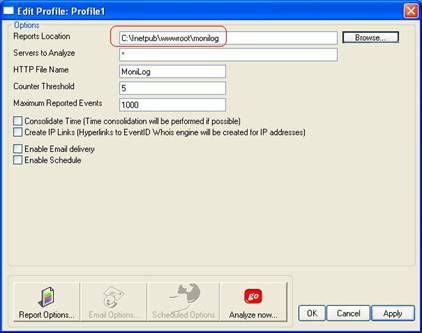 Click “Apply” to save your changes!
 - Next step is to set your report options. To do so, click “Report Options”. A new window opens. Check Success Audit and Information. Now it should looks like this one:
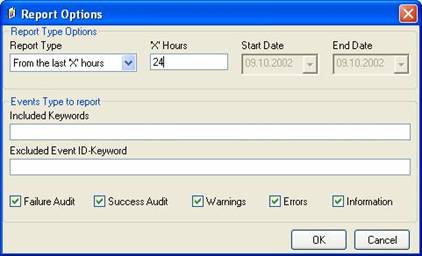 Click on “OK” to close the windows by using default options.
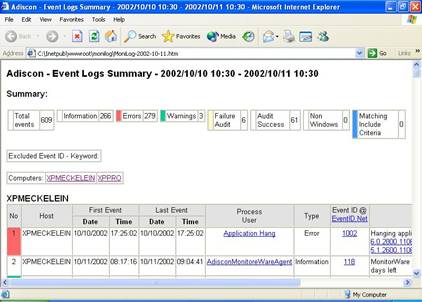
 - Click “Analyze now” to test it. After a short while, a browser window with a MoniLog report will appear. The actual content of this report varies greatly. It depends on which events have been forwarded while setting up the agents. Probably, your report will be empty. This simply indicates that there was not yet any data to be analyzed. Immediately after setup, this is OK. If you don’t receive any data after some hours then of course there is something wrong. If that is the case, check the steps done before. A typical report looks like follows:
- Now we have verified the system is working. Next, we can schedule the automatic report. To do so, we need to check “Enable Schedule” and also “Enable Email delivery”. A quick reminder: we would like to receive a pointer to the report via email each working day. We first need to set the web directory the reports are to be stored to and enable email delivery. It is all done in the following screenshot:
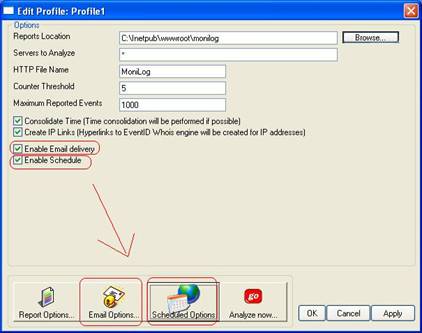 The “Email Options” and “Scheduled Options” become colored and are now available.
 - Now we need to configure the email options. Click “Email Options…”. We assume the web server (192.168.0.1) is also acting as a mail server. The emails should be sent to “admins@sample.adiscon.com”. With that, the dialog looks like follows:
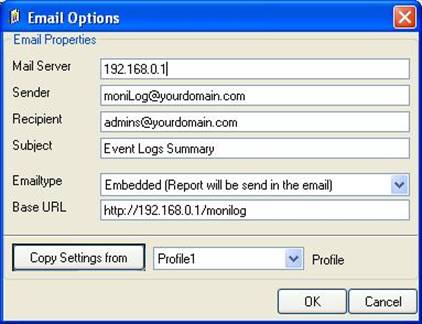 Important: make sure the values match your configuration! This is vitally important because otherwise MoniLog is incapable of sending email correctly. Click “OK” to apply the new settings.
 - Next, click the “Report Options…” button. As we schedule reports only on working days, we need to tell MoniLog that it should include all those events occurred since its last run into the reports. We cannot leave the default of 24 hours, as this would exclude the weekend’s events. So change the “Report Type” option to “From last run till now” as seen below.
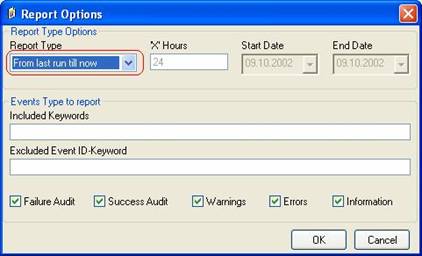 Click “OK” to apply the setting.
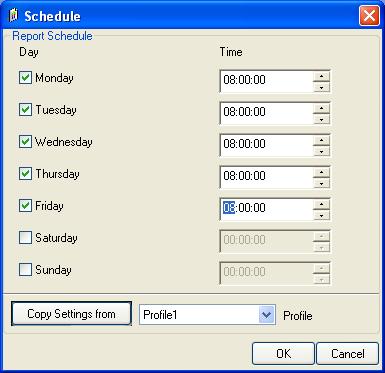
 - Lastly, click on “Schedule Options” to set a schedule. As long as no schedule is set, no reports will be generated automatically. In our sample, we let MoniLog generate reports each working day at 8:00 in the morning. Weekends are not enabled. The dialog looks like this:
- Click on “OK” to apply the settings. Typically, the following window occurs:
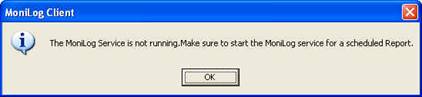 This tells you that the MoniLog service has not yet been started. The service generates the scheduled reports (so you don’t need to run the client in foreground). For now click “OK”. We’ll start the service in the next step. Please note that we now have fully configured reporting, but it will not occur because the service is not yet running.
 - To conclude your configuration of MoniLog, start the service. To do so, select “Service”, then “Start Service” from the menu. This will start the service. During setup, the service is set to start automatically with system startup. So there is no need to manually restart the service after a reboot.
MoniLog is now completely configured. You will not immediately receive reports, because they will only be generated at 8am each working day. So you need to wait for the next morning. If you would like to change the schedule to have an immediate feedback, please go to “Schedule” and change the time to be a few minutes in the future. Then click “OK” and restart the service. This can be done via the “Service” menu. A restart is necessary because the service reads changed parameters at startup, only.
You are done!
Well, this is all you need to do to configure the basic operations. Once you are comfortable with the basic setup, you can enhance the system with local pre-filtering of event, enhanced logging and alerting (with MonitorWare Agent) and changing report options (with MoniLog).