How to audit File / Directory delete Operations on a Windows System using security auditing.
Article created 2007-12-12 by Andre Lorbach.
This article will guide you in how to setup Windows and MonitorWare Agent to track file and directory deletion processes. It is also possible to use EventReporter instead of MonitorWare Agent, however this article will target the more powerful MonitorWare Agent. The guide works both on Workstation and Server versions of Windows.
- You can download a preconfigured configuration from here, which you can import on your target system. The configuration sample will have comments for better understanding. The MonitorWare Agent Client can import the XML/REG configuration file by using the “Computer Menu”.
A typical scenario of a small to middle sized company. The employees access a file server and store their documents on it. Suddenly an important document is missing. Who deleted it? And more important when was the file deleted? Oh two months ago? To bad our backups don’t go that far, the document is gone forever … ! Wouldn’t it be great to know if a file is deleted, when it was deleted and also who did delete the file? Maybe it was the revenge of an employee who got fired a few weeks ago?
Using Windows Security Auditing and the EventLog Monitor of MonitorWare Agent, you can set up an environment where you exactly know if a file is deleted, when it is deleted and by whom it is deleted.
Table of Contents
1. Windows Settings
1.1 Turn on Security Auditing
1.2 Add Auditing to the folders / drives you want to monitor
1.3 Configure Windows Security EventLog Size
1.4 Testing File Deletion
2. Configuring MonitorWare Agent
2.1 Download and Install MonitorWare Agent
2.2 Setup Basics in MonitorWare Agent
2.3 Use File Logging to store File Deletion
2.4 Create an Email alert
1. Windows Settings
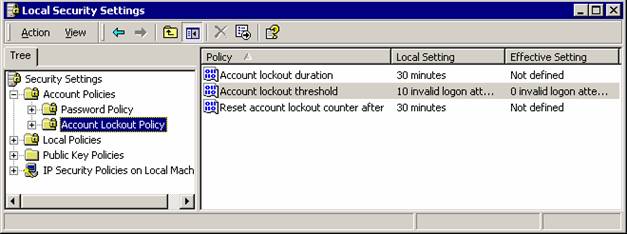
1.1 Turn on Security Auditing
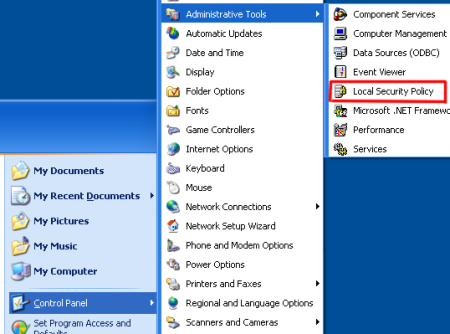 Our first step is to enable “Audit Object access” in the Audit Policy. If your machine is a Workstation like Windows XP / Vista, open the “Local Security Settings” from the “Control Panel->Administrative Tools”. If you want to enable security auditing for the whole domain, or only domain controllers, open the “Domain Security Policy” or “Domain Controller Security Policy” from the “Administrative Tools”. In this article, we will use the “Local Security Settings” on a Windows XP machine. |
| Back to Top |
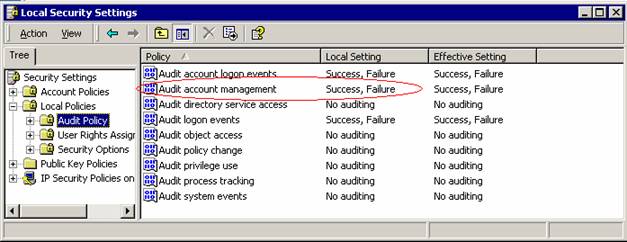
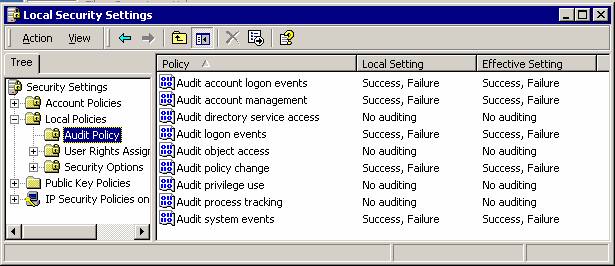
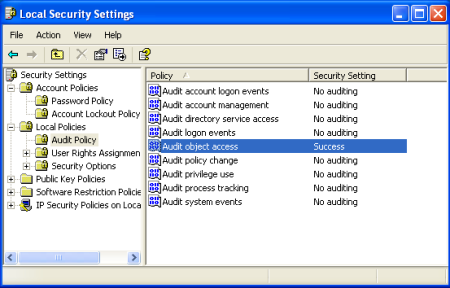 Enable the “Audit object access” policy here. This will also enable object logging we do not need, but the filters in MonitorWare Agent will deal with these events later. |
1.2 Add Auditing to the folders / drives you want to monitor
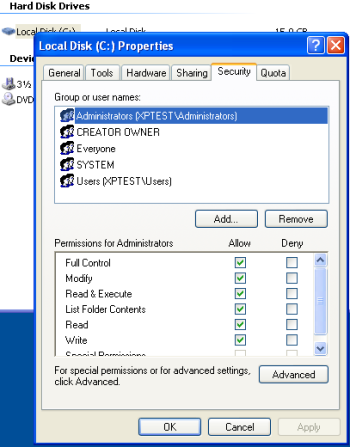 Now we can configure the Security properties for the drives or directories we want to monitor for file / directory deletions. In order to do so, right click the object you want to monitor and click on properties. In our sample, we will use the whole drive C:\. Once you switched to the security tab, click on the “advanced” button. |
| Back to Top |
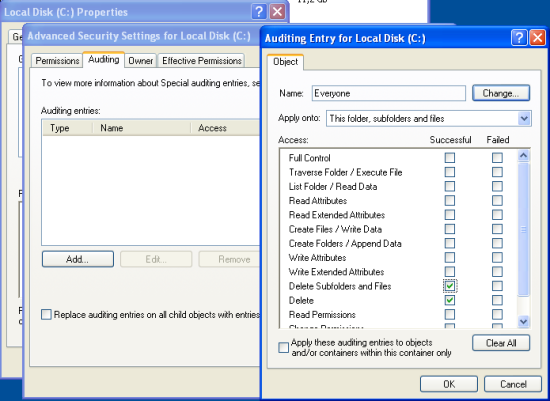 This will open advanced configuration options, switch to the “Auditing” tab and click on the “Add” button. Select “Successful” for the “Delete” and “Delete Subfolder and Files“, and also for “Failed” if you want to monitor failed deletion attempts as well. Once you have done this and confirm your changes by clicking on “Apply“, it may take a while until the system begins to record audit records. Good time to get a cup of coffee. If you want to monitor other file operations, go ahead and activate them. However you will need to enhance the filter rules for MonitorWare Agent later by yourself. |
1.3 Configure Windows Security Event Log Size
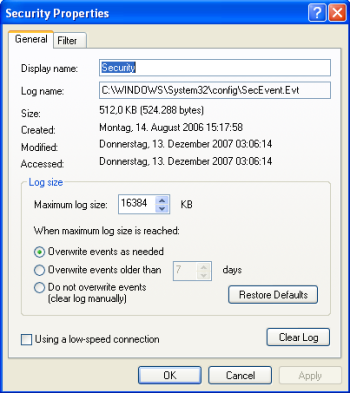 The System defaults are different from Windows to Windows Version. We need to make sure that event logging is continuous, otherwise the event log will fill up at some time, and no events can be written into it anymore. In our example, we will use 16MB of Maximum log size (Can be up to 256MB) and “Overwrite events as needed“. |
1.4 Testing File Deletion
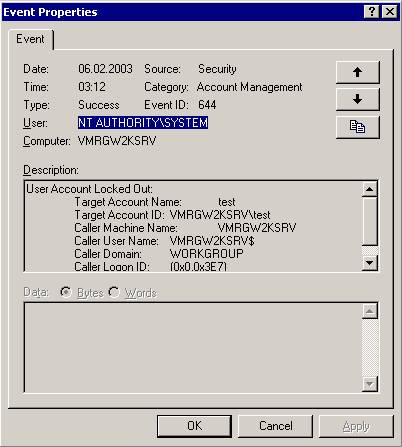
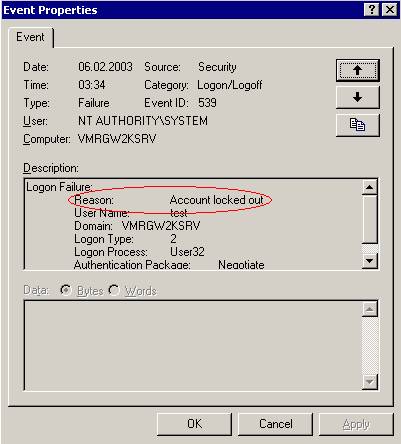
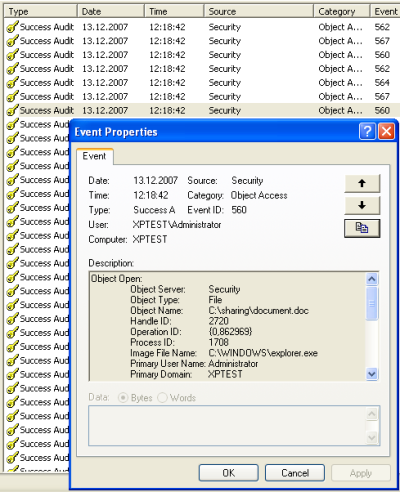 For this sample, we created a folder called “sharing” on the drive C:\ and shared it as a network folder. Then we added a file called document.doc into this folder, and deleted it. All done over the network share. Then we open the Computer Management Console, and take a look into the Windows Security EventLog. You will see that a bunch of events is being generated for each file we delete. The Event which is interesting for us is the first Event with ID 560. We will filter this event by certain parameters later using MonitorWare Agent. This event contains all information’s we need to determine which file was deleted, when it was deleted and by whom. |
2. Configuring MonitorWare Agent
2.1 Download and Install MonitorWare Agent
| So if you haven’t done so already, go to www.mwagent.com and download the latest MonitorWare Agent Version. It is always recommended to use the latest Version of MonitorWare Agent. Once the Download is done, go ahead and install it. You may have to restart after installation, this depends on your System. |
2.2 Setup Basics in MonitorWare Agent
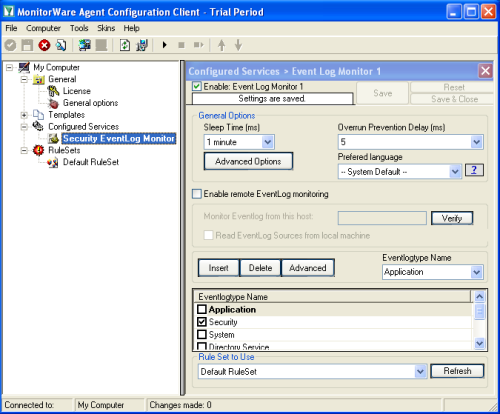 Start the MonitorWare Agent Client and skip the wizard on startup. First we create new “Event Log Monitor” Service. Uncheck all event log types and only select “Security“, as this is the only event log needed to achieve our goal. Then save the settings. |
| Back to Top |
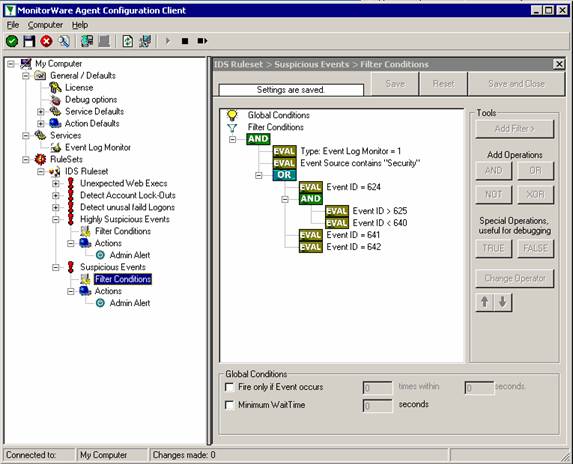
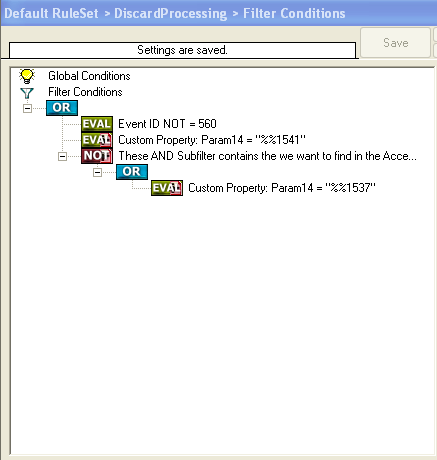 Now we need to create some basic rules and filter to preprocess the event log entries. The first rule we create is called “DiscardProcessing” and will discard events if certain filters match. We only want to process Events with ID 560. Then there is the Param14 property which will contain “Accesses” masks from the event entry. The event log message will show DELETE, Read_Control and so on, but the parameters actually are RAW which means we have to deal with numbers. Here is the list for the most common access mask numbers and their meaning: While examining the event log I noticed that there are multiple Events generated with ID 560 for each file deletion. The first is also generated if you rename a file and contains the mask “SYNCHRONIZE”. We do not want to process these events, so we add a filter to avoid these. The third filter we add will contain the Access Mask we want to process, in our example here this will be “%%1537” which is DELETE. Do not forget to add a “Discard” action into this rule. |
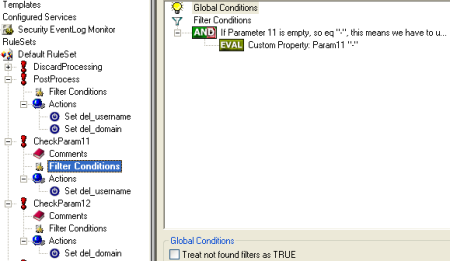 A few more rules are needed in order to post process the username and domain of the user who deleted the file. If a user deletes a file on the local system, Param8 and Param9 will hold the username and domain which we need to log. If a user deletes a file on a remote system, Param11 and Param12 is important to us. So the first rule and its actions will initialize the properties del_username and del_domain with Param8 and Param9. Please import the configuration sample to see the actions in detail. The other two rules will be used to check if Param11 and Param 12 are empty, so not set with a useful value. If they contain any useful information, we will overwrite the del_username / del_domain property with these Params. Using this method, we can be sure to always know exactly who deleted the file. |
2.3 Use File Logging to store File Deletion
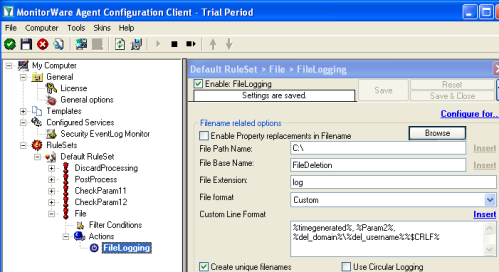 The most common way to store logged operations like this is to use write a logfile. So lets create a new “Write to file” Action. Set a file path and base name of your choice, and switch the file format to “Custom”. As you can see, you can now define your own line format. In our example, I have chosen a rather simple file format, where the values are separated by comma. So you might load them into Excel later, or another other application which can load csv files. Use the following custom line format: So you will see the time the file was deleted, the deleted file (which is %Param2%) and the username and domain name. Feel free to customize the line format to your needs. |
2.4 Create an Email alert
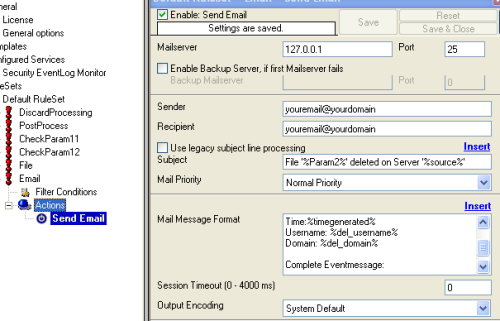 You might want to be alerted by email. But be warned, I recommend to reduce the folders and location you monitor for file deletions. Otherwise you will receive many unwanted emails. It is also possible to add custom filters to avoid emails for certain paths and filenames. Kindly filter the %Param2% property in this case. In order to receive email alerts, create a new rule and add a new “Forward via Email” action. Use the following subject format: Use the following message format: |
Final Thoughts
I hope this article will help you solving your tasks or shows you the potential of MonitorWare Agent, and what you can archive with it. Feel free to email me for recommendations or questions. Of course, the outlined actions are only samples and you may do other things with them, for example store log records to a database table instead of storing them to file.
On the recycle bin: if a local file is deleted via Windows explorer, it is by default moved to the recycle bin and not actually deleted. However, the above mentioned events are still generated. This may be especially useful if you monitor e.g. a very important file via an email alert. There may be chances to undelete it even from the recycle bin.