How To setup PIX centralized Monitoring with MonitorWare Console 3.x

How To setup PIX centralized Monitoring with MonitorWare Console 3.x

Article created 2005-05-17 by Hamid Ali Raja
Last Updated 2011-05-24 by Tom Bergfeld

Adiscon Products can be used to efficiently analyze PIX traffic as well. This article is strictly task focused. It does not describe why the systems should be monitored nor does it provide any further background. Please see the respective backgrounders or product documentation on this. This article is a step-by-step description of what you need to do in order to centrally monitor your PIX logs.

Centralized PIX Reports

In this step-by-step guide, WinSyslog is configured to work together with Adiscon’s MonitorWare Console to generate summaries for the traffic passing to and from PIX.

What you need

In this guide, I am focusing on building a solution with Adiscon’s WinSyslog and MonitorWare Console. This guide will be equally good for you if you want to configure MonitorWare Console with WinSyslog or to configure MonitorWare Console with MonitorWare Agent. The reason is that in this configuration a syslog server that will be listening for syslog messages is required. Since MonitorWare Agent and WinSyslog can act as syslog server, this guide can be used for both. The configuration steps are exactly the same in both cases.

This combination allows you to centralize all your logs and generate reports on them. Free 30 day trial versions are available at the respective product sites (links below), so you can try the system without the need to buy anything.

You need to run the following products:

  • 1 WinSyslog for the system that will act as the syslog server.
  • 1 MonitorWare Console to generate consolidated reports based on the gathered log data. This will also be installed on the same machine where you have installed WinSyslog.
  • You need administrative privileges on each of the machines. This is required in both cases, for installation and configuration. Make sure you log on with a sufficiently privileged user account.

    Step 1 – Download Software

    You need to download the following software to follow this step by step guide:

    1. www.winsyslog.com/en/download
    2. www.mwconsole.com/en/download

    Step 2 – Install WinSyslog

    Run the WinSyslog program on the system that is to act as the central server. Take a note of this server’s IP address or host name. You’ll need this value when configuring PIX to forward the messages to it.

    Step 3 – Configure a Syslog Server

    The steps to configure the WinSyslog as a syslog server are as follows:

    Configuring a Syslog Server

    Step 4 – Create a RuleSet for Database Logging

    In this section, you will create an action to write the messages that are coming from PIX to a database. Please note that these steps would be exactly the same for both MonitorWare Agent and WinSyslog.

    Database Logging Steps

    After configuring this RuleSet, make sure that

    • this rule set is associated with the syslog server service that you created in step 3. You can do this by clicking on the syslog server service on the left hand side and by selecting the name of the rule set that you created in step 4 in “Rule Set to Use” combo box on the right hand side.
    • The service is running. You can do this by clicking on the Play button at the top of the client.

    Step 5 – Configure PIX

    In this step, you will need to configure PIX in such a way so that it sends the messages to the syslog server that you created in the above step. You would need to give the IP address or the hostname in PIX.

    PIX Configuration Steps

    Step 6 – Installing and Configuring MonitorWare Console

    MWConsole- Installation and Configuration Steps

    Step 7 – Generating PIX Reports with MonitorWare Console Manually

    Following are the reports in MonitorWare Console that can be generated for PIX logs.

    • Accessed Web Sites Report
    • Blocked Ports Activity Report
    • Possible Attacks Report
    • PIX Summary By Message Type
    • PIX Summary by Severity Level
    • Traffic By Hour Report
    • Traffic By Port Report
    • Outbound Traffic By IP
    • Traffic by Target IP

    This section explains how the PIX reports can be generated with MonitorWare Console manually. In this section I will explain the generation of a specific report only. Please note that, the procedure for generating any report is almost the same.
    Generating PIX Reports with Console 3.0 Manually

    Step 8 – Scheduling the Generation of Reports with MonitorWare Console

    This section explains how the reports can be generated with MonitorWare Console automatically using Job Manager. With Job Manager, you can generate all the reports based on a pre-defined schedule and ask it to either store it in some location on the hard disk or send it to specified recipient via email. The following section explains the scheduling of System Status Report. You can use exactly the same method to generate any of the PIX reports that are mentioned above.

    Scheduling Reports with Console 3.0

    You are done!

    Well, this is all you need to do to configure the basic operations. We hope this article is helpful. If you have any questions or remarks, please do not hesitate to contact us at support@adiscon.com
How To setup MonitorWare Console 2.0

How To setup MonitorWare Console 2.0

Article created 2004-04-22 by
Tamsila-Q-Siddique
.

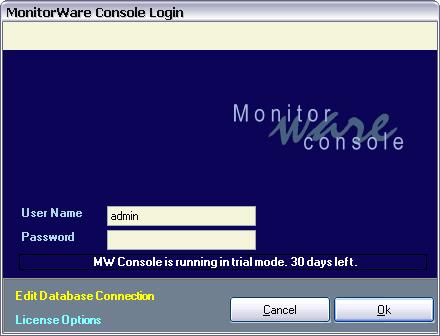
After installation, once MonitorWare Console 2.0 is started, a dialog box similar to the one shown below would be displayed.


Figure 1: MonitorWare Console: Startup Dialog Box

The default user name is “admin” and password is nothing (as shown above).
Please note that the password is not the word “nothing” but actually it is
empty. Once a user enters into the application, this password can be changed.

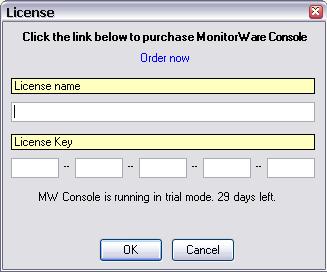
At the bottom left corner of this dialog box, there are two links “Edit
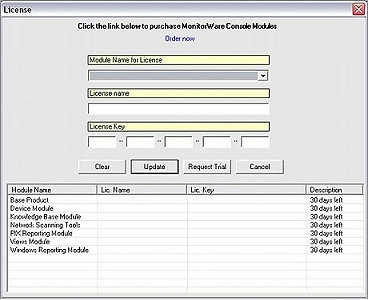
Settings” and “License Options” The latter one is self-explanatory. If you
click on it, a license dialog appears where you can view or change your license
key and license name. There is also a link to order the product directly via
our online ordering system. Please note that MonitorWare Console has Modular
Licensing now. For getting more details on License, please see
License Options
.


Figure 2: License options Dialogue Box

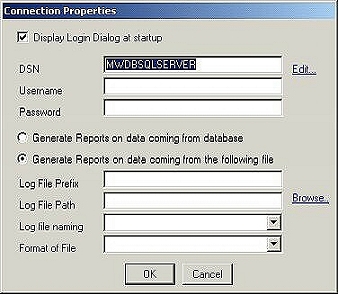
The other link in the login dialog, “Edit Settings” is used if the user wants to
change the database connection or other settings. Currently MonitorWare Console
supports Microsoft Access, SQL Server and MySQL. Once the above mentioned link
is clicked, a dialog box, as shown in figure, will pop up. Using this dialog
box, the user can change the underlying database or other settings.


Figure 3: Dialog Box to change the underlying database or log file

Display Login Dialog at Startup

If checked the dialog box in figure 2 appears every time at the startup of the
MonitorWare Console application. If unchecked it will directly take you into
the Monitorware Console main application without displaying Figure 1.

DSN

This field is mandatory. This will point to the DSN of the database which will
store all the settings related to the MontitorWare Console . And later on this
will work as the underlying database to which MonitorWare Console is connected.

Edit

This options opens up a dialog box for creating the DSN. A dialog similar to
the one displayed opens where you can configure the settings according to your
environment.


Figure 4: Dialog Box to create a DSN

Once the provider and the connection has been selected, Test Connection button
can test whether the connection with the specified database has been
established or not.

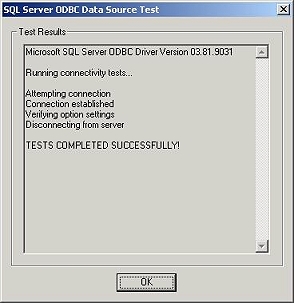
If the dialog box, as shown in figure 5, is displayed, it means that the
connection with the specified database has been set up properly and the user
can proceed further by pressing the OK button.


Figure 5: Success dialog

On the other hand, if a dialog box, as shown in figure 6 is displayed, it means
that there is something wrong and the connection with the mentioned database
has not been established.


Figure 6: Connection Failure Dialog Box

User Name

This option allows you to configure the User Name for connecting to the
database.

Password

This option allows you to configure the Password for connecting to the
database.

Note: If you had created the DSN with the “Windows Integerated Security”, then
you don’t need to give any user name or password.

Generate Reports on data coming from database

If this option is checked then in Windows Reporting Module and Pix Reporting
Module the reports would be generated on the basis of the underlying database.
We have provided this option so that if your main data on which you want to
generate reports is present in some other database, then you can give its DSN
over here.

Generate Reports on data coming from the following file

If this option is checked then in Windows Reporting Module and Pix Reporting
Module the reports would be generated on the basis of the configured log files
and not on any database

Log File Prefix

This option allows you to enter the prefix of the log files that have been
generated by our other products. MonitorWare Console will go in the specified
path and will look for files starting with this prefix.

Log File Path

This option allows you to enter the path of the folder which contain the log
files.

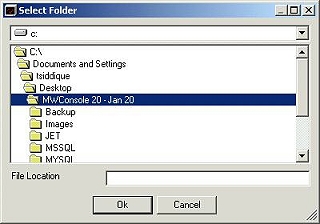
Browse

This option will open a dialog box from where you can select the path of the
log files. A dialog similar to the one below opens up.


Figure 7: Browse – Select Folder Form

Log File Naming

This option allows you to select the naming convention for your log files.
Options available are:

1). Adiscon(LogPrefix-yyyy-mm-dd.log)

2). Single

Type of Parser

This option allows you to select the type of the parser used for parsing the
log files. Options available are:

1). Adiscon Parser for PIX

2). Adiscon Parser for XML

Note: If you are interested in PIX Reports then choose Adiscon Parser for PIX.
If you are interested in Windows Report then choose Adiscon Parser for XML.

OK

Saves the settings and quits the form.

Cancel

Quits the form without saving the settings.

Note: Please note that the settings for this dialog box are global settings. It
means that whenever you open up any report, it will be opened up with these
settings. You can overwrite these settings for each report on individual basis.

After saving the settings, click on OK. This will take you back to Figure 1.
After setting up the database or the log file, the OK button in the top most
figure will take the user inside the MonitorWare Console application.
There
could be following Six cases that can happen when starting MonitorWare Console.

Case 1: Your login and password is validated and is correct and there is
no update required for the underlying database that you set in Figure 3. If
this is the case, you will enter MonitorWare Console successfully and you will
see a form similar to the one shown below:


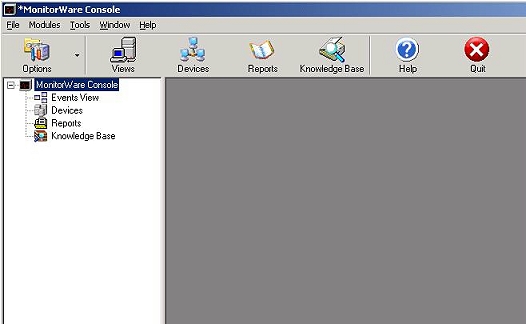
Figure 8: Main Form of MonitorWare Console

Case 2: Your login and password fails because you have either entered
wrong login and wrong password. If this is the case, you will stay on this
dialog box and it will ask you for the correct login and password again.
Following message box will be displayed to you:


Figure 9: Login Fail Dialog

Case 3: Your database to which the DSN in figure 3 is pointing to is not
a valid DSN. By valid DSN, we mean that the DSN is not pointing to the database
that contains SystemEvents table. In this case, you will get the following
message box:


Figure 10: Invalid Database

Case 4: Your database to which the DSN in figure 3 is pointing to is
valid but you don’t have sufficient permissions to query it. In this case, once
again a dialog box similar to the one shown in figure 10 will be displayed.

Case 5: You don’t have sufficient permissions to write something to the
registry. In this case, again a dialog box complaining that you don’t have
sufficient permissions will be displayed to you.

Case 6: Your login and password is valid and your DSN is pointing to the
correct MonitorWare database but the database is old. MonitorWare Console will
display you the following message:


Figure 11: Database Update Required Dialog

If you click on Yes, the database will be updated (because console needs some
additional tables for house keeping). If you click on No or Cancel, the dialog
box will disappear taking you to the main dialog in figure 1.

A complete step by step guide that explains how the reports can be generated with MonitorWare Console

How To Generate Reports with MonitorWare Console Manually (For Windows
Reporting Module – applicable for 2.0)

Article created 2004-03-10 by
Tamsila-Q-Siddique
.

1. You would need Base Product Key and Window Reporting Module Key for this
scenario.

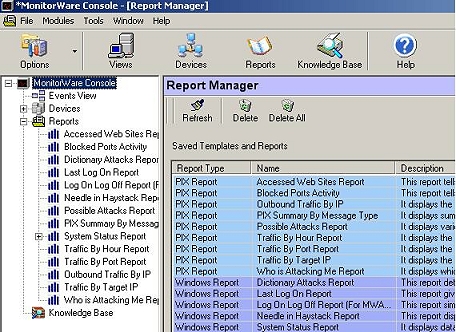
2. Once MonitorWare Console 2.0 is opened, on the left hand side, you can see a
tree view with a node called “Reports”. Click on that node. It will show you
the list of available reports under it as well as on the right hand side. You
will see something similar to the following figure:

You can now click on any of the displayed reports. For the purpose of this
article, I have selected “System Status Report” because it is a very
comprehensive report and summarizes the overall network activity very well.
Once you click on the System Status Report, you will see something similar to
the figure shown below.

Note: Windows Reports are displayed in a band of Lilac whereas the PIX
Reports are displayed in a band of Blue.

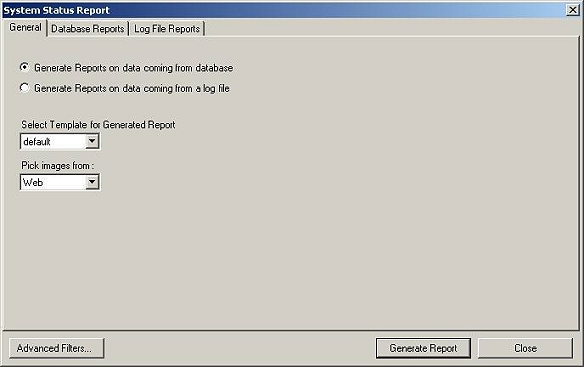
3. Once you click on System Status Report, the following form will be displayed

4. This form displays the report options. If you double clicked on any “Report”,
then in that case, this form will open up with default options that you had
set. (For details about defining global settings, please refer to MonitorWare
Console’s Manual which can be accessed by pressing the Help button in
MonitorWare Console’s tool bar). These settings help you out if you want to
generate many reports with almost the same settings.


Of course, you have the liberty to overwrite these settings. You can generate
reports on the data using the underlying database (even from an another
database) or from a log file.


You have the option of generating the reports on the fly. Even if MonitorWare
Console is connected to some other database, still you can give any DSN, its
user name and its password and the report will be generated on that
particular
database to which the DSN is pointing to. The same approach can be used with
the log files. You can override the default log file settings and MonitorWare
Console can generate reports using some other log file, still you can give Log
File Configurations in the above fields and the report will be generated on
that particular log file.


If “Generate Reports on data coming from database” is checked then all of the
controls on “Log File Reports” tab will be disabled. If “Generate Reports on
data coming from a log file ” is checked then then all of the controls on
“Database Reports” tab will be disabled. It means that these are mutually
exclusive.


You can select various templates for the HTML reports that will be generated
from the general tab and this tab also allows you to pick images from web or
from the local disk


5. MonitorWare Console provides a powerful feature of letting users define and
apply filters on any report. Using this form is further explained in the
upcoming steps, you can apply the filters of your own choice on the underlying
database or on the log files. (For details about the filters, please refer to
MonitorWare Console’s Manual which can be accessed by pressing the Help button
in MonitorWare Console’s tool bar).

Case 1:

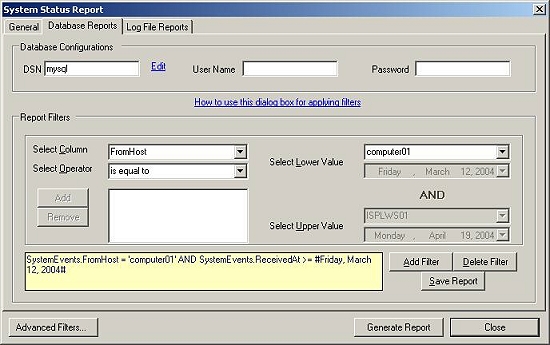
6. Lets assume in this scenario that, I am interested in getting a report for
the records that were logged (into the underlying database) after March 12, 2004
and were from the machine computer01.

7. For this scenario select the “Generate Reports on data coming from database”
option from the general tab. Switch to the Database Reports tab and setup the
filter in the following way:

8. At the bottom left of the screen shot above, you can see there is a button
which is called “Advanced Filters”. The settings made in this form applies on
the form as a whole. If you click on this button, a form similar to the one
shown below will pop up:

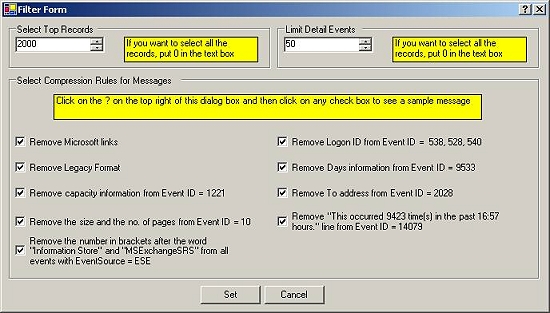
With this Advanced Filters’ Form, you can specify some additional filters for
the System Status Report. This Advanced Filter form provides an opportunity to
consolidate the records to a great extent. I will give one example to clarify
this. Some events that are generated in the Windows Event Log have the same
message but sometimes contain different Microsoft links. If you select the
check box “Remove Microsoft links” above, it will remove the Microsoft links
before consolidating them and hence a number of different events with count 1
could be consolidated to just a single line. Please note that it doesn’t remove
the information permanently from the database. It just removes this information
for generating this report. Similarly other check boxes can be checked to
provide a greater level of consolidation.

9. Once you define the advanced filters in the form shown above, press the “Set”
button. You will be taken back to the previous Filter From.

10. Once you have defined all the filters, you can actually save all of your
settings by pressing the “Save Report” Button in the Filter Form so that you
don’t have to define these filters daily if you are interested in seeing this
report daily.

11. You can now press the “Generate Report” button. It will open up a report in
HTML format according to your defined filters as shown below: (Please note that
some information has been removed purposely for security reasons)

System
Status Report

In this report, you also have the option of expanding and contracting the node
of From Host, Event Log Type, Event Source and Event Id.

Case 2:


12. Lets assume in this scenario that, I am interested in getting a report on
all the records that were logged (into the log file).


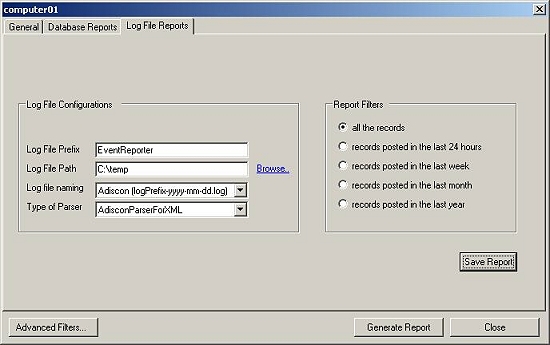
13. For this scenario select the “Generate Reports on data coming from a log
file” option from the general tab. Switch to the Log File Reports tab and setup
the filter in the following way:

14. Once you have defined the filters, you can actually save all of your
settings by pressing the “Save Report” Button in the Filter Form so that you
don’t have to define these filters daily if you are interested in seeing this
report daily.


15. You can now press the “Generate Report” button. It will open up a report in
HTML format according to your defined filters as shown below:

System
Status Report

In this report, you also have the option of expanding and contracting the node
of From Host, Event Log Type, Event Source and Event Id.

Note: You can have a look at other available
Windows Reports
.

How To setup MonitorWare Console

How To setup MonitorWare Console

Article created 2003-11-19 by
Wajih-ur-Rehman.

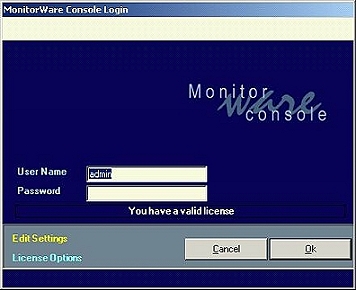
After installation, once MonitorWare Console is started, a
dialog box similar to the one shown below would be displayed.

The default user name is “admin” and password is nothing
(as shown above). Once a user enters into the application, this password can be
changed.

At the bottom left corner of this dialog box, there are two
links “Edit Database Connection” and “License Options” The latter one is
self-explanatory. If you click on it a license dialog appears where you can view
or change your license key and/license name. There is also a link to order the
product directly via our online ordering system.

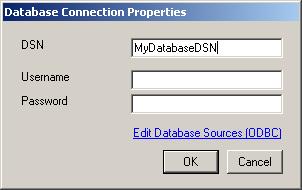
The other link in the login dialog, “Edit Database
Connection” is used if the user wants to change the database connection.
Currently MonitorWare Console supports Microsoft Access, SQL Server and MySQL.
Once the above-mentioned link is clicked, a dialog box, as shown below, will pop
up. Using this dialog box, the user can change the underlying database.

In the DSN, you can provide the name of the DSN that is
pointing to some existing MonitorWare Database (Assuming that you already have
configured MonitorWare Agent, EventReporter or WinSyslog). You can also create a
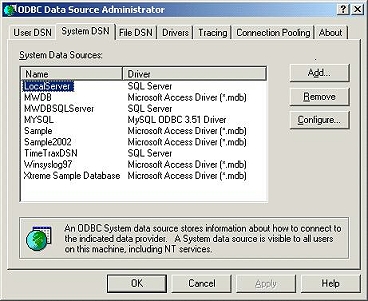
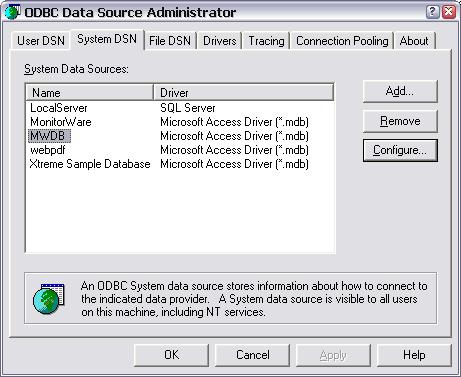
new DSN by clicking on the link “Edit Database Sources”. It opens the ODBC Data
Source Administrator window. On the System DSN tab the user can configure all
found DSNs.

Use the System DSN tab to select the data source. Press the
“Configure…” button to setup the database path for the data source.

Provider tab at the top left of the above screen is used to
select the database. Connection tab is used to select the database path. Once
the provider and the connection has been selected, Test Connection button can
test whether the connection with the specified database has been established or
not.

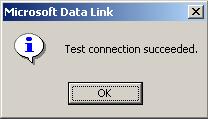
If the dialog box, as shown below, is displayed, it means
that the connection with the specified database has been set up properly and the
user can proceed further by pressing the OK button

On the other hand, if a dialog box, as shown below is
displayed, it means that there is something wrong and the connection with the
mentioned database has not been established.

After setting up the database, the OK button in the top
most figure
will take the user inside the MonitorWare Console application.