How can I make Event ID part of the actual Syslog message while forwarding to a Syslog Server?

How can I make Event ID part of the actual Syslog message while forwarding to a Syslog Server?

Created 2004-06-24 by Tamsila-Q-Siddique.

We are using MonitorWare Agent / EventReporter to forward Windows Event logs to a Syslog Server. The resulting syslog message doesn’t have the Event IDs in them. How can we make Event ID part of the actual Syslog message?

One of the proposed solution would be to forward the Event Log messages using SETP Server. The resulting message would have the Event IDs in them. Click here to know the difference between SETP and Syslog!

But there are other ways to include the Event ID even without using SETP (which is obviously not an option if you would like to send to a non-Adiscon backend). So you can do one of the following:

  1. Use XML Format – This is the best recommended option. With XML format, you get everything about this event and you get it in a well-structured way. It includes all of the properties described in our Event Properties reference. To enable XML format, simply check “Use XML to Report” in the “Forward Syslog” Action.
  2. Use Custom Format – In the “Forward Syslog” action, you can specify your own custom format in the “Message Format” text box. By default it is set to %msg%, but you can include whatever you like. Use the “Insert” link to do this (or simply type it)! Be sure to read the Property Replacer” documentation to see the full power. This option is a good one, especially if you intend to parse the data… because *you* can exactly specify what you would like to see.
  3. Use MoniLog Format – This is our former legacy format. It includes a bunch of useful information, but it has a number of anomalies, which might hit you in few cases when parsing. We do not recommend it, but if you would like to use it, you can select the “Insert” link in the “Forward Syslog” action properties. Then, select “Replace with MoniLog Format”. It will generate a custom format of the type given below. Again, we do not recommend this, but it is a way.## %severity% %timereported:::uxTimeStamp%: %source%/%sourceproc% (%id%) – “%msg%” ##
  4. Change Event Log Monitor Settings – You could also change the Event Log Monitor itself to generate the legacy format. Then, you do not need to change the “Forward Syslog” action’s settings. The big drawback is that now the Event Log Monitor does emit an old format, which is not meant to be processed by any other MonitorWare product. If you just use the product as a back-end for your own front-end, this is not an issue. Anyhow, we still recommend to go for approach #3 instead of this. If you absolutely want to do it this way, this is how it is done:
    Go to the Event Log Monitor properties. Click on the “Advanced Options” button. Check the “Use Legacy Format” checkbox. This will enable some other checkboxes. Review the options to see which of these you want.

We have provided the options at hand. We *strongly* recommend to go for either option 1 or 2. If you choose option 3 or 4, you can receive a parsing error from time to time. However this has been solved after introducing the newer formats.

As a general hint, you may want to take into account that Windows Event Log messages can become rather lenghty. They often go over the syslog RFC size of 1024 bytes. If you run a non-Adiscon Syslog Server, you need to ensure it can receive such large messages, because otherwise some information might be missing (with option 2, you can customize what you would like to be missing in such cases – by limiting the size of %msg% via the property replacer).

Performance Optimizing Syslog Server

Performance Optimizing Syslog Server


Do you want to receive syslog in a Windows environment? Take a look at WinSyslog!

Receive, process and store your syslog data from routers, firewalls or linux/unix servers with this easy to configure application in your Windows environment. Troubleshoot network problems or be alerted, all quickly and easily.

Take a Quick Tour to WinSyslog to know more about its exciting features or directly download the free and full-featured 30 day trial version.


Article created 2004-01-09 by Rainer Gerhards.

We are quite often asked how many syslog message per second MonitorWare Agent can receive. The answer is not as simple as it may look. It largely depends. So I finally thought I write this brief article on the factors that influence syslog server performance. Obviously, you can also use it as a rough guide to optimizing your setup.

Let me try to outline a few factors influencing the performance.

To get started, you should know that MonitorWare Agent is optimized for large traffic bursts. A little understanding on how it is done helps to understand hardware sizing issues. MonitorWare Agent is multithreaded. There are threads that receive messages and there are threads that process them. These two thread types are loosely coupled via an in-memory queue. The receiver threads (by default) have a higher priority than the processing threads. So what happens when a lot of traffic comes in is that the receiver threads very fast receive the messages and store them in memory. The messages are only processed by the processing threads when no receiving thread is using the system. So on a busy system, an in-memory queue of received but unprocessed messages is build up. Obviously, if the machine continuously receives messages at a very high rate the in-memory buffer fills up and received data begins to get lost. However, this design guarantees that as many messages can be received as the machine is capable of. At least for traffic bursts, this de-couples the receive ability from the speed of the rule set actions.

This – the rule set – is another very important factor in deciding how many messages a given system can process. Naturally, writing received messages to a file is much less performance-intense than writing to a database. A small rule set with only a single rule, no filters and a single action is also faster to process than a complex rule set with many rules, complex filters and actions. Of course, MonitorWare Agent is optimized to process complex rule sets quickly… but even this takes time. So If you would like to squeeze the most out of a given machine (or need to process vast amounts of incoming messages), it is worth tweaking the rule set. If you would like to build a high-traffic central syslog server for creating a central archive… just do that. Create a rule set with a single rule, no filters and just a “write to file” (NOT “write to database”!) action. This will give you the optimal performance.

For a highest performance, you will obviously dedicate a machine just to MonitorWare Agent. Most importantly, if you must log to a database, make sure the database server is on a different hardware! Database server software needs considerable CPU resources and you will definitely not like to take them away from your syslog server. If you use a remote database, however, you will make sure that the network connection to it is well. So you should invest in a good 1 GB ethernet board and create an exclusive connection between your syslog and your database server (you may use an otherwise not connected ethernet switch).

OK, now we have arrived at hardware. Of course, the faster the box, the better. Add plenty of memory to take care for traffic bursts. The more physical memory the machine has, the better it can process traffic bursts. If you do not expect traffic bursts, memory is not that important. However, it is advisable to add some extra memory just for the case of unusual amounts of messages, e.g. caused by a malware outbreak or other exceptional situations.

A fast CPU is obviously important. Multiple fast CPUs are better. Due to our threading nature, multiple CPUs are very efficiently used. However, do not add CPUs without reason. If you have a central server wich just runs one syslog service (eg at standard port 514) and one rule that writes the messages to a file, you actually have 2 “real” threads running (plus a little overhead). So it obviously is a good idea to have at least two CPUs. A third CPU may bring some extra performance, but I would expect only a moderate increase. A fourth or any more CPU will not do any good – at best, they idle, at worst they add OS overhead. So for a typical configuration, a dual-CPU system is the best fit. If you run multiple listeners, additional CPUs help to improve performance greatly. They scale more or less one-to-one. Adding CPUs does not equally well work to improve complex ruleset performance. This stems back to some of the internal ordered queue handling and the need to keep things in order. So as another general advise, it is good to add CPUs for additional listeners but does seldomly make sense to take care of for complex rule set.

If your store data locally, you would obviously like to have as fast hard disk as you like. If you plan for highest performance, stay away from raid-5 arrays. They have bad write performance. Use RAID 0 + 1 instead. Use it at the hardware level! Make sure that the disk is defragmented – this is often overlooked. On a fast, defragmented disk, MonitorWare Agent’s file monitor can actually “stream” messages right to the hardware. It does not need to seek on disk, so you can expect performance close to the disk’s physical maximum.

You intend to shuffle a lot of data through the system – make sure you motherboard is well designed. We have seen bad motherboards slowing down an otherwise well-capable system.

Most importantly, make sure the system can talk nicely to the network. Use a brand, high performance busmastering NIC (network interface card). I am in favor of brand hardware because of the drivers. Most brand products come with drivers that actually allow you to leverage the hardware. Some (but definitely not all) non-brand cards may come with more or less the same hardware, but too slow drivers. If you expect high traffic make sure your card can handle this. If in doubt, add a second or third card. If you do, make sure it is connected to a different switch, otherwise the switch may become the bottleneck.

In general, make sure that the network is capable of carrying the traffic. This is especially important if log data is flowing in via the WAN.

Another factor greatly influencing MonitorWare’s performance is the syslog protocol used. UDP provides the lowest overhead, but for obvious reasons messages which can not be received are lost. TCP based logging comes with some overhead, but it will guarantee that all messages are received – at least until the sender is internally overrun). So TCP based protocols lower the absolute reception rate, but are often a better choice because they offer a much better guarantee that no data is lost (there is no 100% guarantee, but this is finally beyond the scope of this discussion). Please note that there are multiple options for TCP delivery nowadays – “plain” TCP (not standardized) and RFC 3195 compliant “syslog-reliable”. The later is more reliable but unfortunately very seldomly found in actual devices today. Even “plain” TCP is implemented only in few devices, so this may limit your choices to UDP in the actual case. Keep in mind, however, that MonitorWare Agent can run multiple listeners. So you could, for example, run three listeners, one for RFC 3195, one for “plain” TCP and one for UDP (as a reminder, a 4 CPU system would play nicely with that). Using multiple listeners brings you the best of all worlds. Please note that by default the TCP based listeners have a lower thread priority, so this also gives you a little more headroom when it comes to UDP bursts.

Finally, think about the message sender (the “device”, may of course also be another server emitting syslog messages). In rare circumstances (worm outbreak) it may happen that the sender itself exhausts its resources and is not capable to actually send all messages over the network. With UDP, this may simply happen because the (not very large) IP stack send buffer overflows. Even with TCP it can happen – it just can’t happen at the protocol level. But the application emitting syslog messages may overflow its internal buffers so that the data never makes it to the TCP queue. While sender overrun is seldomly experienced (and even more seldomly detected as such!), it has happened in reality and may happen to you.

The especially bad thing about an sender emitting massive amounts of data is that it may also overrun other parts of the whole network, thus affecting otherwise unaffected systems. Recent Internet worms have provided good examples of this in the wild. So if you can tune the sender, try to place some safeguards in there. For example, you could limit the amount of messages of a specific type that are sent within a specific period of time. Or, as another example, you can set MonitorWare’s Windows event log monitor to emit only 10 messages per second. If you do this, you may loose some message from the Windows box in case some malware takes it over, but you keep the rest of your syslog system healthy.

I hope this clarifies at least many of the important factors behind syslog server performance. And now back to the basic question: how many messages can MonitorWare Agent handle? Honestly, I don’t know. You may now better understand why I do not. It depends on what you do with it. I know, however, that we have quite some customers processing vast amounts of data, including burst traffic with our products. On the other extreme, in our lab, I have configured MonitorWare Agent to write log data to an Microsoft Access database on a diskette drive… It could handle large bursts, but it took hours to write the messages to the database… 😉

Creating a simple Syslog Server

Step-By-Step Guides

Article created 2003-04-30 by Rainer Gerhards.

Creating a simple Syslog Server

In this scenario, a simple syslog server will be created. No other services are configured. The syslog server will operate as a standard syslog server on the default port of 514/UDP. All incoming data will be written to a single text file.

Step 1 – Defining a Rule Set for File Logging

The rule set specifies what action to carry out. You might be tempted to define the service first, but starting with the rule set makes things easier as it already is present when the service will be defined later and needs to be bound to a rule set.

To define a new rule set, right click “Rules”. A pop up menu will appear. Select “Add Rule Set” from this menu. On screen, it looks as follows:
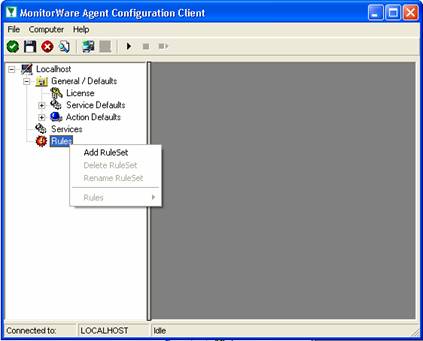
Then,a wizard starts. Change the name of the rule set to whatever name you like. We will use “Write Syslog Log File” in this example. The screen looks as follows:

Click”Next”. A new wizard page appears:

There,select file logging. Do not select any other options for this example. Also, leave the “Create a Rule for each of the following actions” setting selected. Click “Next”.
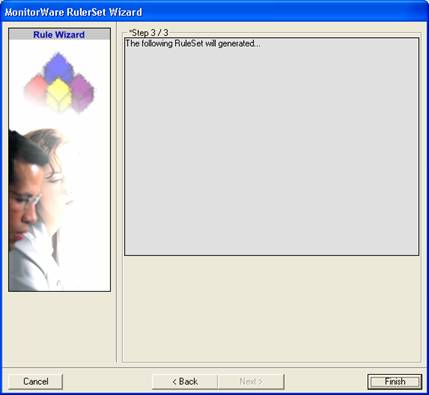
This is just a confirmation page. Click “Finish” to create the rule set.

The wizard closes and the client shows a newly created rule set.

As you can see, the “Write Syslog Log File” rule set is now present. Please expand it in the tree view until you have the following screen contents:

As you can see, we have a “File Logging” action configured. We will review the settings just for your information. Click on “Filter Conditions”:
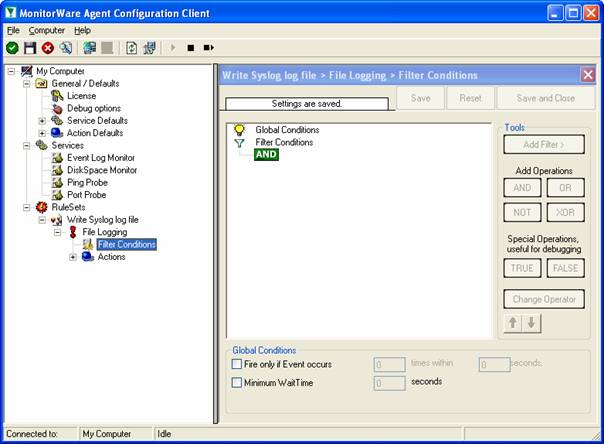
As you can see, none of the filter conditions are enabled. This means that the all information units (incoming messages) will be matched by these filter conditions. As such, the rules for the “File Logging” action will always be carried out.

Please note that this also means that all syslog priorities and facilities will be written to the same file.

Now let us check the “File Logging” action itself. Please select it in the tree view:
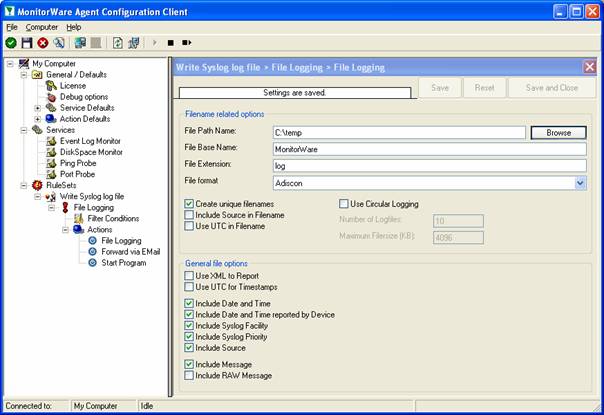
As you can see, it has been created with the default parameters. Each day, a file will be created in the C:\temp directory and its base name will be MonitorWare. It will include all information items in the file.

If you would like to store it into a separate directory or change the file name, here is the place to do it. Important: please make sure the directory you specify exists! If it does not yet exist, please create it before you start the service. If the directory does not exist, the service is not able to store any files.

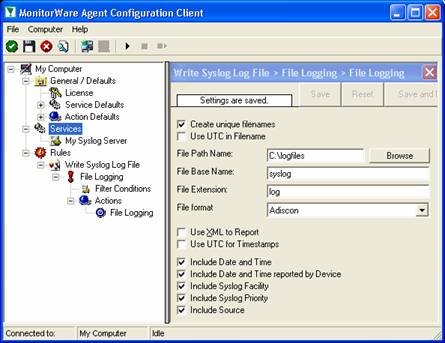
In our example, we would like to save it to “c:\logfiles” with a base name of “syslog”. Therefore, we change these properties:
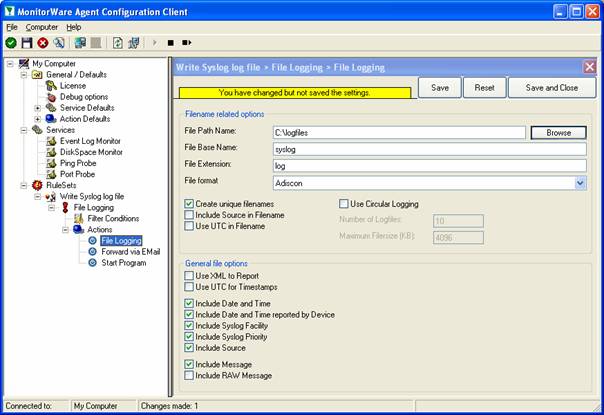
After doing so, you will notice the yellow text on top of the window. It tells you that the configuration changes have not yet been applied. To do so, press “save”.
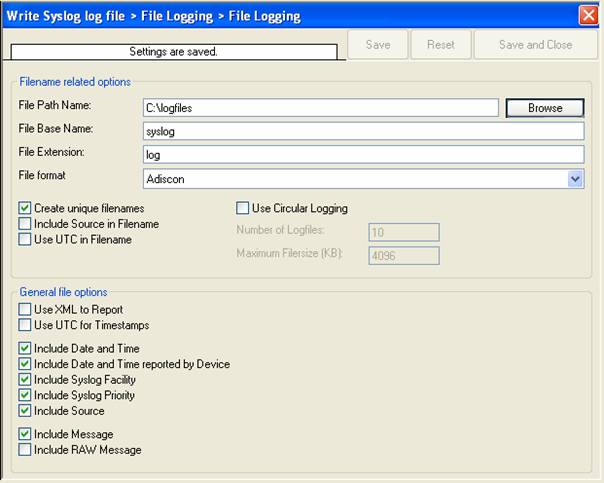
Now you have a workable rule set for logging incoming messages to a text file.

Step 2 – Create a Syslog Server Service

Now we need to define a syslog server service. A syslog server is also sometimes called a “syslog daemon”, “syslogd” or “syslog listener”. It is the process that receives incoming messages.

To define it, right click on “Services”, then select “Add Service” and the “Syslog Server”:
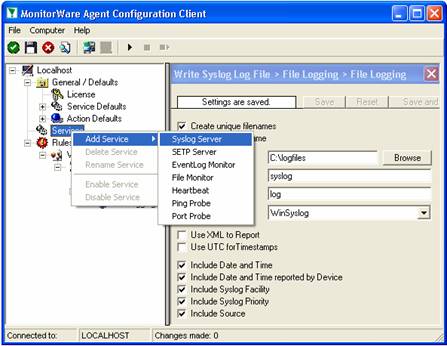
Once you have done so, a new wizard starts:

Again, you can use either the default name or any one you like. We will use “My Syslog Server” in this example. Leave the “Use default settings” selected and press “Next”:
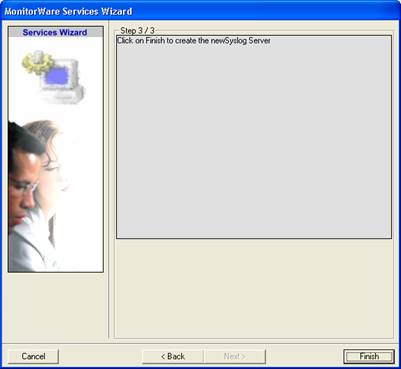
As we have used the default, the wizard will immediately proceed with step 3, the confirmation page. Press “Finish” to create the service. The wizard completes and returns to the configuration client. There, you will see the newly created service beneath the “Services” part of the tree view:
To check its parameters, select it:
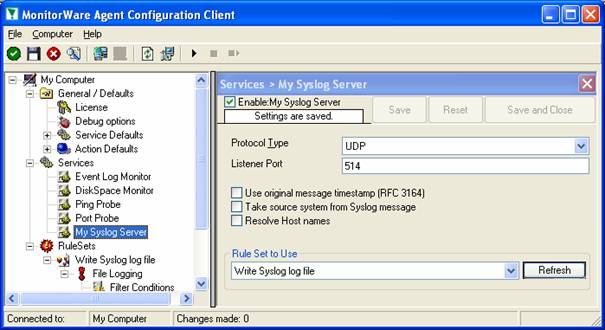
As you can see, the service has been created with the default parameters. As such, it operates as a RFC compliant standard syslog server.

Please note that the “Write Syslog Log File” has been automatically assigned as the rule set to use. This is the case because we already created it and it is the only rule set. By default, the wizard will always assign the first rule set visible in the tree view to new services. If another one is to be used, you need to change it to the correct one here in the service definition.

Also, ote that the wizard uses the default properties from the “Service Defaults”. Obviously, if these are changed, the default properties for new services will differ.

This procedure completes the configuration of the syslog server.

Step 3 – (Re-) Start the MonitorWare Agent Service

MonitorWare Agent cannot dynamically read changed configurations. As such, it needs to be restarted after such changes. In our example, the service was not yet started, so we simply need to start it. If it’s already running, you need to restart it.

Service control can be done with both the respective operating system capabilities (like service manager MMC) or with the configuration client. These are shown in the red surrounded area in the following screen shot:
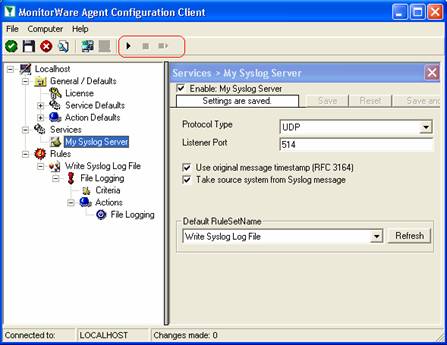
The buttons resemble Windows service manager – start, stop and restart. In this example, stop and restart are grayed out because the service is not running.

After service restart, the new definitions are active and MonitorWare Agent is ready to accept and store incoming messages.

Step 4 – Configure your Syslog-Enabled Devices

Even though MonitorWare Agent is now ready, it can only receive messages if some devices send them. Remember, syslog is a protocol where the server is passively waiting for incoming messages. As long as no device sends message, the syslog server will not log anything.

Since there are a large variety of devices, we unfortunately cannot provide device specific instructions. However, almost all devices need to be configured with their specific configuration tool. Typically, only two settings need to be made: one to activate syslog messages at all and one with the syslog server IP address or name.

For some devices, we have step-by-step guides. Please read “Sample Syslog Device Configurations” for further details.

Remember: the computer running MonitorWare Agent now acts as a syslog server. As such, you need to find out its IP address or name and supply it to the device as the syslog server. Please note that not all devices can operate with computer names. Use the IP address, if in doubt.

400-201 Study Guides   ,
70-980 Study Guides   ,
640-911 exam   ,
SSCP certification   ,
70-177 Brain dumps   ,
220-901 pdf   ,
2V0-621 test   ,
70-410 Brain dumps   ,
640-916 certification   ,
1Z0-051 Study Guides   ,
220-801 Exam   ,
LX0-104 certification   ,
1Y0-201 pdf   ,
OG0-093 certification   ,
1V0-601 certification   ,
LX0-104 test   ,
350-060 exam   ,
200-101 pdf   ,
1z0-808 Study Guides   ,
300-209 dumps   ,
PMP certification   ,
EX300 test   ,
JN0-102 certification   ,
70-177 pdf   ,
640-916 pdf   ,
000-104 test   ,
CAS-002 dumps   ,
300-075 certification   ,
350-001 test   ,
100-101 test   ,
70-533 certification   ,
2V0-621D test   ,
070-461 test   ,
640-692 Study Guides   ,
70-413 Study Guides   ,
70-411 test   ,
1Z0-051 dumps   ,
200-310 pdf   ,
70-463 Study Guides   ,
700-501 certification   ,
1Z0-804 exam   ,
810-403 dumps   ,
70-347 pdf   ,
OG0-093 dumps   ,
352-001 pdf   ,

Configurations for SETP and Syslog Server

Configurations for SETP and Syslog Server

Created 2003-04-04 by Wajih-ur-Rehman.

I want to have a MonitorWare Agent acting as a Central Server such that it can accept both SETP as well as Syslog Messages and log them to a database. What configurations should i make?

You will create the following configuration settings for MonitorWare Agent that will be acting as the central server for collecting all the messages:

  1. Right click on “Services” node and add “Syslog Server”. A new node will be added under the Services node. Click on this newly added node and change the settings according to your requirements.
  2. Right click on “Services” node and add “SETP Server”. A new node will be added under the Services node. Click on this newly added node and change the settings according to your requirements.
  3. When you install MonitorWare Agent, it creates one RuleSet automatically. Right click on it, go to Rules and add a new Rule. You will see a new Rule under the Rule Set.
  4. When you expand this newly created Rule, you will see two nodes under it. One is “Filter Condition” (by default, “No Filter” is selected.) and the other is “Actions”.
  5. Right click on Actions, and add “Write to Database” action. and set the settings.
  6. Go back to the Service that you created in Step 1 and Step 2 and make sure that the RuleSet under which you have defined your own Rule in step 3 is bound to both of these services.