MonitorWare Agent 10.2 Released
Build-IDs: Service 10.2.466, Client 10.2.0.1559
Features |
|
Bugfixes |
|
You can download Free Trial Version of MonitorWare Agent.
Log Consolidator and Alerter
Build-IDs: Service 10.2.466, Client 10.2.0.1559
Features |
|
Bugfixes |
|
You can download Free Trial Version of MonitorWare Agent.
The central log server is the most important part of our central log storage and thus will be configured as the first part. And due to all the things it needs to do, it has the most work of course. When selecting your machine to install the central log server on, please keep in mind, that you need quite a good machine for larger networks. If you have a very large environment, it might be a good idea to use multiple servers for this scenario with a load balancer and a separate database server. But in this guide, we will have it all on one machine.
Prerequisites:
The following should be installed and working:
The list holds the things necessarily needed. In the brackets is schon which we will use in this example. Please note, that this will work with other versions as well, especially with MonitorWare Agent.
As mentioned before, MonitorWare Agent will have multiple purposes. It should receive syslog via TCP and UDP, monitor the local EventLog and textbased logfiles as well as writing everything into a database and sending email messages in case of error and critical messages occuring.
First of all, we will set up the processing rules and actions. We will start this way due to the design of MonitorWare Agent. Since the Services need to be bound to a ruleset upon creation, we will start this way, so the ruleset is there already when creating the service.
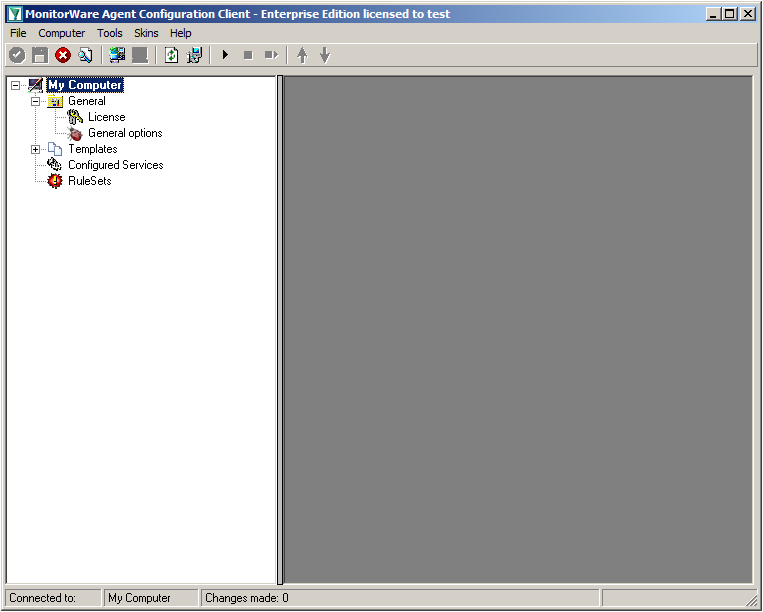
When starting MonitorWare Agent the first time, you will see on the lefthand side our overview of “Configured Services” and “Rulesets”. Right now, there shouldn’t be any entries here.
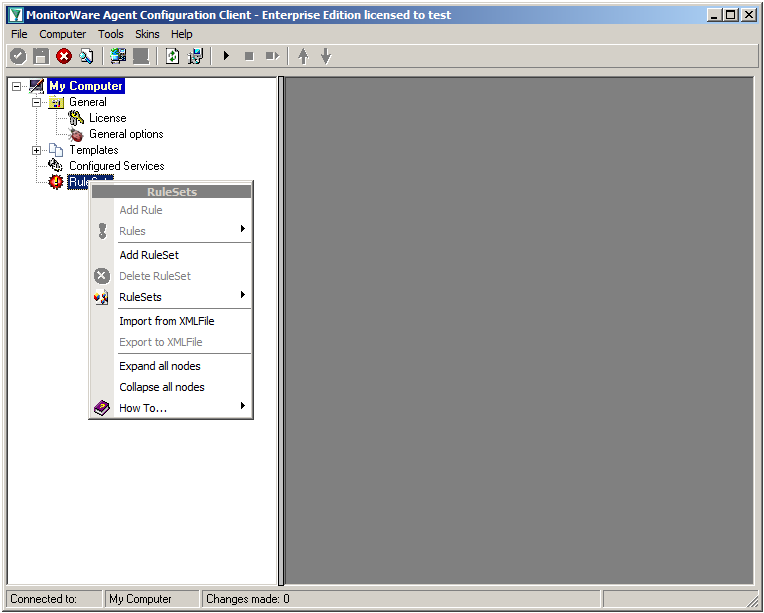
Right click on “Rulesets”. A context-menu will open.
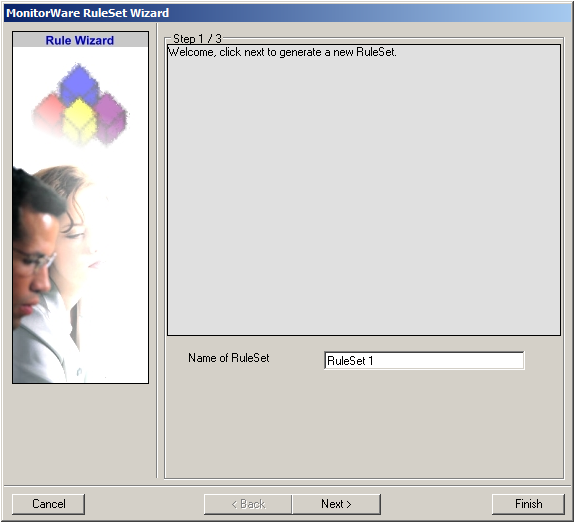
Choose “Add Ruleset”. The ruleset wizard will open. On this first screen, we can choose the name of the ruleset.
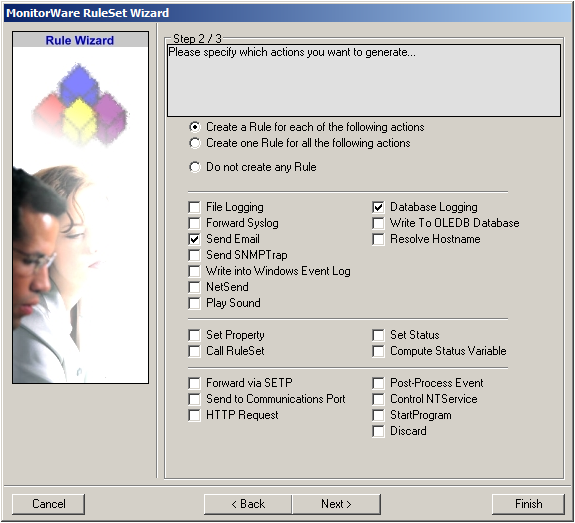
After choosing a name (in this example “Storage & Alert”), click on “Next”. Here we can set, what we will need. Leave the marker for “Create a Rule for each of the following actions” and choose “Send Email” and “Database Logging”.
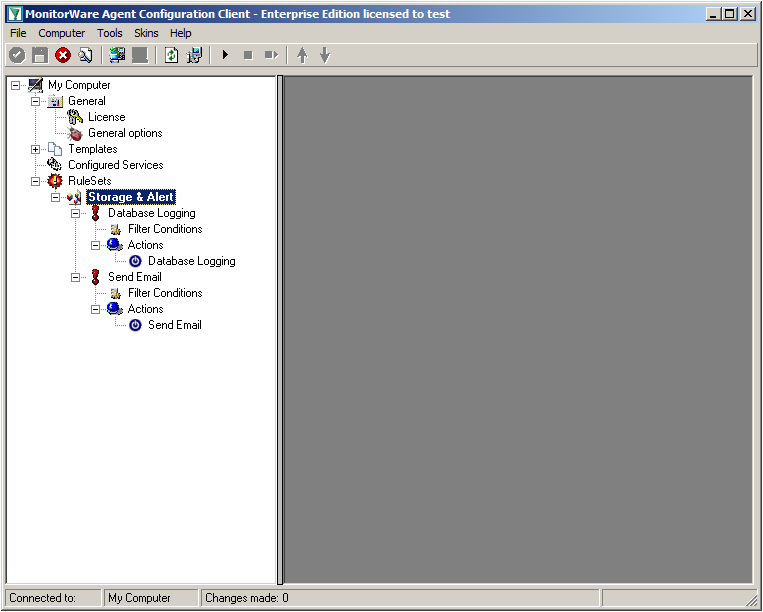
You can now click on Finish. You will now see a new ruleset in the treeview on the left hand side. If you expand this view completely, you can see the two rules that have been created and the actions that are in there. You should have a rule “Database Logging” and a rule “Send Email”.
We will now start with configuring the action for “Database Logging”. Expand the branch called “Database Logging” completely. Under actions you will find the “Database Logging” action. When you click it, you will see the configuration window.
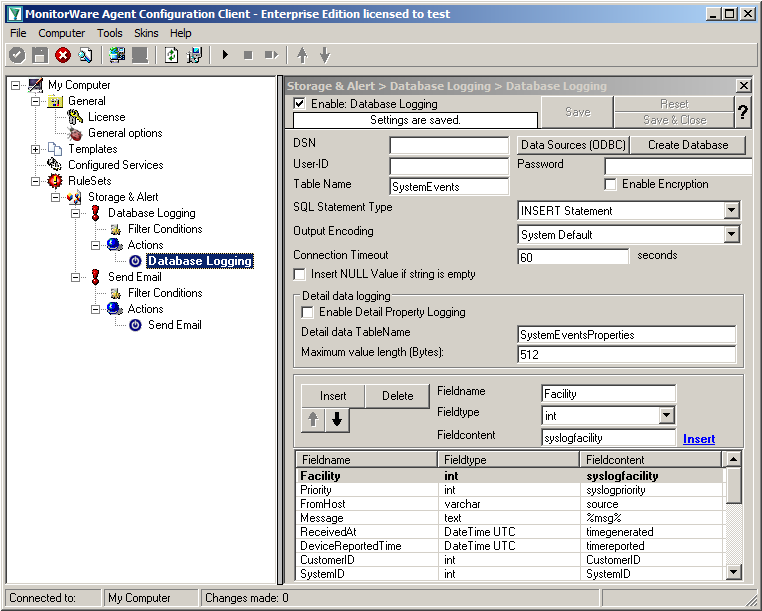
Click on the button “Data Source (ODBC)”. This will open the ODBC Data Source Administrator.
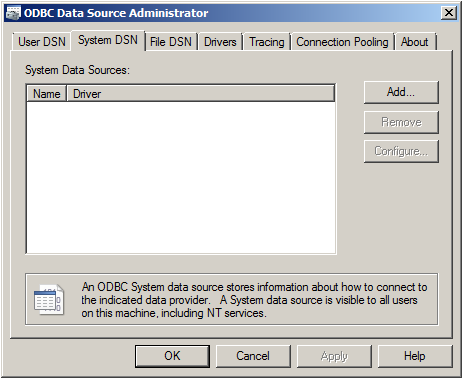
Go to System DSN and click “Add…”.
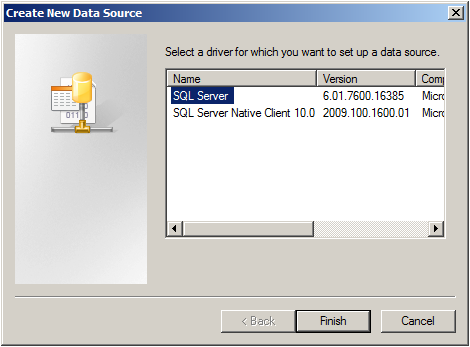
Select SQL Server from the list and click “Finish”.
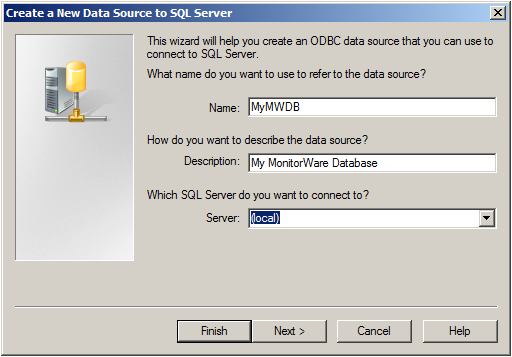
Choose a name for the datasource and a description. In this case we choose MyMWDB as name. As server choose the name of the server where the database is. In our example we use localhost. Now click on “Next”.
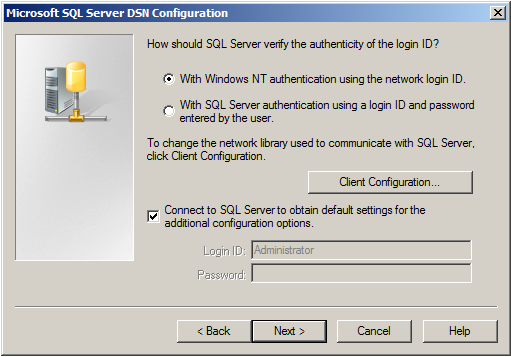
Select “SQL Server Authentication” and type in your MSSQL Login ID and Password. If you have Windows NT authentication like in our case, leave it as is. Click on “Next”.
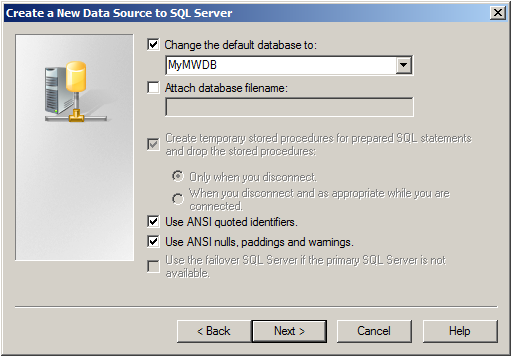
Select “Change the default Database to:” and choose your new created Database, in our example we use “MyMWDB” which we created beforehand. Click on “Next”.
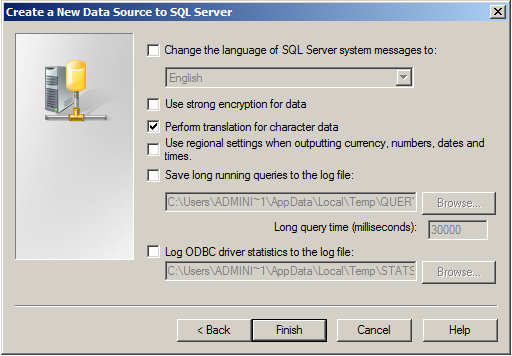
Leave all at default settings and click “Finish”, a test Window will appear:
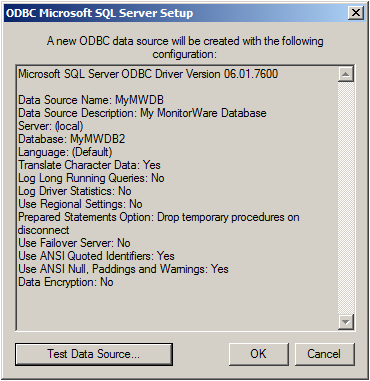
Click on “Test Data Source”, normally the following Window should be displayed:
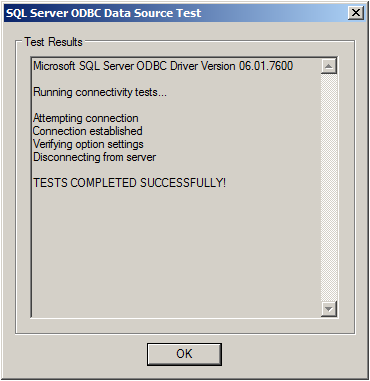
If not, go back and check your Settings, if yes, Click “OK” and exit the System-DSN Wizard.
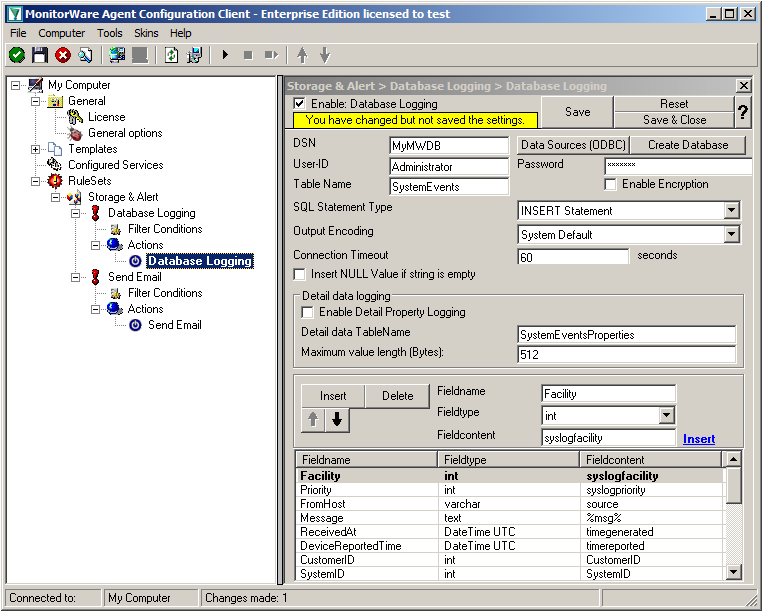
Now we are back in MonitorWare Agent. Insert the DSN for your database, User-ID and Password.
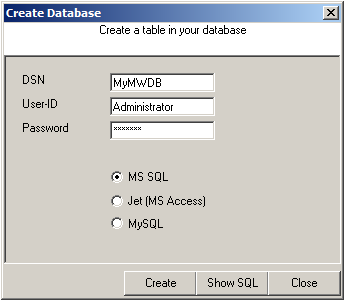
After that, click the “Create Database” button. We still need the tables that the log messages will be stored in. After clicking the button, a small window will open. Insert the DSN, User-ID, Password and choose the type of database you are using, in our case MS SQL. By clicking on the “Create” Button, the tables needed for the default database format of the MonitorWare Products will be created. After that, close the window.
Since we want to log all messages into the database, there is no need to set up any filters.
In the next step, we want to set up the Send Email rule. But since we only want error log messages, we need to set some filters. Click on the Filter Conditions. You will see the overview over the filters for this rule.
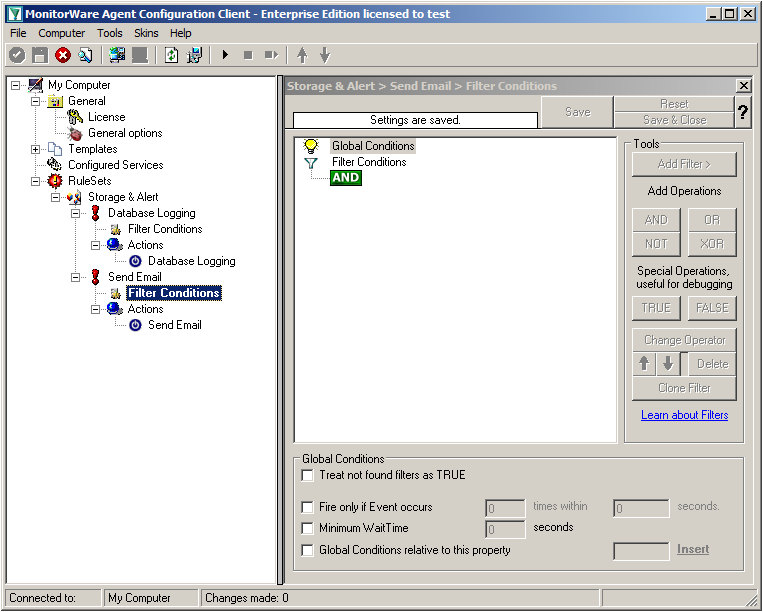
Right now, the view is empty except for a AND operator. Double-click it to change it into a OR operator.
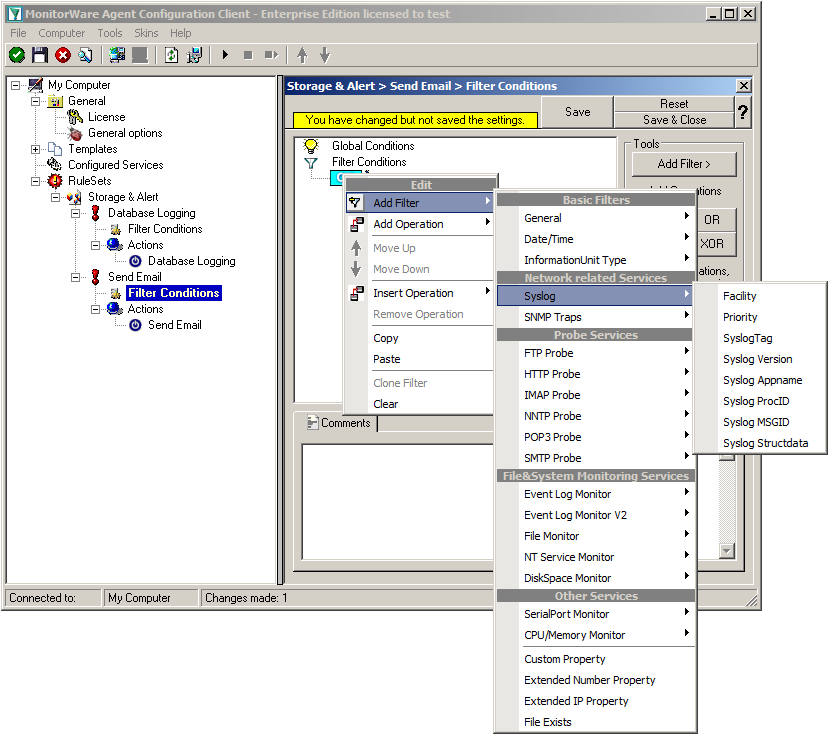
Right-click on the OR operator. A context menu will open. Go to Add Filter -> Syslog -> Priority.
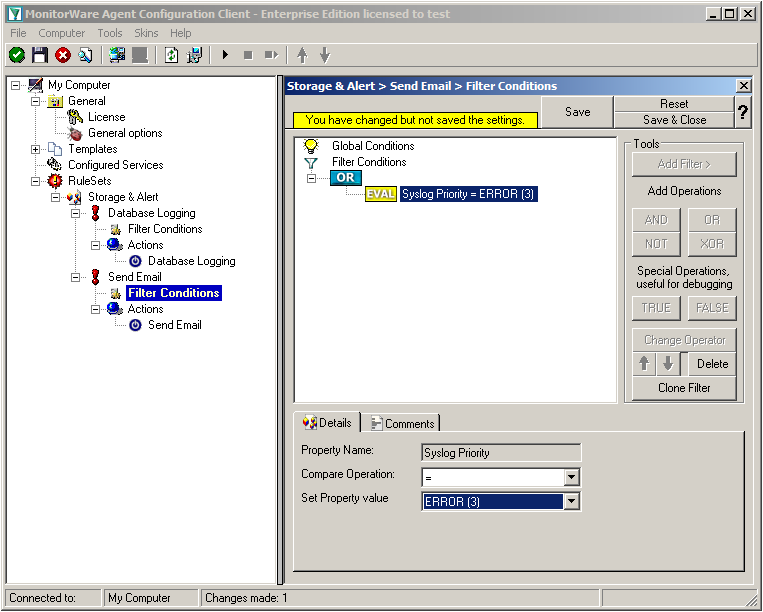
Click on the filter setting and change the property value to “Error (3)”.
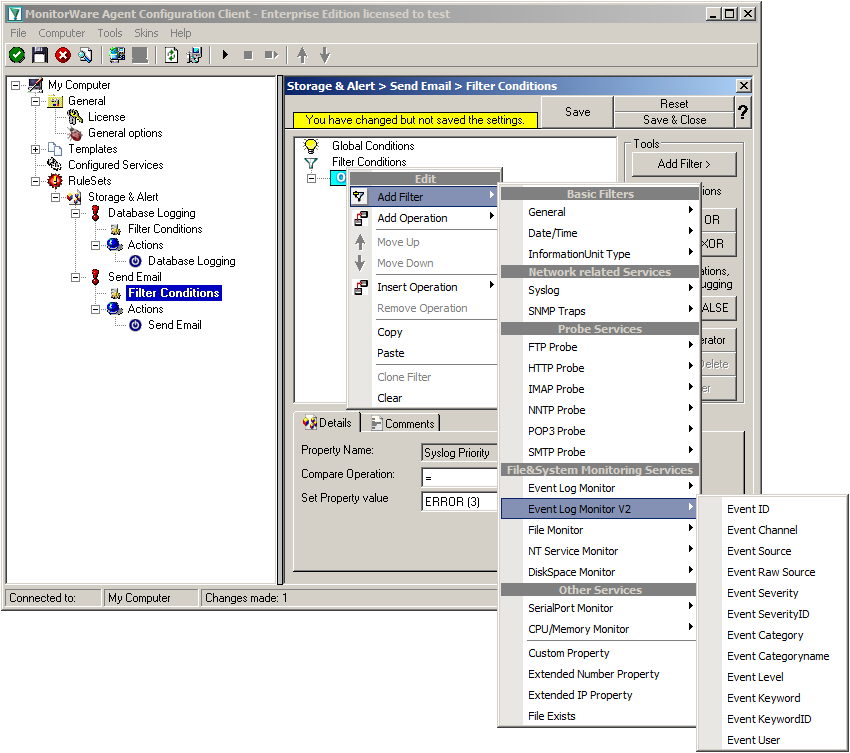
Again click on Add Filter -> EventLog Monitor V2 -> Event Severity.
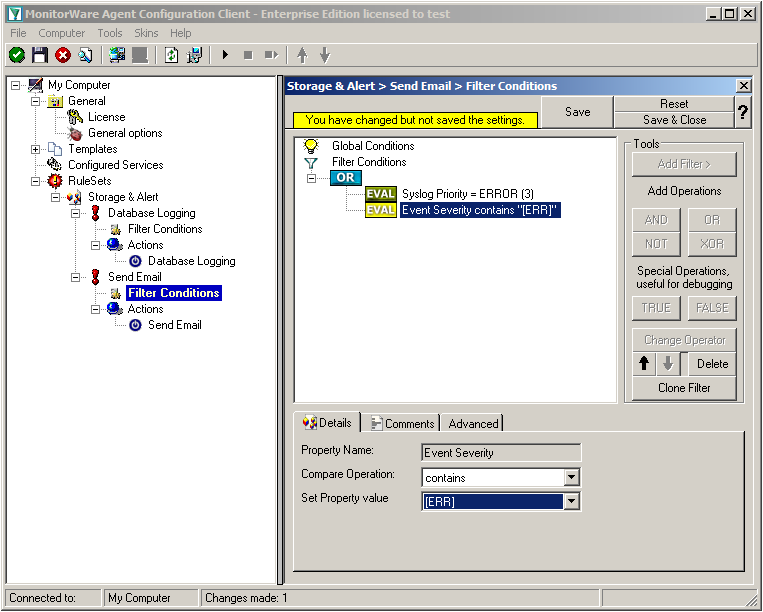
Click on the second filter setting and change the property value to “[ERR]”.
We are now finished with the filter settings. The filter will accept all log messages that are either of syslog proiority error or critical or Windows Event severity error. The OR operator ensures, that every of these cases will be accepted. When the messages are approved of fitting into the filter, the action will process them.
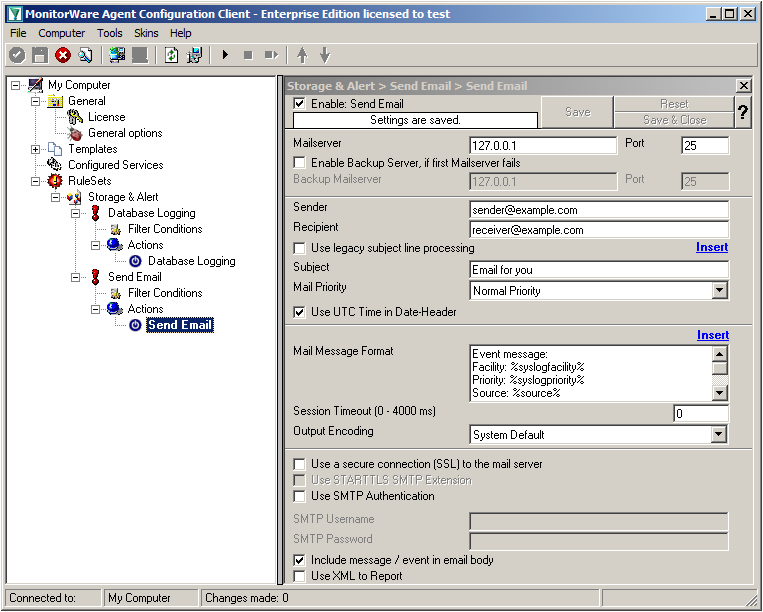
Click on the “Send Email” action now. You will see the configuration window on the right pane. Currently, there are only the default values in there.
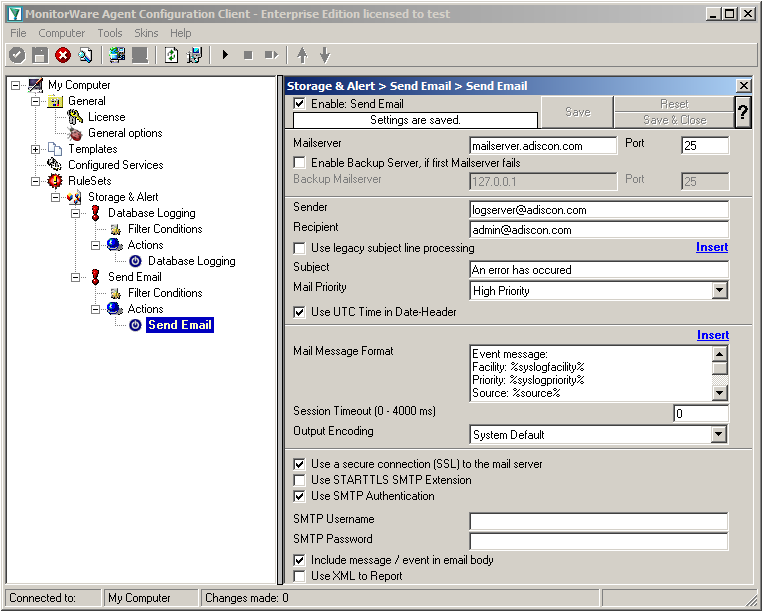
We need to change some settings here, like the Mailserver, Sender and Recipient, the subject and the Mail Priority. If necessary for your mail server, you need to change the authentification settings at the bottom as well. in our example we need SMTP Authentication for that. If you want, you could even enable the backup mail server.
Now we have all actions fully configured. It is now time to setup the configured services.
Currently, when clicking on Configured Services you will not see a thing. But we will configure the services now. Without them, MonitorWare Agent is not able to get any log messages. We will setup 2 Syslog Receiver, 1 EventLog Monitor and 1 File Monitor.
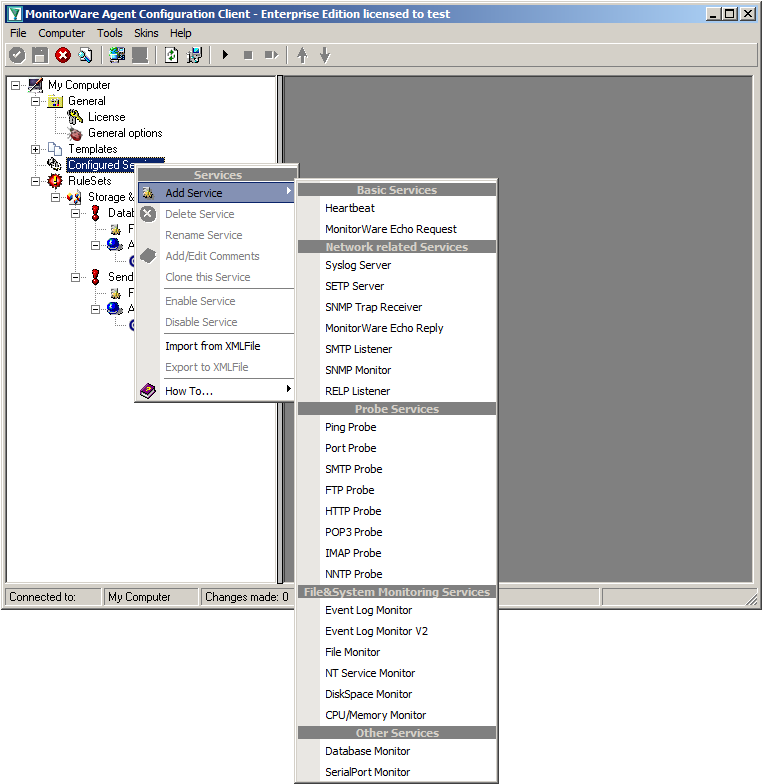
When right clicking on Configured Services a context-menu will open. By moving your cursor to “Add Service” you can see a list of Services, that may be configured. The list seems pretty long, but we basically need 3 services of them.
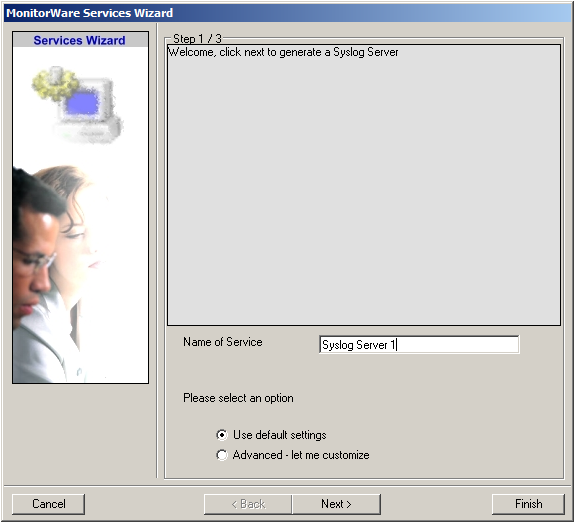
Click on “Syslog Server” first. The Services Wizard will open. Simply click on Finish for now. Repeat this again for Syslog Server, EventLogMonitor V2 and File Monitor.
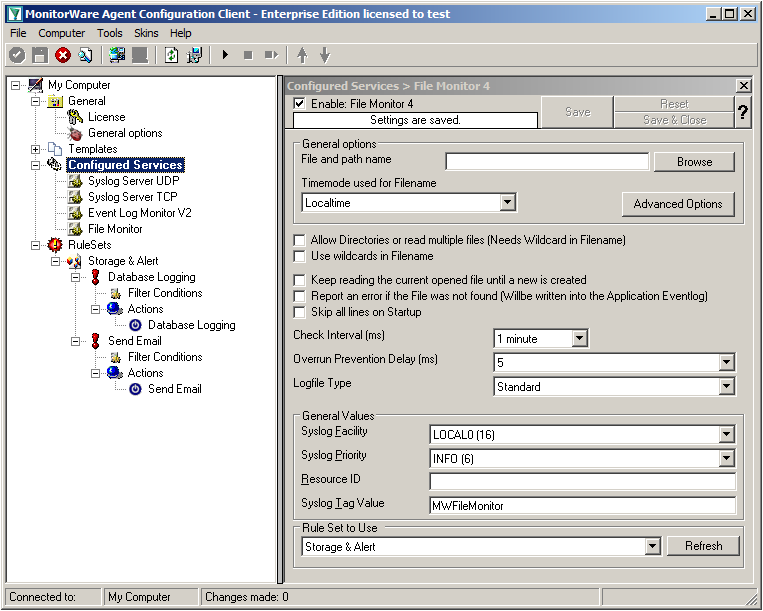
In the end, you should have a list with 4 Services. For our example I renamed the services by doing a right-click on the Service name I wanted to change and the choosing “Rename Service”. This was mostly to distinct the two Syslog Servers.
Settings for Syslog Server UDP
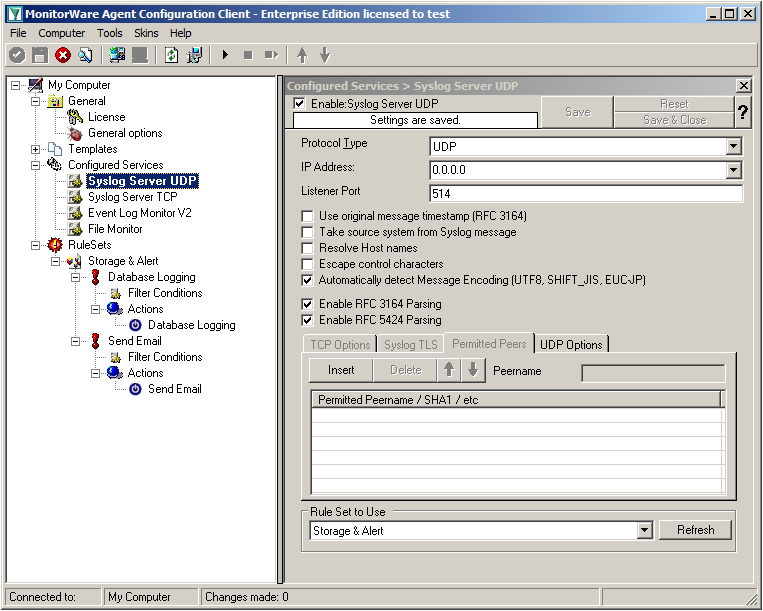
We can leave the “Syslog Server UDP” on default settings. It is already listening to UDP on port 514. The rest of the default settings is just fine.
Settings for Syslog Server TCP
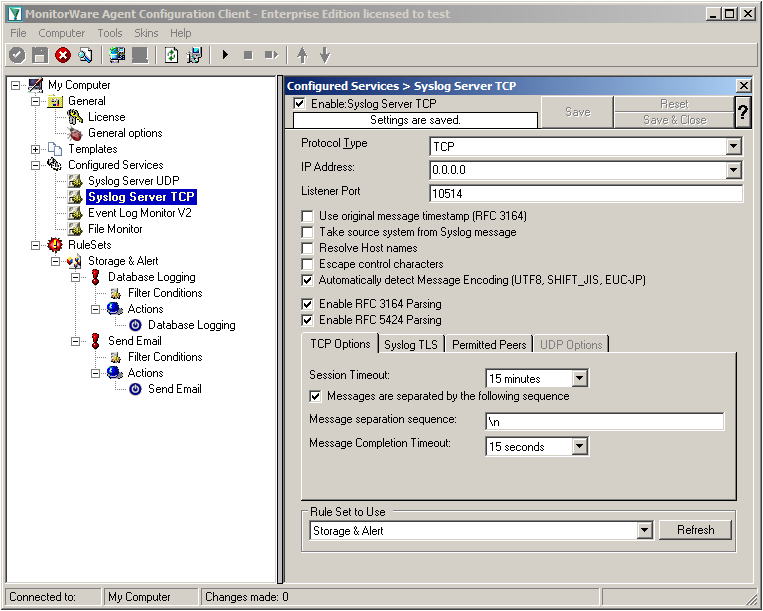
We will now go to the “Syslog Server TCP” now. Here we need to change several settings. Change the protocol type to TCP and the Listener Port to 10514. Further, we need to enable the option “Messages are separated by the following sequence” in the TCP options. It should look like this now:
Settings for Event Log Monitor V2
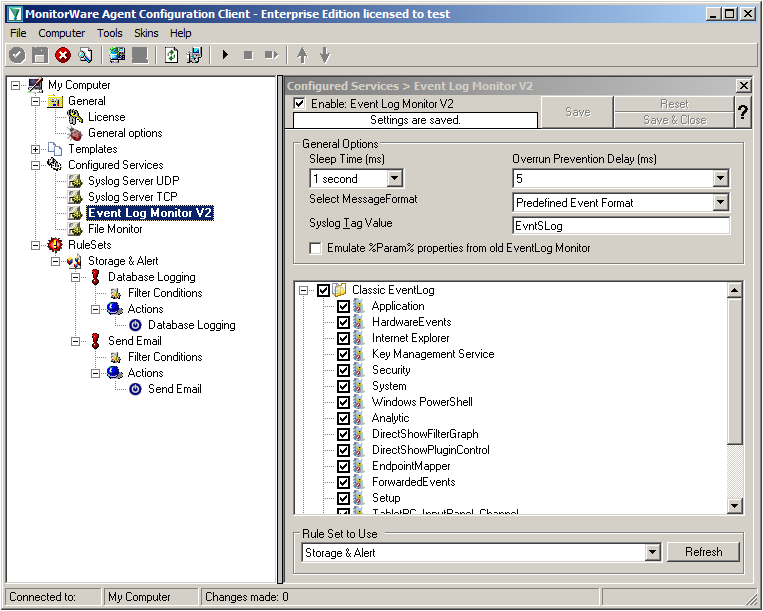
The Event Log Monitor V2 needs no additional setup. Again the default values are ok. If you want specific Event categories not to be stored, you can disable the options. But the basic format is sufficient.
Settings for File Monitor
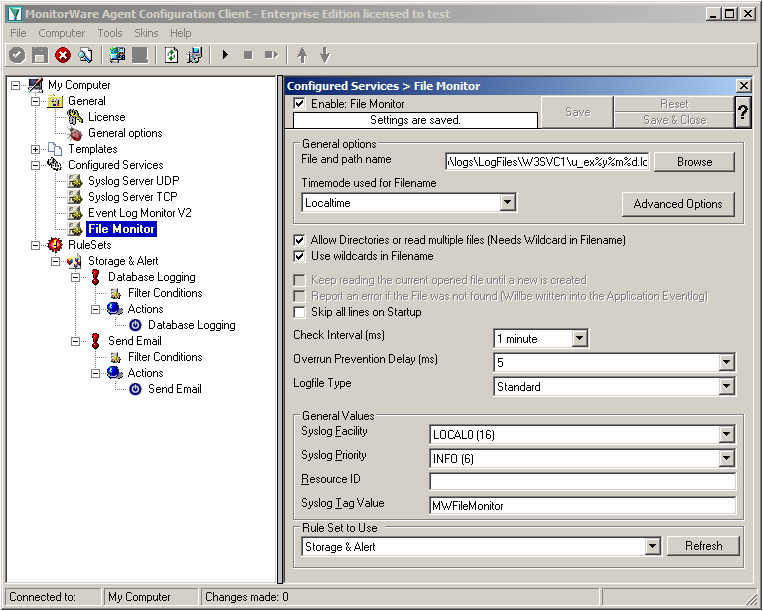
The File Monitor needs some additional settings. First, enable the option “Allow Directories or read multiple files”. You will see, that the use of wildcards will be automatically enabled and some other options completely being disabled.
Then we need to set the source files. For our example, we want to monitor the IIS logfiles. At the top of the File Monitor configuration you can see the option “File and path name”. There is a Browse button right next to it. Click it.
A windows explorer window will open, where you can choose the file you want to monitor. Navigate to the path C:\inetpub\logs\LogFiles\W3SVC1\. This is the location where the log files are stored. Please note, that the file location could be different when using another version of IIS. Choose the first file in the list. (Note: Daily Internet Information Server log files are named “u_exyymmdd.log”, with yy being the 2 digit year, mm the month and dd the day of month. To generate the same name with file monitor, use the following name “u_ex%y%m%d.log”.)
Set the Logfile Type to “W3C WebServer Logfile”.
Please note, that this step can be easily adapted for other log files (e.g. DHCP log files) as well.
We have now finished the configuration for our central server. It will now be able to receive syslog either via TCP (port 10514) or UDP (port 514), monitor the local Event Log as well as the IIS logfiles. Once more click the “Save” button to save the configuration (if not done already) and start the service. All log messages will now be stored into the database as they arrive/occur. Further, administrators will be alerted via email once an error occurs.
Created 2011-03-11 by Florian Riedl
This article will describe how to setup centralized logging in a hybrid environment. Basically, we will have various major steps, that show different configuration of several clients, which forward their log data to a central loghost. There, everything will be stored into a database and processed further for alerting.
To describe the situation basically, we want all machines on the network send their log data to a central syslog server (if possible). For the central log server we take a windows machine running MonitorWare Agent (www.mwagent.com). Here we can receive syslog, monitor local log files and the Windows EventLog. Data shall be stored into a database and several email alerts shall be configured. The other steps describe the configuration of simple Windows workstations and servers, as well as Linux servers.
For TCP transmission we will use port 514 (default) for UDP and port 10514 for TCP. We want to use TCP mainly, because it ensures the transmission of the syslog messages. This is due to UDP being connectionless and thus it can occur (and will) that messages get lost.
The Client machines in this example consist of several different types of machines. We have regular Windows Workstations. Here we will use EventReporter (www.eventreporter.com). In addition to our central server, we have some other Windows Servers which will get MonitorWare Agent as well and some Linux machines which have rsyslog (www.rsyslog.com) installed. These machines will send their log messages via TCP syslog to the central server.
Additionally to these clients, we will mention some other devices and appliances (just roughly), like firewalls, switches and routers.
This is the first and biggest step. We will configure the central server first. The reason is simple. If this is already running, we can setup the clients and it will directly start logging everything. We assume, this is a Windows Server where MonitorWare Agent is installed. The central log server shall provide the following functionality:
In step 2 we will set up the regular Windows clients. These are usually the workstations the people work on. We will use EventReporter here. It can pull all log messages from the Windows EventLog and forward them via TCP syslog. Thus the following functionality is mandatory:
Now we will configure the other Windows servers. Again, we will use MonitorWare Agent because it has the most functionality. We need the following functions to be setup here:
Now we get to the Linux servers. Here we need to use a completely different product – rsyslog. For a first-time user, this might look a bit strange. The configuration we want to have here needs the following:
This is rather just a note on other devices and appliances that are not yet covered. Often devices (like routers, firewalls or switches) have the possibility to send log data to a syslog server. Usually, this only works via UDP and some machines are even capable of sending logs via TCP. Since there is such a huge mass of different systems and devices, we cannot give correct steps for everything. Please refer to the user manual that came with the device or contact the manufacturer for information about how to configure the devices for sending syslog.
If you already know how to configure it, let it send it’s log messages to the central server on port 514 for UDP or (if possible) port 10514 for TCP.
We now have a setup that stores all the log data that machines on the network will generate to a central database for storage. Most of the clients on the network send their log data securely via TCP to the central log storage. Some machines were rather quick to set up, others needed more effort. Usually the effort rises with the amount of features that will be used. Thus we thought of this setup to be quite simple.
If you have any remarks or ideas of improvement for this guide, please let us know and send an email to info@adiscon.com.
Article created 2007-06-04 by Florian Riedl
Article created 2006-02-01 by Timm Herget.
You want to have an alternative syslog server for forwarding your e.g. PIX-syslog-messages, which automatically detects if the primary server is alive or not and if not he takes it’s roll until he is back? Here we go:
At first please make sure, that you have installed 2 MonitorWareAgent’s on 2 different machines and have configured the device which forwards syslog to them so, that it sends its data to both of them. Rainer Gerhards also wrote an Article about this, which you can read here.
Pre-Note: Make sure you press the “Save” button after every step – otherwise your changes will not be applied!
Step 1:
Create a ruleset on the primary server (machine 1), which contains a “Forward Syslog” action and has no filter conditions configured. Type in the central-server-name to which the logs should be forwarded and leave all other settings default:
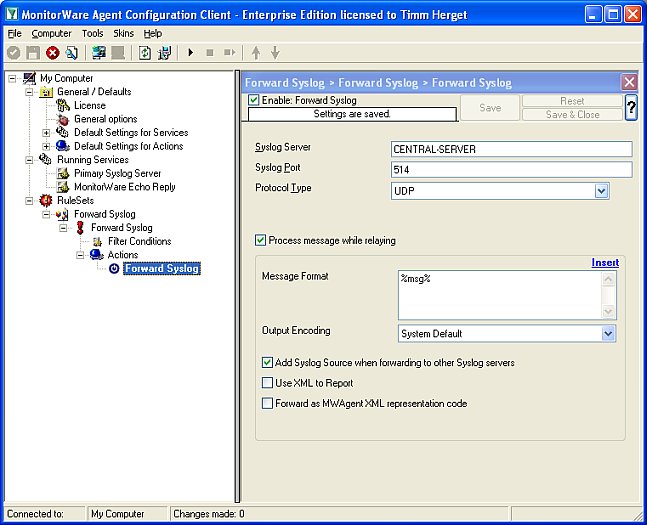
Figure1: creating the ruleset
Step 2:
Now create the primary syslog server service for which you have made the ruleset in step1 and bind it to the ruleset:
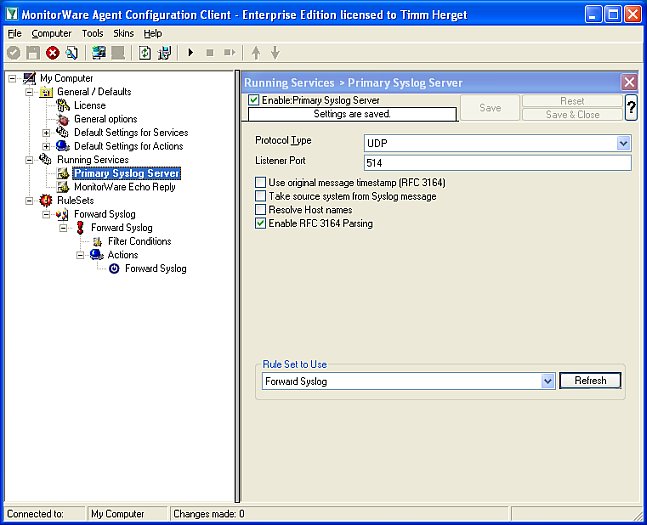
Figure2: creating the syslog server service Step 3:
At last we must create a “MonitorWare Echo Reply” service on the primary server, we will explain later for what:
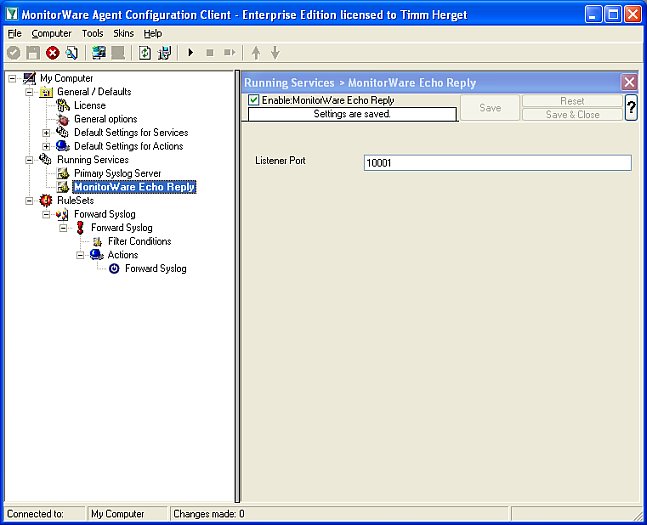
Figure3: creating the monitorware echo reply
Step 1:
Create a ruleset on the secondary server (machine 2), with 1 rule named “Echo Request Successful”. Create a “Set Status” Action in it, set the property name to “ServerActive” and the property value to “1” (without the quotes). We need this to clarify later if the primary-server is active or not and if it is, we set the variable serveractive to 1 which means true.

Figure1: creating the first rule
Step 2:
Now set a message contains filter inside this first rule’s filter conditions. Check the Message to contain: “MWEchoRequest success target“:

Figure2: filter conditions for first rule
Step 3:
We have to create the second rule into the above created echo-request-ruleset now. Again we need to configure a “Set Status” Action and set the property name to “ServerActive” and the property value to “0” now, for the case that the primary server is no longer active:

Figure3: creating the second rule
Step 4:
Again we have to set the filter settings for this case: Check the Message to contain: “MWEchoRequest fail target“:

Figure4: filter conditions for second rule
Step 5:
Now we must create the “MonitorWare Echo Request” service for which we have configured the rule set with its two rules above. Set the check interval to 5 seconds, check “Also generate an event if echo reply was successful” and press “Insert” button to insert a new machine to be requested. In “IP / Hostname” field, type in the ip/hostname of the primary server and let the port default “10001”, assign the service to the “Echo Request Rule” ruleset we created for it:

Figure5: configuring the MonitorWare echo request service
Step 6:
Now let us create a new Rule Set, not a 3rd rule in the ruleset we created for the echo request! Create a forward syslog action in it, type in the name of your CENTRAL-SERVER where the logs should be sent to after this is finished (not the primary server) and leave all other settings default:

Figure6: create rule forward-syslog
Step 7:
Check the filter conditions for the forward syslog ruleset now. Create a “Status Name and Value” filter by right-clicking on the AND, then “Add Filter” -> “General” -> “Status Name and Value”:

Figure7: creating the filters. part 1
Step 8:
Now we have to configure the newly created “Status Name and Value” filter by setting the property name to our global status variable we named “ServerActive”, the compare operation to “is equal” and the property value to “0” (for the case that the primary server is NOT active, because only then this server should do its job):

Figure8: creating the filters. part 2
Step 9:
Create the secondary syslog server service now, let all settings at default values and just assign it to the “Forward Syslog” ruleset:
Figure9: creating the secondary syslog server
Step 10:
The last thing we have to do is to start both MWAgent’s, the one on machine 1 (primary server) and the one on machine 2 (secondary server):

Figure10: start the 2 MWAgent’s
Downloads:
Here are sample configs for the primary and secondary server in *.reg file’s:
Article created 2006-02-01 by Rainer Gerhards.
For many organizations, syslog data is of vital importance. Some may even be required by law or other regulations to make sure that no log data is lost. The question is now, how can this be accomplished?
Let’s first look at the easy part: once the data has been received by the syslog server and stored to files (or a database), you can use “just the normal tools” to ensure that you have a good backup of them. This is pretty straight-forward technology. If you need to archive the data unaltered, you will probably write it to a write-once media like CD or DVD and archive that. If you need to keep your archive for a long time, you will probably make sure that the media persists sufficiently long enough. If in doubt, I recommend copying the data to some new media every now and then (e.g. every five years). Of course, it is always a good idea to keep vital data at least two different locations and on two different media sets. But again, all of this is pretty easy manageable.
We get down to a somewhat slippery ground when it comes to short term failure. Your backup will not protect you from a hard disk failure. OK, we can use RAID 5 (or any other fault-tolerance level) to guard against that. You can eventually even write an audit trail (comes for free with database written data, but needs to be configured and needs resources).
But what about a server failure? By the nature of syslog, any data that is not received is probably lost. Especially with UDP based (standard) syslog, the sender does not even know the receiver has died. Even with TCP based syslog many senders prefer to drop messages than to stall processing (the only other option left – think about it).
There are several ways to guard against such failures. The common denominator is that they all have some pros and cons and none is absolutely trouble-free. So plan ahead.
A very straightforward option is to have two separate syslog servers and make every device send messages to both of them. It is quite unlikely that both of the servers will go down at the same instant. Of course, you should make sure they are connected via separate network links, different switches and use differently fused power connections. If your organization is large, placing them at physically different places (different buildings) can also be beneficial, if the network bandwidth allows. This configuration is probably the safest to use. It can even guard you against the notorious UDP packet losses that standard syslog is prone to (and which happen unnoticed for most of the time). The backdraw of this configuration is that you have almost all messages at both locations. Only if a server fails (or a message is discarded by the network), you only have a single copy. So if you combine both event repositories to a central one, you will have lots of duplicates. The art of handling this is to find a good merge process, which correctly (correctly is a key word!) identifies duplicate lines and drops them. Identifying duplicates can be much harder than it initially sounds, but in most cases there is a good solution. Sometimes a bit sender tweaking is required, but after all, that’s what makes an admin happy…
The next solution is to use some clustering technology. For example, you can use the Windows cluster service to define two machines which act as a virtual single syslog server. The OS (Windows in this sample case) itself keeps track of which machine is up and which one is not. For syslog, an active-passive clustering schema is probably best, that is one where one machine is always in hot standby (aka: not used ;)). This machine only takes processing over when the primary one (the one usually active) fails. The OS handles the task of virtualizing the IP address and the storage system. It also controls the takeover of control from one syslog server software to the next. So this is very little hassle from the application point of view. Senders also send messages only once, resulting in half the network traffic. You also do not have to think about how to consolidate messages into a single repository. Of course, this luxury comes at a price: most importantly, you will not be guarded against dropped UDP packets (because there is only one receiver at one time). Probably more importantly, every “failover” logic has a little delay. So there will be a few seconds (up to maybe a minute or two) until the syslog server functionality has been carried over to the hot standby machine. During this period, messages will be lost. Finally, clustering is typically relatively expensive and hard to set up.
The third possible solution is to look at the syslog server application itself. My company offers WinSyslog and MonitorWare Agent which can be configured to work in a failover-like configuration. There, the syslog server detects failures and transfers control, just like in the clustering scenario. However, the operating system does not handle the failover itself and obviously the OS so does not need to be any special. This approach offers basically the same pros and cons as the OS clustering approach described above. However, it is somewhat less expensive and probably easier to configure. If the two syslog server machines need not to be dedicated, it can be greatly less expensive than clustering – because no additional hardware for the backup machine would be required. One drawback, however, is that the senders again need to be configured to send messages to both machine, thus doubling the network traffic compared to “real” clustering. However, syslog traffic bandwidth usage is typically no problem, so that should not be too much of a disadvantage.
Question now: how does it work? It’s quite easy! First of all, all senders are configured to send to both receivers simultaneously. The solution then depends on the receiver’s ability to see if its peer is still operational. If so, you define one active and one passive peer. The passive peer checks if the other one is alive (in short periods). If the passive detects that the primary one fails, it enabled message recording. Once it detects that the primary is up again, it disables message recording. With this approach, both syslog servers receive the message, but only one actually records them. The message files can than be merged for a nearly complete picture. Why nearly? Well, as with OS clustering, there is a time frame where the backup does not yet take over control, thus some messages may be lost. Furthermore, when the primary node comes up again, there is another small Window where both of the machines record messages, thus resulting in duplicates (this later problem is not seen with typical OS clustering). So this is not a perfect world, but pretty close to it – depending on your needs. If you are interested in how this is actually done, you can follow our step-by-step instructions for our product line. Similar methodologies might apply to other products, but for obvious reasons I have not researched that. Have a look yourself after you are inspired by the Adiscon sample.
What is the conclusion? There is no perfect way to handling syslog server failure. Probably the best solution is to run two syslog servers in parallel, the first solution I described. But depending on your needs, one of the others might be a better choice for what you try to accomplish. I have given pros and cons with each of them, hopefully this will help you judge what works best for you.
Article created 2006-02-01 by Timm Herget.
You want to have an alternative syslog server for forwarding your e.g. PIX-syslog-messages, which automatically detects if the primary server is alive or not and if not he takes it’s roll until he is back? Here we go:
At first please make sure, that you have installed 2 MonitorWareAgent’s on 2 different machines and have configured the device which forwards syslog to them so, that it sends its data to both of them. Rainer Gerhards also wrote an Article about this, which you can read here.
Pre-Note: Make sure you press the “Save” button after every step – otherwise your changes will not be applied!
Step 1:
Create a ruleset on the primary server (machine 1), which contains a “Forward Syslog” action and has no filter conditions configured. Type in the central-server-name to which the logs should be forwarded and leave all other settings default:

Figure1: creating the ruleset
Step 2:
Now create the primary syslog server service for which you have made the ruleset in step1 and bind it to the ruleset:

Figure2: creating the syslog server service Step 3:
At last we must create a “MonitorWare Echo Reply” service on the primary server, we will explain later for what:

Figure3: creating the monitorware echo reply
Step 1:
Create a ruleset on the secondary server (machine 2), with 1 rule named “Echo Request Successful”. Create a “Set Status” Action in it, set the property name to “ServerActive” and the property value to “1” (without the quotes). We need this to clarify later if the primary-server is active or not and if it is, we set the variable serveractive to 1 which means true.

Figure1: creating the first rule
Step 2:
Now set a message contains filter inside this first rule’s filter conditions. Check the Message to contain: “MWEchoRequest success target“:

Figure2: filter conditions for first rule
Step 3:
We have to create the second rule into the above created echo-request-ruleset now. Again we need to configure a “Set Status” Action and set the property name to “ServerActive” and the property value to “0” now, for the case that the primary server is no longer active:

Figure3: creating the second rule
Step 4:
Again we have to set the filter settings for this case: Check the Message to contain: “MWEchoRequest fail target“:

Figure4: filter conditions for second rule
Step 5:
Now we must create the “MonitorWare Echo Request” service for which we have configured the rule set with its two rules above. Set the check interval to 5 seconds, check “Also generate an event if echo reply was successful” and press “Insert” button to insert a new machine to be requested. In “IP / Hostname” field, type in the ip/hostname of the primary server and let the port default “10001”, assign the service to the “Echo Request Rule” ruleset we created for it:

Figure5: configuring the MonitorWare echo request service
Step 6:
Now let us create a new Rule Set, not a 3rd rule in the ruleset we created for the echo request! Create a forward syslog action in it, type in the name of your CENTRAL-SERVER where the logs should be sent to after this is finished (not the primary server) and leave all other settings default:

Figure6: create rule forward-syslog
Step 7:
Check the filter conditions for the forward syslog ruleset now. Create a “Status Name and Value” filter by right-clicking on the AND, then “Add Filter” -> “General” -> “Status Name and Value”:

Figure7: creating the filters. part 1
Step 8:
Now we have to configure the newly created “Status Name and Value” filter by setting the property name to our global status variable we named “ServerActive”, the compare operation to “is equal” and the property value to “0” (for the case that the primary server is NOT active, because only then this server should do its job):

Figure8: creating the filters. part 2
Step 9:
Create the secondary syslog server service now, let all settings at default values and just assign it to the “Forward Syslog” ruleset:

Figure9: creating the secondary syslog server
Step 10:
The last thing we have to do is to start both MWAgent’s, the one on machine 1 (primary server) and the one on machine 2 (secondary server):

Figure10: start the 2 MWAgent’s
Downloads:
Here are sample configs for the primary and secondary server in *.reg file’s:
Article created 2003-04-30 by Rainer Gerhards.
Last Updated 2005-08-16 by Timm Herget.
In this scenario, an event log monitor is used to forward all events written to the NT Event Log to a syslog server. This can either be another instance of MonitorWare or any standard syslog server, for example on a UNIX platform. The data will be forwarded in the EventReporter compatible format, as the processes running on the syslog server require that format (this is just an assumption).
This is a scenario often used together with UNIX based management solutions. The event log monitor is used here to forward events into a central repository, where it will be analyzed using pre-existing procedures.
Please note that if the data is to be forwarded to another instance of a MonitorWare Agent, we highly recommend using the SETP protocol instead of syslog – but this is beyond the scope of this scenario here.
The rule set specifies what action to carry out. You might be tempted to define the service first, but starting with the rule set makes things easier as it already is present when the service will be defined later and needs to be bound to a rule set.
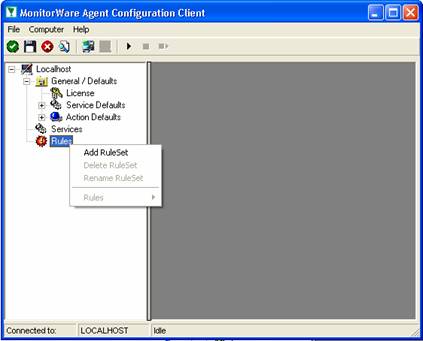
To define a new rule set, right click “Rules”. A pop up menu will appear. Select “Add Rule Set” from this menu. On screen, it looks as follows:
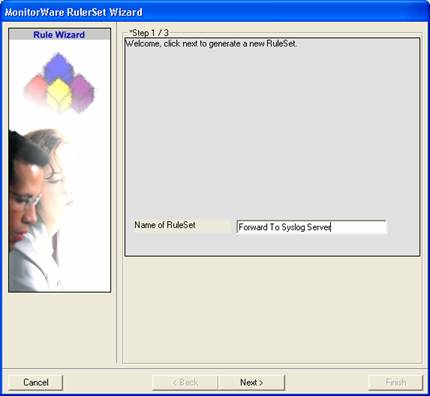
Then, a wizard starts. Change the name of the rule set to whatever name you like. We will use “Forward To Syslog Server” in this example. The screen looks as follows:
Click “Next”. A new wizard page appears:

There, select “Forward Syslog”. Do not select any other options for this sample. Also, leave the “Create a Rule for each of the following actions” setting selected. Click “Next”.
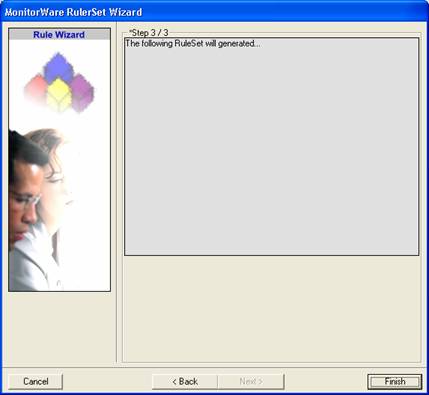
This is just a confirmation page. Click “Finish” to create the rule set.
The wizard closes and the client shows a newly created rule set.
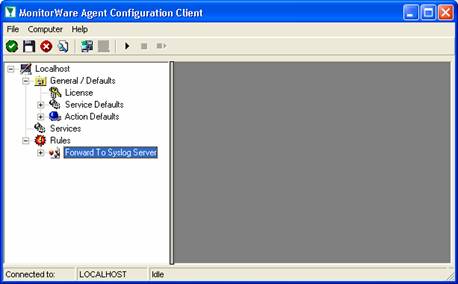
As you can see, the “Forward To Syslog Server” rule set is now present. Please expand it in the tree view until you have the following screen contents:
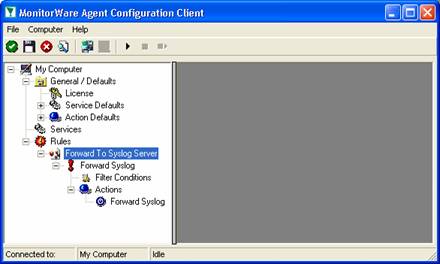
As you can see, we have a “Forward Syslog” action configured. We will review the settings just for your information. Click on “Filter Conditions”:
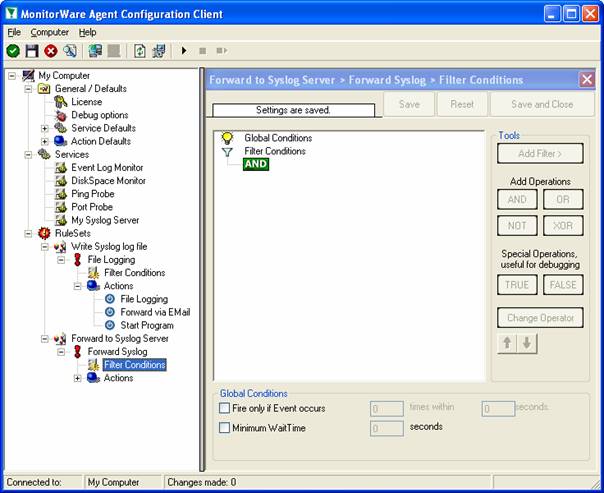
As you can see, no filter conditions are selected. This means that the all information units (the event log information) will be matched by these filter conditions. As such, the rules for the “Forward Syslog” action will always be carried out.
Now let us check the “Forward Syslog” action itself. Please select it in the tree view:
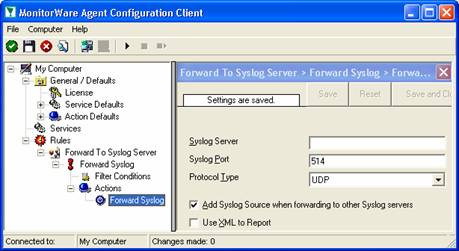
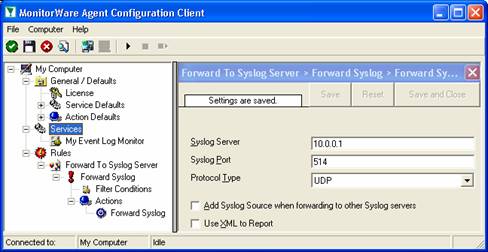
As you can see, some useful defaults are already there. It forwards syslog messages via the standard UDP protocol to the standard port of 514. These values are specified by the syslog standard and most syslog servers will expect them. Only change them if you definitely know that the syslog server is configured to use other values. If in doubt, use the default ones.
However, there are also some things that need to be completed and changed for this scenario.
Obviously, the syslog server to receive the message needs to be specified. You can use either a system name or IP address. In our sample, we will use the IP address, because this is faster and more reliable as it does not depend on DNS name resolution. Our target syslog server is on address 10.0.0.1.
Next, we will uncheck the “Add Syslog Source when forwarding…” options. This option is useful when messages are to be forwarded to the WinSyslog Interactive Syslog Server for instant review. If forwarded to a “real” syslog server, it typically is not useful and might influence the receiving syslog server’s capability to correctly check the message contents.
The “Use XML to Report” option is left unchecked because in this scenario there are pre-existing scripts on the syslog server that expect EventReporter legacy format. The XML option is not compatible with that format.
After the changes, the dialog looks as follows:
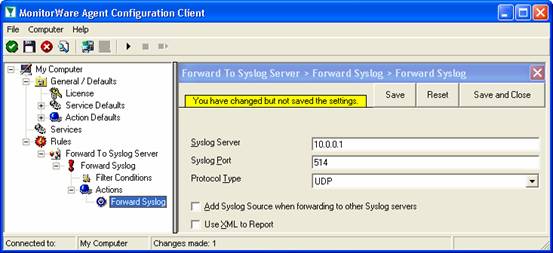
After doing so, you will notice the yellow text on top of the window. It tells you that the configuration changes have not yet been applied. To do so, press “save”.
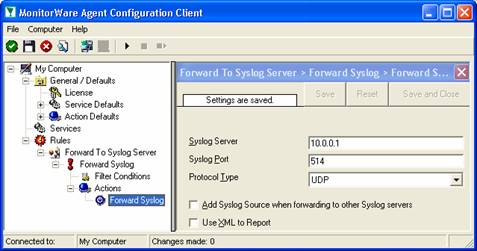
Now you have a workable rule set for forwarding event monitor data to the syslog server.
Now we need to define an “event log monitor” service. It is the process that monitors the Windows event log for new entries and creates information units as soon as a new entry is found. These information units are then passed to the rule set which in turn forwards them to the syslog server configured in step 1.
To define the event log monitor, right click on “Services”, then select “Add Service” and the “Event Log Monitor”:
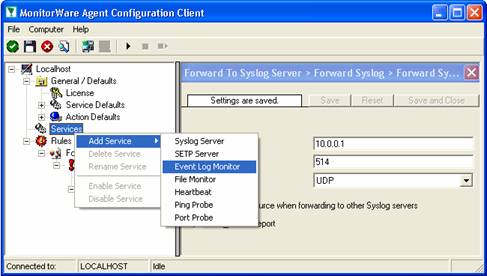
Once you have done so, a new wizard starts:
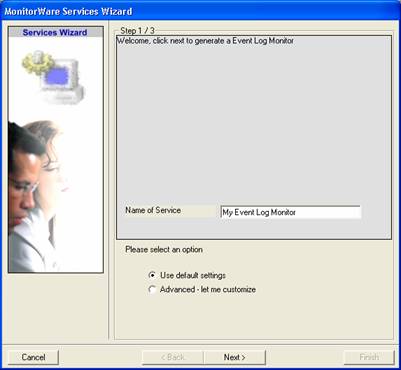
Again, you can use either the default name or any one you like. We will use “My Event Log Monitor” in this sample. Leave the “Use default settings” selected and press “Next”:
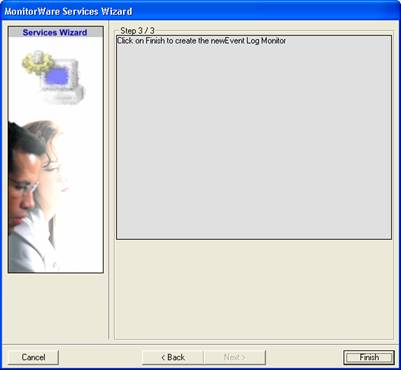
As we have used the default, the wizard will immediately proceed with step 3, the confirmation page. Press “Finish” to create the service. The wizard completes and returns to the configuration client. There, you will see the newly created service beneath the “Services” part of the tree view:
To check its parameters, select it:
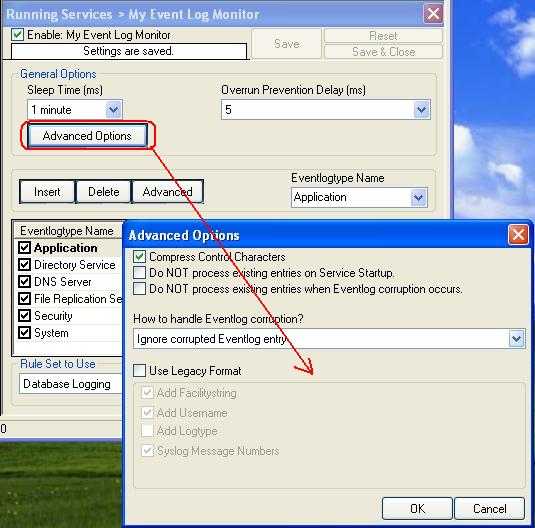
As you can see, the service has been created with the default parameters. As such, it monitors all event logs that are present on the system. It also has some protection against overruns of the receiving system or intermediary routers. It monitors the event log in a 60 second interval (sleep time of 60.000 milliseconds), which is the recommended value for typical installations.
Please note that the “Forward To Syslog Server” rule set has been automatically assigned as the rule set to use. This is the case because we already created it and it is the only rule set. By default, the wizard will always assign the first rule set visible in the tree view to new services. If that is not the intended rule set, you need to change it to the correct one here in the service definition.
Also, please note that the wizard uses the default properties from the “Service Defaults”. Obviously, if these are changed, the default properties for new services will differ.
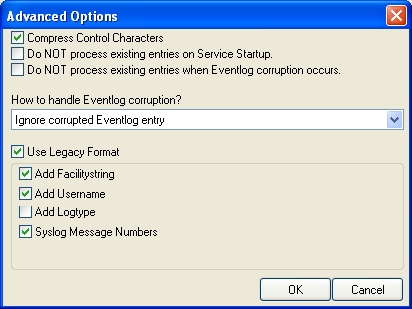
There is one change we need to make to the service properties: that is the “Use Legacy Format” option. As specified in the scenario, some pre-existing scripts at the syslog server expect the EventReporter legacy format. As such, we need to check that option:
Finally, we review the log specific advanced properties. As a sample, we will go over the application log advanced properties. To do so, click the “Advanced” button:
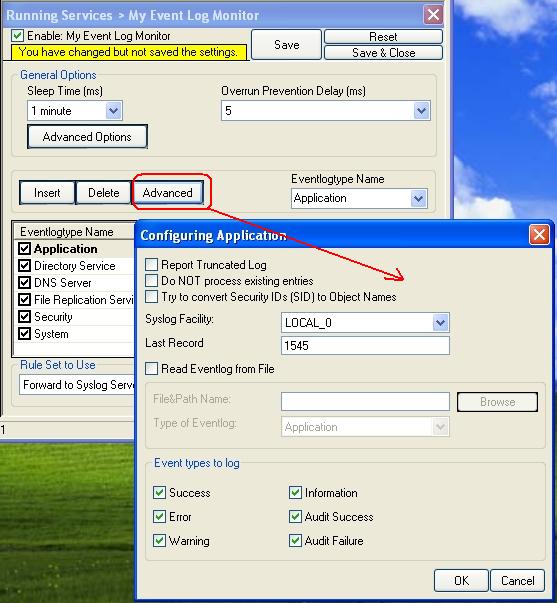
Most importantly, we can select the syslog facility that is to be used for the generated information units here. In our sample, we leave it as local. We also leave the “Report Truncated Log” option checked. This option will generate a warning message if the respective Windows log is truncated, for example by operator request. If that happens during day-to-day operations in you environment, you might want to uncheck it.
Click OK to return to the main property sheet.
This procedure completes the configuration of the event log monitor.
MonitorWare Agent cannot dynamically read changed configurations. As such, it needs to be restarted after such changes. In our sample, the service was not yet started, so we simply need to start it. If it already runs, you need to restart it.
Service control can be done with both the respective operating system capabilities (like service manager MMC) or with the configuration client. These are shown in the red surrounded area in the following screen shot:
The buttons resemble Windows service manager – start, stop and restart. In this sample, stop and restart are grayed out because the service is not running.
After service restarts, the new definitions are active and MonitorWare Agent will forward all events from the Windows event log to the configured syslog server. Please note that on the first run, all already existing events will be forwarded. Therefore, this might take a little while. On all successive service start, only new events will be forwarded.
Article created 2003-04-30 by Rainer Gerhards.
Last Updated 2005-08-16 by Timm Herget.
In this scenario, an event log monitor is used to forward all events written to the NT Event Log to a syslog server. This can either be another instance of MonitorWare or any standard syslog server, for example on a UNIX platform. The data will be forwarded in the EventReporter compatible format, as the processes running on the syslog server require that format (this is just an assumption).
This is a scenario often used together with UNIX based management solutions. The event log monitor is used here to forward events into a central repository, where it will be analyzed using pre-existing procedures.
Please note that if the data is to be forwarded to another instance of a MonitorWare Agent, we highly recommend using the SETP protocol instead of syslog – but this is beyond the scope of this scenario here.
The rule set specifies what action to carry out. You might be tempted to define the service first, but starting with the rule set makes things easier as it already is present when the service will be defined later and needs to be bound to a rule set.
To define a new rule set, right click “Rules”. A pop up menu will appear. Select “Add Rule Set” from this menu. On screen, it looks as follows:

Then, a wizard starts. Change the name of the rule set to whatever name you like. We will use “Forward To Syslog Server” in this example. The screen looks as follows:

Click “Next”. A new wizard page appears:
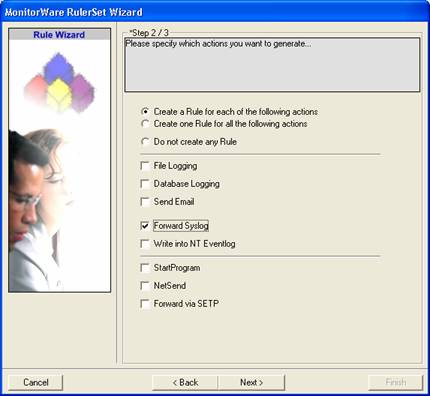
There, select “Forward Syslog”. Do not select any other options for this sample. Also, leave the “Create a Rule for each of the following actions” setting selected. Click “Next”.

This is just a confirmation page. Click “Finish” to create the rule set.
The wizard closes and the client shows a newly created rule set.

As you can see, the “Forward To Syslog Server” rule set is now present. Please expand it in the tree view until you have the following screen contents:

As you can see, we have a “Forward Syslog” action configured. We will review the settings just for your information. Click on “Filter Conditions”:

As you can see, no filter conditions are selected. This means that the all information units (the event log information) will be matched by these filter conditions. As such, the rules for the “Forward Syslog” action will always be carried out.
Now let us check the “Forward Syslog” action itself. Please select it in the tree view:

As you can see, some useful defaults are already there. It forwards syslog messages via the standard UDP protocol to the standard port of 514. These values are specified by the syslog standard and most syslog servers will expect them. Only change them if you definitely know that the syslog server is configured to use other values. If in doubt, use the default ones.
However, there are also some things that need to be completed and changed for this scenario.
Obviously, the syslog server to receive the message needs to be specified. You can use either a system name or IP address. In our sample, we will use the IP address, because this is faster and more reliable as it does not depend on DNS name resolution. Our target syslog server is on address 10.0.0.1.
Next, we will uncheck the “Add Syslog Source when forwarding…” options. This option is useful when messages are to be forwarded to the WinSyslog Interactive Syslog Server for instant review. If forwarded to a “real” syslog server, it typically is not useful and might influence the receiving syslog server’s capability to correctly check the message contents.
The “Use XML to Report” option is left unchecked because in this scenario there are pre-existing scripts on the syslog server that expect EventReporter legacy format. The XML option is not compatible with that format.
After the changes, the dialog looks as follows:

After doing so, you will notice the yellow text on top of the window. It tells you that the configuration changes have not yet been applied. To do so, press “save”.

Now you have a workable rule set for forwarding event monitor data to the syslog server.
Now we need to define an “event log monitor” service. It is the process that monitors the Windows event log for new entries and creates information units as soon as a new entry is found. These information units are then passed to the rule set which in turn forwards them to the syslog server configured in step 1.
To define the event log monitor, right click on “Services”, then select “Add Service” and the “Event Log Monitor”:

Once you have done so, a new wizard starts:

Again, you can use either the default name or any one you like. We will use “My Event Log Monitor” in this sample. Leave the “Use default settings” selected and press “Next”:

As we have used the default, the wizard will immediately proceed with step 3, the confirmation page. Press “Finish” to create the service. The wizard completes and returns to the configuration client. There, you will see the newly created service beneath the “Services” part of the tree view:

To check its parameters, select it:

As you can see, the service has been created with the default parameters. As such, it monitors all event logs that are present on the system. It also has some protection against overruns of the receiving system or intermediary routers. It monitors the event log in a 60 second interval (sleep time of 60.000 milliseconds), which is the recommended value for typical installations.
Please note that the “Forward To Syslog Server” rule set has been automatically assigned as the rule set to use. This is the case because we already created it and it is the only rule set. By default, the wizard will always assign the first rule set visible in the tree view to new services. If that is not the intended rule set, you need to change it to the correct one here in the service definition.
Also, please note that the wizard uses the default properties from the “Service Defaults”. Obviously, if these are changed, the default properties for new services will differ.
There is one change we need to make to the service properties: that is the “Use Legacy Format” option. As specified in the scenario, some pre-existing scripts at the syslog server expect the EventReporter legacy format. As such, we need to check that option:

Finally, we review the log specific advanced properties. As a sample, we will go over the application log advanced properties. To do so, click the “Advanced” button:

Most importantly, we can select the syslog facility that is to be used for the generated information units here. In our sample, we leave it as local. We also leave the “Report Truncated Log” option checked. This option will generate a warning message if the respective Windows log is truncated, for example by operator request. If that happens during day-to-day operations in you environment, you might want to uncheck it.
Click OK to return to the main property sheet.
This procedure completes the configuration of the event log monitor.
MonitorWare Agent cannot dynamically read changed configurations. As such, it needs to be restarted after such changes. In our sample, the service was not yet started, so we simply need to start it. If it already runs, you need to restart it.
Service control can be done with both the respective operating system capabilities (like service manager MMC) or with the configuration client. These are shown in the red surrounded area in the following screen shot:
The buttons resemble Windows service manager – start, stop and restart. In this sample, stop and restart are grayed out because the service is not running.
After service restarts, the new definitions are active and MonitorWare Agent will forward all events from the Windows event log to the configured syslog server. Please note that on the first run, all already existing events will be forwarded. Therefore, this might take a little while. On all successive service start, only new events will be forwarded.
Article created 2005-05-17 by Hamid Ali Raja.
In this scenario, a simple Syslog server will be created. No other services are configured. The Syslog server will operate as a standard Syslog server on the default port of 514/UDP. All incoming data will be written to a single text file.
The rule set specifies what action to carry out. You might be tempted to define the service first, but starting with the rule set makes things easier as it will be already present when the service is defined later and needs to be bound to a rule set.
To define a new rule set, right click “Rules”. A pop up menu will appear. Select “Add Rule Set” from this menu. On screen, it looks as follows:

Then,a wizard starts. Change the name of the rule set to whatever name you like. We will use “Write Syslog Log File” in this example. The screen looks as follows:

Click”Next”. A new wizard page appears:

There,select file logging. Do not select any other options for this example. Also, leave the “Create a Rule for each of the following actions” setting selected. Click “Next”.

This is just a confirmation page. Click “Finish” to create the rule set.
The wizard closes and the client shows a newly created rule set.

As you can see, the “Write Syslog Log File” rule set is now present. Please expand it in the tree view until you have the following screen contents:

As you can see, we have a “File Logging” action configured. We will review the settings just for your information. Click on “Filter Conditions”:

As you can see, none of the filter conditions are enabled. This means that the all information units (incoming messages) will be matched by these filter conditions. As such, the rules for the “File Logging” action will always be carried out.
Please note that this also means that all Syslog priorities and facilities will be written to the same file.
Now let us check the “File Logging” action itself. Please select it in the tree view:

As you can see, it has been created with the default parameters. Each day, a file will be created in the C:\temp directory and its base name will be MonitorWare. It will include all information items in the file.
If you would like to store it into a separate directory or change the file name, here is the place to do it. Important: please make sure the directory you specify exists! If it does not yet exist, please create it before you start the service. If the directory does not exist, the service is not able to store any files.
In our example, we would like to save it to “c:\logfiles” with a base name of “Syslog”. Therefore, we change these properties:

After doing so, you will notice the yellow text on top of the window. It tells you that the configuration changes have not yet been applied. To do so, press “save”.
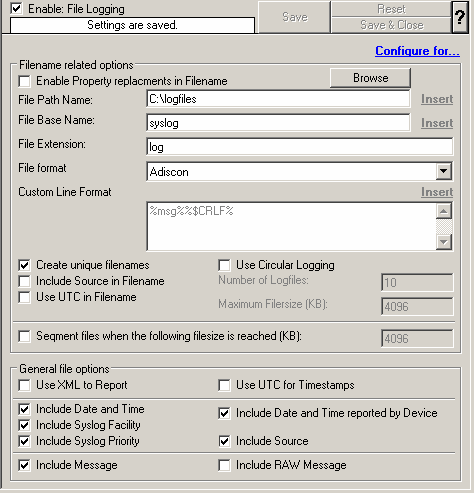
Now you have a workable rule set for logging incoming messages to a text file.
Now we need to define a Syslog server service. A Syslog server is also sometimes called a “Syslog daemon”, “Syslogd” or “Syslog listener”. It is the process that receives incoming messages.
To define it, right click on “Services”, then select “Add Service” and the “Syslog Server”:

Once you have done so, a new wizard starts:

Again, you can use either the default name or any one you like. We will use “My Syslog Server” in this example. Leave the “Use default settings” selected and press “Next”:

As we have used the default, the wizard will immediately proceed with step 3, the confirmation page. Press “Finish” to create the service. The wizard completes and returns to the configuration client. There, you will see the newly created service beneath the “Services” part of the tree view:
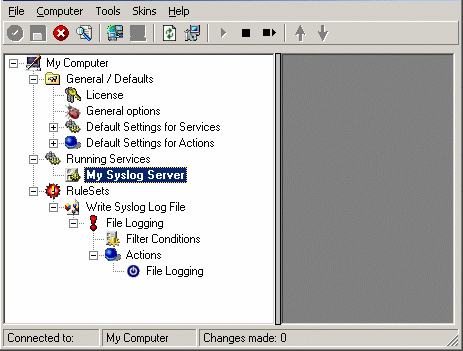
To check its parameters, select it:
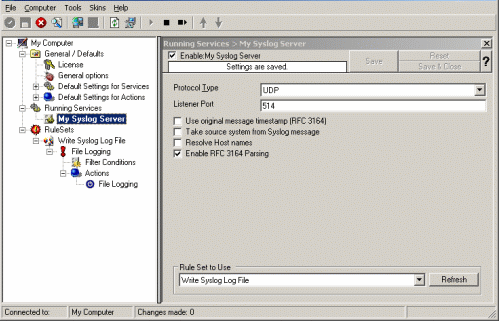
As you can see, the service has been created with the default parameters. As such, it operates as a RFC compliant standard Syslog server.
Please note that the “Write Syslog Log File” has been automatically assigned as the rule set to use. This is the case because we already created it and it is the only rule set. By default, the wizard will always assign the first rule set visible in the tree view to new services. If another one is to be used, you need to change it to the correct one here in the service definition.
Also, note that the wizard uses the default properties from the “Service Defaults”. Obviously, if these are changed, the default properties for new services will differ.
This procedure completes the configuration of the Syslog server.
Application cannot dynamically read changed configurations. As such, it needs to be restarted after such changes. In our example, the service was not yet started, so we simply need to start it. If it’s already running, you need to restart it.
Service control can be done with both the respective operating system capabilities (like service manager MMC) or with the configuration client. These are shown in the red surrounded area in the following screen shot:

The buttons resemble Windows service manager – start, stop and restart. In this example, stop and restart are grayed out because the service is not running.
After service restart, the new definitions are active and application is ready to accept and store incoming messages.
Even though application is now ready, it can only receive messages if some devices send them. Remember, Syslog is a protocol where the server is passively waiting for incoming messages. As long as no device sends message, the Syslog server will not log anything.
Since there are a large variety of devices, we unfortunately cannot provide device specific instructions. However, almost all devices need to be configured with their specific configuration tool. Typically, only two settings need to be made: one to activate Syslog messages at all and one with the Syslog server IP address or name.
For some devices, we have step-by-step guides. Please read “Sample Syslog Device Configurations” for further details.
Remember: the computer running application now acts as a Syslog server. As such, you need to find out its IP address or name and supply it to the device as the Syslog server. Please note that not all devices can operate with computer names. Use the IP address, if in doubt.