2017-03-27 MonitorWare Agent 11.1 released

Adiscon is proud to announce the 11.1 release of MonitorWare Agent.

MonitorWare Agent is now able to reload it’s configuration automatically if enabled (Which is done by the configuration client automatically on first start). It is not necessary to restart the service manually anymore.

Also there have been significant enhancements in the SNMP Trap Receiver handling SNMPv1 and new compressed output format.

Performance enhancing options have been added into EventLog Monitor V1 and V2 and in File Monitor to delay writing the last record/fileposition back to disk. This can incease performance on machines with a very high eventlog or file load.

Detailed information can be found in the version history.

Version 11.1 is a free download. Customers with existing 10.x keys can contact our Sales department for upgrade prices. If you have a valid Upgrade Insurance ID, you can request a free new key by sending your Upgrade Insurance ID to sales@adiscon.com. Please note that the download enables the free 30-day trial version if used without a key – so you can right now go ahead and evaluate it.

MonitorWare Agent 11.1 Released (Build-IDs: Service 11.1.0.494, Client 11.1.0.1576)

MonitorWare Agent 11.1 Released

Build-IDs: Service 11.1.0.494, Client 11.1.0.1576

Features

  • Updated to OpenSSL 1.0.2k.
  • Configuration Reload: This is a big new core feature allowing the
    service to reload itself automatically after a configuration changed has
    been detected. The feature can be turned off in General-General Options if
    this new behavior is not wanted. By default auto reload will be enabled.
    The latest Configuration Client is required for the feature to fully work.
  • SNMP Receiver: Added new compressed output format for message property.
  • EventLog Monitor V2: Added new options to delay LastRecord save.
    Enabling this option will improve processing performance of machines with
    a high event volume.
  • EventLog Monitor V1: Added new option to delay LastRecord save. Enabling
    this option will improve processing performance of machines with a high
    event volume.
  • File Monitor: Added new option to delay LastFilePosition save. Enabling
    this option will improve processing performance when processing large
    growing files.
  • FileConfig: Changed datafile saving method, more reliable when the
    service is stopped unintentionally while updating data state files.
  • Send SNMP action: Added new variable for SNMPv1 AgentIP field. By
    default the property will be set to %source%.
  • Send Syslog Action: Added new option to enable/disable UTF8 BOM. Default
    is enabled like before, but it can be disabled now by configuration so the
    message won’t contain the UTF8 BOM.

Bugfixes

  • Property Engine: Fixed SystemID and CustomerID properties.
  • FileConfig: Due a missing property (FilterVersion), some of the global
    conditions in rule filters could not be used. This automatically fixes
    itself next time the configuration is saved with the Client.
  • Debug Logging: Completely rewritten debug output for Rule Engine
    (Filters) for better readability and analysis.
  • Fixed an compatibility issue on Windows 2003/XP (failed to start because
    WSAPoll API is missing).
  • FileConfig: Fixed an issue with invalid linefeeds when using includefile
    directive.
  • FileConfig: Fixed EnumRegkey emulation causing EventLog Monitor Services
    to load invalid eventlog channels.
  • Debug Logging: Moved RELP Debugging from minimal to internal
  • FileMonitor: Fixed issue rewriting filepointer updates each time when
    wildcards support was enabled.
  • SNMP Trap Receiver: Fixed handling of SNMPv1 Enterprise traps. All
    properties are now properly set.
  • SNMP Trap Receiver: Fixed shutdown of Service causing a problem when
    reloading configuration.

You can download Free Trial Version of MonitorWare Agent.

MonitorWare Agent 10.2 Released (Build-IDs: Service 10.2.466, Client 10.2.0.1559)

MonitorWare Agent 10.2 Released

Build-IDs: Service 10.2.466, Client 10.2.0.1559

Features

  • Components:
    • Updated NET-SNMP 5.6.2.1 and OpenSSL 1.0.2e.
  • Engine:
    • Enabled support to parse MIBs with labels that contain underscores.
    • When using TLS Mode x509/Name, permitted peers will also checked against the certificate Subject Alternative Name (SAN) now.
  • DB Monitor:
    • Added option “Write LastDBIndex at frequent intervals” to support saving the LastDBIndex while processing data records. By default the LastIDIndex is only written after all database records have been processed. LastDBIndex can now be a 64Bit number (Was limited to 32Bit before).
  • EventLog Monitor V2:
    • Added new Option “Wait time after action failure” which specifies the wait time after an action error occurred. Without the wait time, the subscription would immediately hit again. It is most likely that the action failure was caused by network problems, so a wait time of (default value) 15 seconds is a reasonable default.
  • File Monitor:
    • Added regular expressions support for Message Separators. Also added Options to prepend or append message separators to the message.  When using regex message separators, it might be necessary to include the message separator into the message.
  • Syslog Action:
    • Added wait time doubling option for the Diskqueue feature. When enabled, the configured wait time will be doubled until the doubling limit is reached.
    • Added random wait time delay option for the Diskqueue feature. When enabled, a random wait time (up to the configured maximum) will be added to the configured wait time.
    • Added Overrun prevention delay option for the Diskqueue feature. When enabled, the action will sleep for the configured delay between each syslog message.
  • Services TestMode:
    • Added a testmode for Services, currently EventLog Monitor V1 & V2 and File Monitor are supported. When enabling the testmode for a certain service, it will process it’s Events/Files over and over again. So only use this setting for testing purpose.
  • File Based Configuration:
    • Added support for file includes. The feature can be enabled by setting one or both options in the Client Options called “Create individual configuration files for Services” and “Create individual configuration files for RuleSets”. When enabled, the configuration client will split Services and/or Rulesets into separated files. The main configuration file will include these files by a pattern. The Service itself is able to read includes within includes up to a depth level to 10. When using custom (hand written) configuration with includes, the configuration client will only be able to read them. However the client will not be able to maintain (Save) the custom configuration structure.
  • Command line:
    • Added handler for CTRL+C when running the Service in console mode

Bugfixes

  • EventLog Monitor V2:
    • When using the subscription method (Default), Events could get lost when an action failed to process. Action error handling has been corrected now and works similar like in EventLog Monitor V1.
  • DB Monitor:
    • Fixed loading/saving LastDBIndex value when Service runs in fileconfig mode.
  • Syslog Server:
    • Fixed a problem receiving RFC3195RAW messages.
    • Fixed message timeout handling when no message separator was enabled in Syslog TCP mode.
  • File Action:
    • When using Custom Format, a trailing NULL Byte was written into the file. This was considered a bug, so the NULL Byte is not written anymore.
  • Syslog Action:
    • Fixed an issue when diskqueue files were corrupt. Now corrupted entries are skipped properly.
    • In some cases when the Action was in diskqueue mode, it could happen that the internal retry failed. Cached syslog messages wouldn’t be sent until the service restart.
  • SSL/TLS:
    • Actions with support for SSL/TLS (like Send Syslog Action) could fail to send messages if the recipient closed the connection during meantime. The handling of closed connections has been hardened now when TLS/SSL is enabled.
  • Command line:
    • Fixed handling when using more than one command line option
  • File Based Configuration:
    • Fixed a bug reading general options from File configuration.
    • Fixed an issue reading and writing into correct data directories when using custom locations.
    • Fixed an issue detecting if data state files need to be reloaded.
    • Fixed problem reading of Rule and ActionCount properly introduced due changes in the configuration client of build 456.
    • Better error handling when configfile is missing or not accessible.
  • Configuration client:
    • When deleting an item in a datagrid, the Confirm/reset Button become clickable now to save or reset the changes.
    • Added missing password encryption checkbox in DB Monitor configuration.
    • Added missing LastDBIndex in DB Monitor configuration.
    • Fixed timestamp for “EventLog Legacy Format” INSERT
    • Fixed invisible encryption checkbox for password fields (Like ODBC Action)
    • Fixed an issue of unwanted LastRecord saving when changing eventlog channels settings.
    • The little “Save” Button has been changed to a “Confirm” which is more precisely.
    • Corrected Min/Max values for General->Queue Limit Setting.
    • Removed invisible click areas for all checkboxes and radio buttons.
    • Fixed loading of “Processed Files” in File Monitor when running in file config format.
    • Changed error handling when exporting configuration in file format.
    • Fixed incorrect trimming of spaces at the end of text variables (problem only affected file based configurations)

You can download Free Trial Version of MonitorWare Agent.

2013-12-09 MonitorWare Agent 9.1 released

Adiscon is proud to announce the 9.1 release of MonitorWare Agent.

This new minor release contains some new features and bugfixes.

Logs can now be normalized into XML, CSV and JSON formats. Furthermore, the normalization result is now fully available as regular properties and can be used both for output actions as well as filtering decisions.

This version permits monitoring remote machines via the V2 Event Log Monitor. This enables even better and remote monitoring capabilities.

International character set support has been improved. The email action now supports subject field encoding in UTF8, SHIFT-JIS, JIS and EUC-JP.

Detailed information can be found in the version history.

Version 9.1 is a free download. Customers with existing 8.x keys can contact our Sales department for upgrade prices. If you have a valid Upgrade Insurance ID, you can request a free new key by sending your Upgrade Insurance ID to sales@adiscon.com. Please note that the download enables the free 30-day trial version if used without a key – so you can right now go ahead and evaluate it.

SY0-401 Study Guides   ,
200-120 Exam   ,
c2010-652 Study Guides   ,
70-486 dumps   ,
70-486 test   ,
LX0-103 test   ,
1z0-434 exam   ,
SY0-401 pdf   ,
300-101 pdf   ,
HP0-S42 certification   ,
70-417 test   ,
c2010-652 certification   ,
70-347 pdf   ,
EX200 Study Guides   ,
SY0-401 certification   ,
70-533 pdf   ,
N10-006 test   ,
200-355 certification   ,
350-029 certification   ,
c2010-657 certification   ,
400-201 Brain dumps   ,
MB2-707 Brain dumps   ,
640-916 test   ,
MB2-707 test   ,
PR000041 test   ,
EX300 certification   ,
70-462 Study Guides   ,
70-532 exam   ,
70-483 dumps   ,
MB2-704 pdf   ,
350-001 Brain dumps   ,
ICGB test   ,
JN0-102 exam   ,
CCA-500 Study Guides   ,
350-030 exam   ,
70-413 pdf   ,
300-075 dumps   ,
CAP test   ,
CAP Exam   ,
350-060 Exam   ,
70-410 certification   ,
100-101 exam   ,
700-501 Study Guides   ,
C_TFIN52_66 test   ,

MonitorWare Agent 9.1 Released (Build-IDs: Service 9.1.430, Client 9.1.0.1388)

MonitorWare Agent 9.1 Released

Build-IDs: Service 9.1.430, Client 9.1.0.1388

Features

  • EventLog Monitor V2:
    Added support for Remote EventLog Monitoring. In order to work, make sure that the following requirements on the remote machine are met:

    • 1. The Service is configured to run with a administrative user who has rights on the local and remote machine.
    • 2. The Windows Event Collector Service is enabled and running on the remote machine.
    • 3. The Firewall on the remote machine (if enabled) allows access to Remote Event Log Management.
    • 4. The configured User is member of the “Event Log Readers” group on the remote machine.
  • Added new option “Process unknown/unconfigured Eventlog Channgels” which is enabled by default. Uncheck this option if you want to make sure that only selected Eventlog Channels should be monitored.
  • Updated librelp library to last v1 stable version 1.0.7.
  • File Action: Added file segmentation support for files above 2gb
  • Send Email Action: Added support for UTF8, SHIFT-JIS, JIS and EUC-JP encoded subjects.
  • Lognorm Action:
    Added option to specify output type as XML, CSV, JSN (Stored into a custom property)
    Event Fields are stored into the Property Engine now.

Bugfixes

  • File Action: File Size checking is now done before writing into files, this avoids writing into files that already reached their limits.
  • SNMP Trap Receiver: Fixed minor memory leak which occurred when receiving SNMP Traps.
  • HTTP Probe: Fixed HTTP Connection Close handling causing http 400 error log entries on IIS.

You can download Free Trial Version of MonitorWare Agent.

How to setup MonitorWare Agent to monitor NetApp devices using backup *.evt files

This article describes how to use MonitorWare Agent to monitor NetApp devices using the backup .evt files. In this guide we describe how to setup the service. For creating the actions, please refer to the our other guides.

There are basically two methods to monitor logs of NetApp devices. The first, described here, is to monitor the .evt files that the NetApp device generates. The second method is to monitor the device via the Eventlog API. Instructions can be found here.

The NetApp device basically offers to access the .evt files via a network share. Thus the files are easily accessible through our products.

Basically, we need to create the Event Log Monitor service in MonitorWare Agent. Simply right-click on services and from the popup list, choose “Add Service” and the “Event Log Monitor”.

Now disable all the currently available logs except for one. Double click on the one that is still checked. A new window opens.

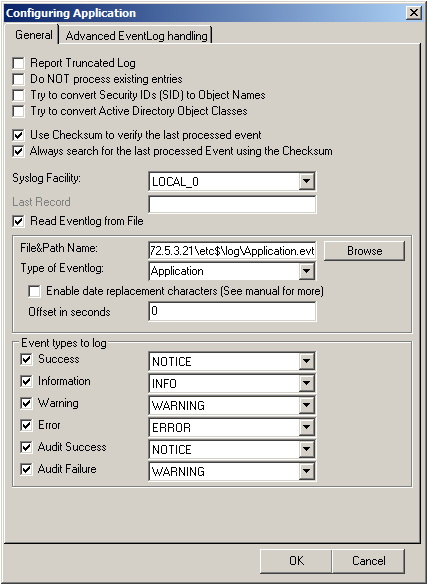
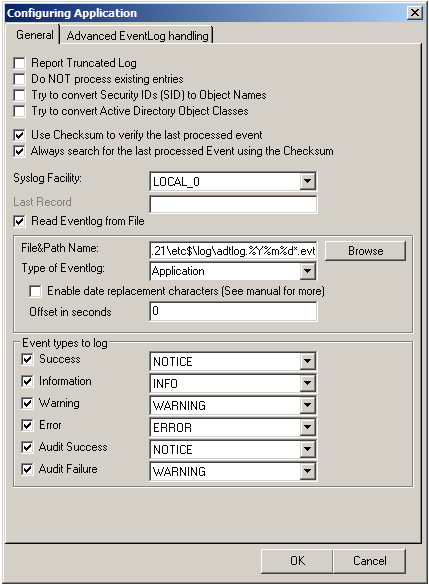
In this new windows, enable the option “Read Eventlog from File”. The parameters belonging to this option are now available. Insert the file and path name into the field. Alternatively, you can use the browse button to navigate to the remote location of the NetApp and choose the file like that. You could now also change the “Type of Eventlog” if necessary.

Please note, that this method is also fit to monitor multiple files. You only need to change the file name accordingly and insert wildcards to replace name values like dates. This is good for cases, when a new log file is created every day and the filename reflects the date when the file was created, like below for file like adtlog.20130206110000.evt or adtlog.20130206121314.evt.

So thats it basically. You can now choose to forward the log messages via syslog to a central log host, write them into a database or use one of the many other options that are available in MonitorWare Agent.

How to setup MonitorWare Agent to monitor NetApp devices using Eventlog API

This article describes how to use MonitorWare Agent to monitor NetApp devices using the Eventlog API. In this guide we describe how to setup the service. For creating the actions, please refer to the our other guides.

There are basically two methods to monitor logs of NetApp devices. The first, described here, is to monitor the device via the Eventlog API. The second method is to monitor the device via the .evt files the device generates. Instructions can be found here.

The NetApp device basically offers to access the log storage via the Eventlog API. That makes it very easy to use our products to monitor NetApp devices.

Basically, we need to create the Event Log Monitor service in MonitorWare Agent. Simply right-click on services and from the popup list, choose “Add Service” and the “Event Log Monitor”.

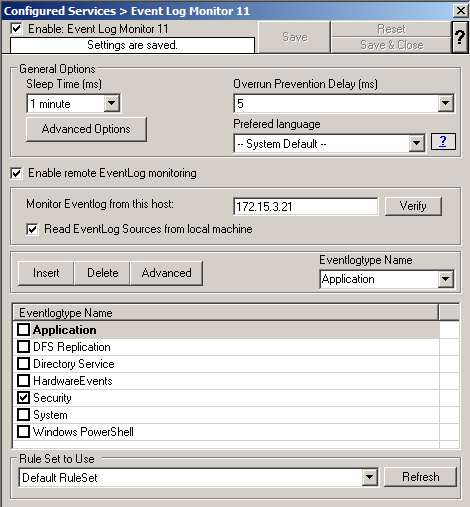
In the next step, enable “remote EventLog monitoring”. Insert the hostname or IP of the NetApp device into the field. Verify the connection with the “Verify” button. You might need to run the MonitorWare Agent service with a account, that has both local administrative rights as well as rights to read the Eventlog of the NetApp device.

Now disable all the currently available logs except for Application, Security and System. Double click on the one that is still checked. A new window opens.

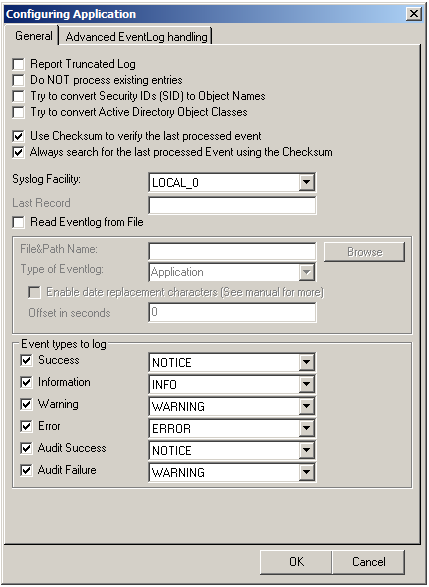
In this new windows, enable the option “Use Checksum to verify the last processed event”. The parameters belonging to this option are now available. Also enable “Always search for the last processed Event using the Checksum”. If these options are not enabled, polling the log messages will not work properly, because the NetApp logging system does not use a record number to identify single log messages. Repeat this step for the remaining two log types.

So thats it basically. You can now choose to forward the log messages via syslog to a central log host, write them into a database or use one of the many other options that are available in MonitorWare Agent.

2012-09-21 MonitorWare Agent 8.2a released

Adiscon is proud to announce the 8.2a release of MonitorWare Agent. This is a minor release.

This release contains a bugfix concerning the EventLog Monitor.

For more details read the version history

Version 8.2a is a free download. Customers with existing 11.x keys can contact our Sales department for upgrade prices. If you have a valid Upgrade Insurance ID, you can request a free new key by sending your Upgrade Insurance ID to sales@adiscon.com. Please note that the download enables the free 30-day trial version if used without a key – so you can right now go ahead and evaluate it.

MonitorWare Agent 8.2a Released (Build-IDs: Service 8.2.419, Client 8.2.1358)

MonitorWare Agent 8.2a Released

Build-IDs: Service 8.2.419, Client 8.2.1358

Features

  •  none

Bugfixes

  • Fixed/Readded support for the “-r -o” command line switch. This command switch enables you to run the service in console mode for a single run only. This currently only works with one v1 Eventlog Monitor configured. In this case the service will process all Events, and quits the process afterwards.


You can download Free Trial Version of MonitorWare Agent.

Centralized logging in a hybrid environment (Windows/Linux) – Step 3

Step 3 – Setting up the other Windows Servers

We already have the central server and the regular Windows clients set up. We now need to set up the other Windows servers. We assume, that we have other Windows 2008 Servers. On these servers we want to monitor the local Event Log and textfile-based log files. The log messages shall be transferred to the central server via TCP again.

To achieve this, we need MonitorWare Agent installed on those servers. This is simply because it is able to monitor textfiles in addition to the regular Event Log. In addition to MonitorWare Agent, we need nothing to be installed. Since we want to monitor textfile-based log files, we assume there is an IIS running.

Step 3.1

First, we will set up the ruleset. By doing this, we can create the services and they will automatically bound to the ruleset.
centralized_monitoring_1002

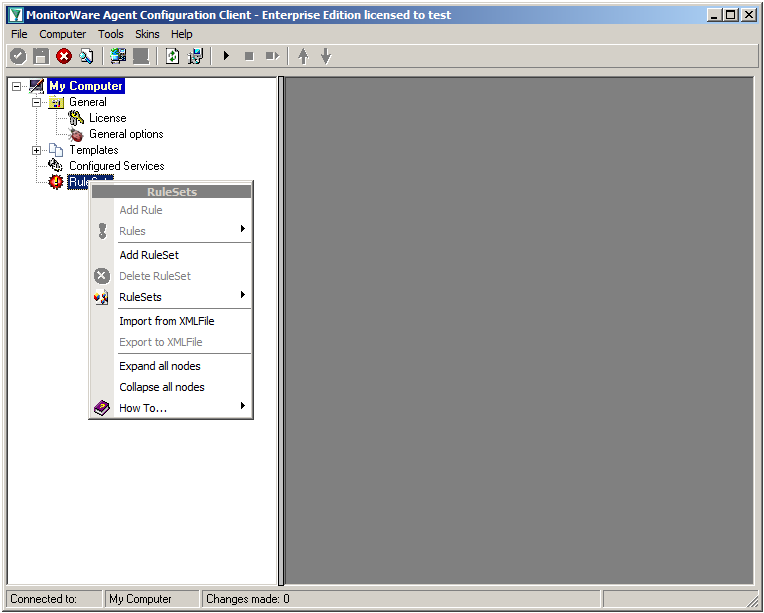
Right-click on RuleSets in the left hand list. A context menu will appear. Click on Add RuleSet
centralized_monitoring_3001

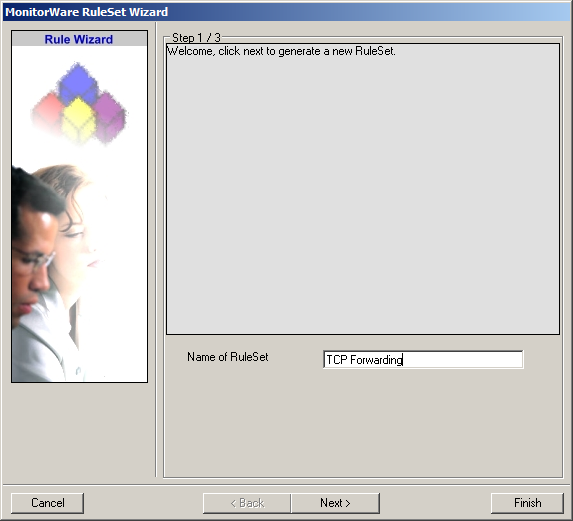
The RuleSet Wizard will appear now. You can give your ruleset a name of course. We will use TCP Forwarding for this example. After that, click on “Next”.
centralized_monitoring_3002

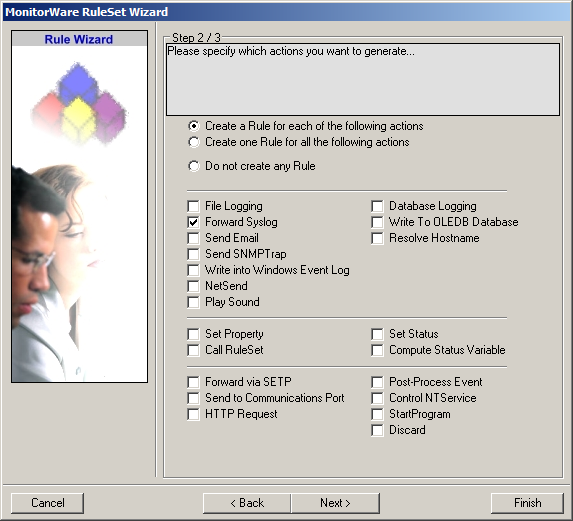
On the second page of the wizard we can specify what actions we want. Since we only want the log messages to be forwarded via syslog, check the box next to “Forward Syslog”. After that, click “Finish” to create the ruleset and action.

Step 3.2
centralized_monitoring_3003

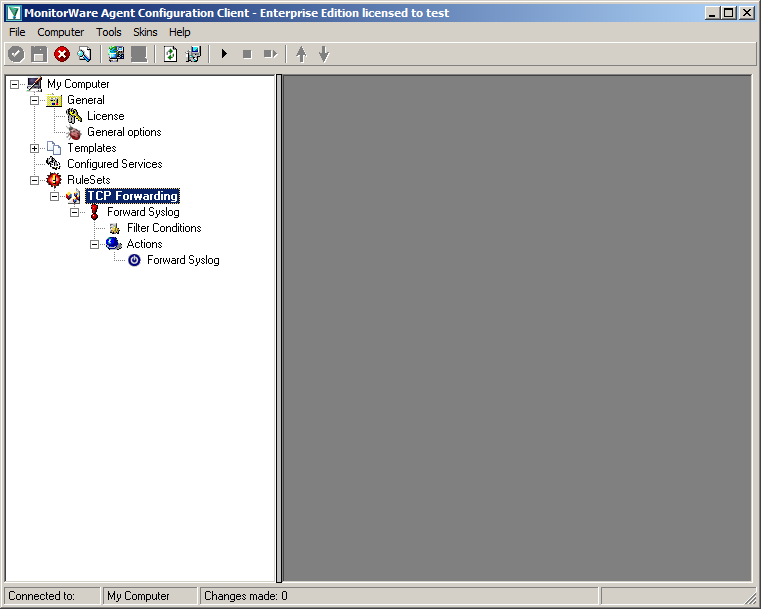
When you expand the treeview now, you will find a rule named “Forward Syslog” with an attached action of the same name.
centralized_monitoring_3004

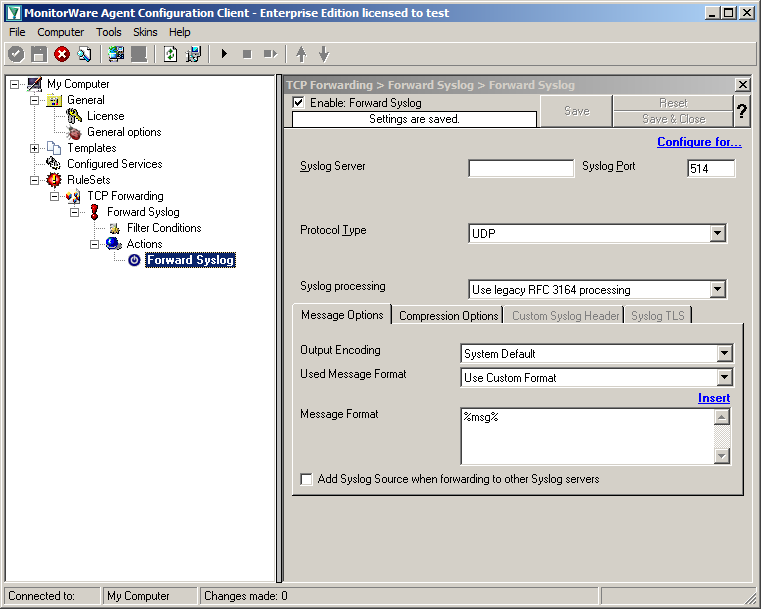
Now click on the action “Forward Syslog. You can see the default values now.
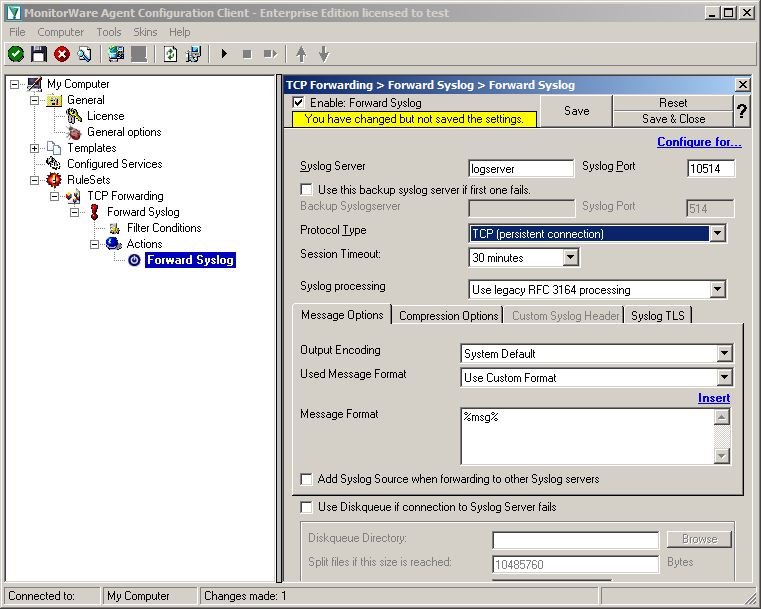
centralized_monitoring_3005

We need to change some of those settings now. First of all we need to enter the IP or hostname of our central server into the field “Syslog Server”. After that, change the port to 10514, since our central server will listen to syslog on this port. And we need to change the protocol type. Change is to TCP (persistent connection). That is all for now. Click on the Save button on the top so we can go on configuring the Service itself.

Step 3.3

Currently, when clicking on Configured Services you will not see a thing. But we will configure the services now. Without them, MonitorWare Agent is not able to get any log messages. We will setup 1 EventLog Monitor and 1 File Monitor.
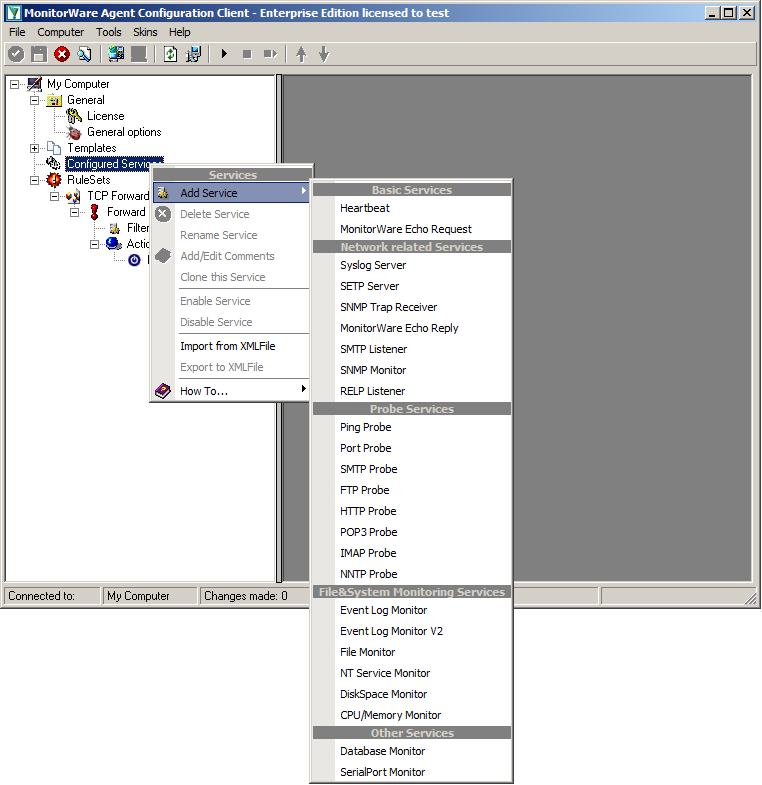
centralized_monitoring_3009

When right clicking on Configured Services a context-menu will open. By moving your cursor to “Add Service” you can see a list of Services, that may be configured. The list seems pretty long, but we basically need 2 services of them.
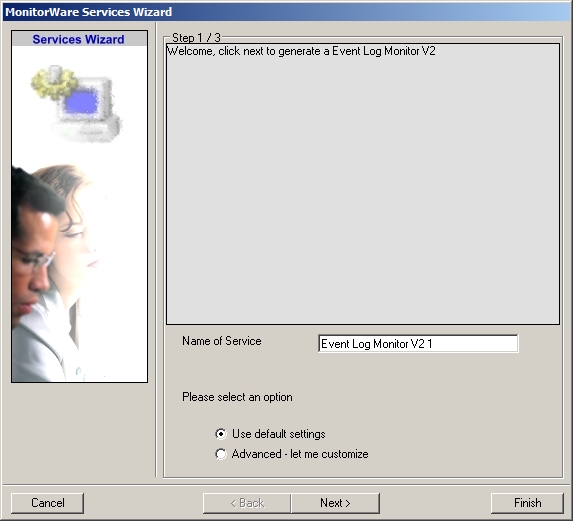
centralized_monitoring_3006

Click on “EventLog Monitor V2” first. The Services Wizard will open. Simply click on Finish for now. Repeat this again for the File Monitor.
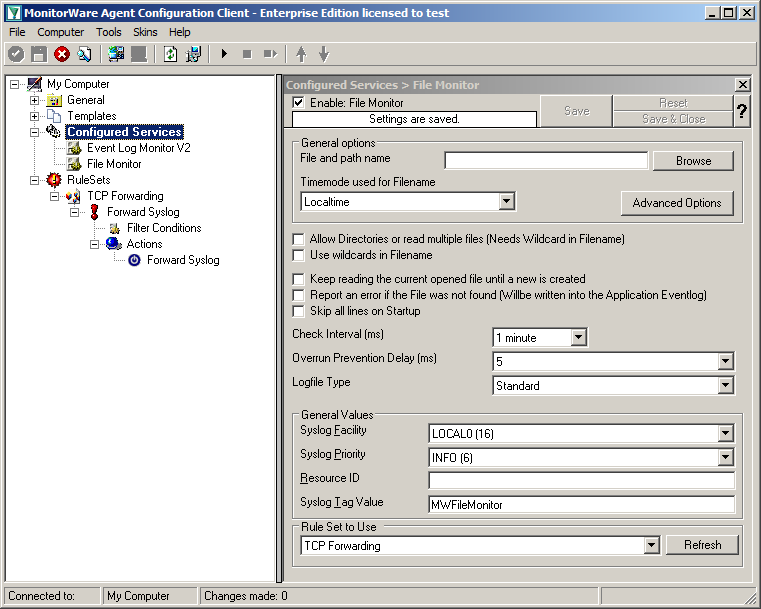
centralized_monitoring_3010

In the end, you should have a list with 2 Services. For our example I renamed the services by doing a right-click on the Service name I wanted to change and the choosing “Rename Service”.

Step 3.4

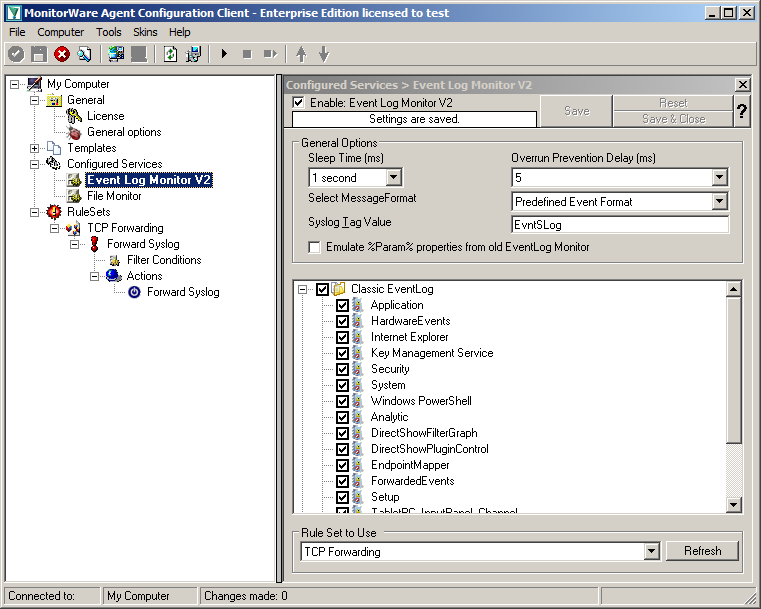
Settings for Event Log Monitor V2
centralized_monitoring_3007

The Event Log Monitor V2 needs no additional setup. Again the default values are ok. If you want specific Event categories not to be stored, you can disable the options. But the basic format is sufficient.

Step 3.5

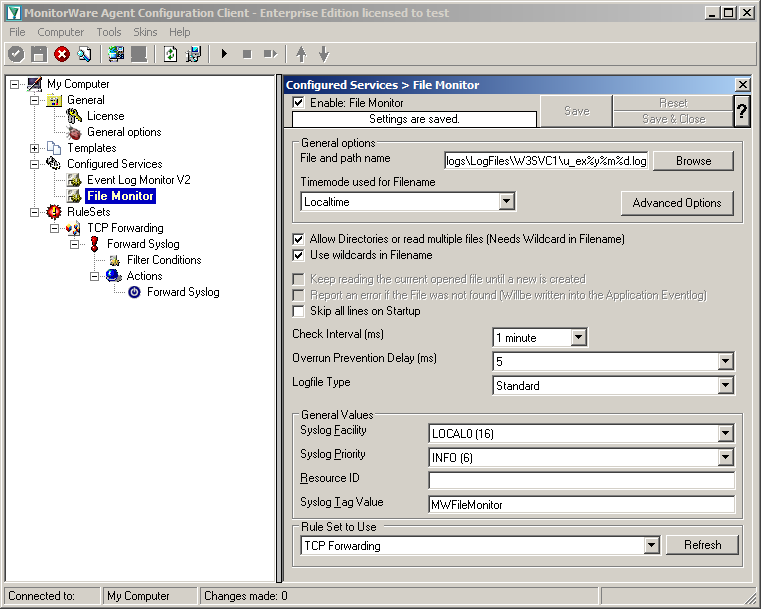
Settings for File Monitor
centralized_monitoring_3008

The File Monitor needs some additional settings. First, enable the option “Allow Directories or read multiple files”. You will see, that the use of wildcards will be automatically enabled and some other options completely being disabled.

Then we need to set the source files. For our example, we want to monitor the IIS logfiles. At the top of the File Monitor configuration you can see the option “File and path name”. There is a Browse button right next to it. Click it.

A windows explorer window will open, where you can choose the file you want to monitor. Navigate to the path C:\inetpub\logs\LogFiles\W3SVC1\. This is the location where the log files are stored. Please note, that the file location could be different when using another version of IIS. Choose the first file in the list. (Note: Daily Internet Information Server log files are  named  “u_exyymmdd.log”, with yy being the 2 digit year, mm the month and  dd the  day of month. To generate the same name with file monitor, use  the  following name “u_ex%y%m%d.log”.)
Set the Logfile Type to “W3C WebServer Logfile”.

Please note, that this step can be easily adapted for other log files (e.g. DHCP log files) as well.

Step 3 – finished

We have now finished setting up the other server. You only need to Save the configuration and start the Service with the “Play” button at the top of the Configuration Client. MonitorWare Agent will pull the logs from the Event Log and the text files and forward them via TCP syslog to our central log server.

<< Go back to the main page