2011-05-16 MonitorWare Agent 7.3a and 8.0a released

Adiscon is proud to announce the 7.3a  and 8.0a release of MonitorWare Agent. This is a bugfixing release.

This release only consists of bugfixes:

  • Fixed a memory leak in all TCP releated actions that could occur if the TCP session timeout was set to a low value.
  • Fixed a problem with the session timeout calculation for TCP releated actions. If the value was set above 3 minutes, the calculation became inaccurate and could even cause a TCP session to immediately expire.

For more details read the version history.

Version 7.3a and 8.0a is a free download. Customers with existing 6.x keys can contact our Sales department for upgrade prices. If you have a valid Upgrade Insurance ID, you can request a free new key by sending your Upgrade Insurance ID to sales@adiscon.com. Please note that the download enables the free 30-day trial version if used without a key – so you can right now go ahead and evaluate it.

MonitorWare Agent 8.0a Released (Build-IDs: Service 8.0.412, Client 8.0.1343)

MonitorWare Agent 8.0a Released

Build-IDs: Service 8.0.412, Client 8.0.1343

Bugfixes

  • Fixed a memory leak in all TCP releated actions that could occur if the TCP session timeout was set to a low value.
  • Fixed a problem with the session timeout calculation for TCP releated actions. If the value was set above 3 minutes, the calculation became inaccurate and could even cause a TCP session to immediately expire.
  • You can download Free Trial Version of MonitorWare Agent.

    MonitorWare Agent 7.3a Released (Build-IDs: Service 7.3.402, Client 7.2.0.1326)

    MonitorWare Agent 7.3a Released

    Release Date: 2011-05-16

    Build-IDs: Service 7.3.402, Client 7.2.0.1326

    Bugfixes

    • Fixed a memory leak in all TCP releated actions that could occur if the TCP session timeout was set to a low value.
    • Fixed a problem with the session timeout calculation for TCP releated actions. If the value was set above 3 minutes, the calculation became inaccurate and could even cause a TCP session to immediately expire.

    You can download Free Trial Version of MonitorWare Agent.

    Centralized logging in a hybrid environment (Windows/Linux) – Step 4

    Step 4 – Setting up the Linux Clients

    We still need to implement the Linux clients into our logging network. This could be Linux workstations or servers. Currently, rsyslog is already shipped with many Linux Distributions as the default syslog daemon already. Though, often a rather old version is installed (mostly v3), this will be sufficient for our current goals.

    For our example we will use a Fedora system and alter the configuration accordingly. In the end, rsyslog should use the logs, that are logged locally and forward them via TCP to the central log server.

    Please note: The example has been made with Fedora 13. Some steps may vary with other Linux distributions. Since there are so many possibilities, we cannot list them all. So we only concentrate on one version.

    Step 4.1:

    First of all, we need a terminal or command line and go into root mode with su. We do not need the root rights desperately, but it is a bit easier to achieve our goals.

    Step 4.2

    We need to alter the configuration accordingly. We will use the vi text-editor to do so. If you are not familiar with vi, you should consider getting some knowledge first with the vi man page.

    You can find the default configuration file in

    /etc/rsyslog.conf

    This configuration file will be loaded once rsyslog is started.

    Open the configuration file by the following command:

    vi /etc/rsyslog.conf

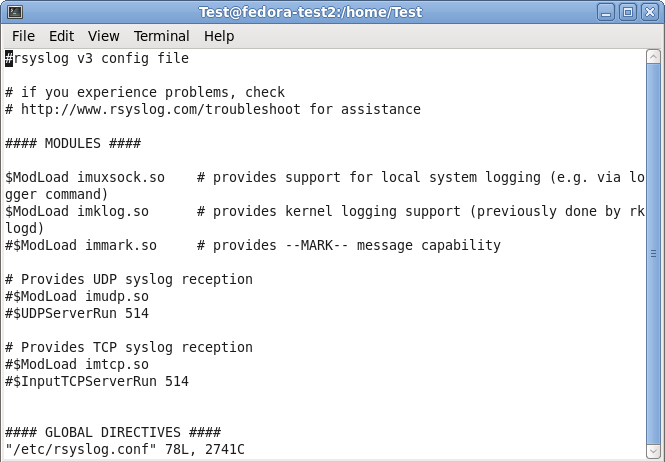
    Your terminal should look like this:
    centralized_monitoring_4001

    Step 4.3

    Under the header “#### MODULES ####” you can see the loaded modules. The ones we need are already loaded. For sending syslog, we do not need a extra module to be loaded. Basically, the imuxsock.so is listening to the local log socket and imklog.so provides the support for kernel logging. More is currently not needed.

    When going further down in the configuration, we see parts that are called UDP and TCP syslog reception. They are uncommented. We don’t need them, so we leave them that way. As you can see, there is the command to load a module (introduced my $ModLoad) and then a specific command that is given to the module which tells it to run as a syslog server on a specific port.

    Step 4.4

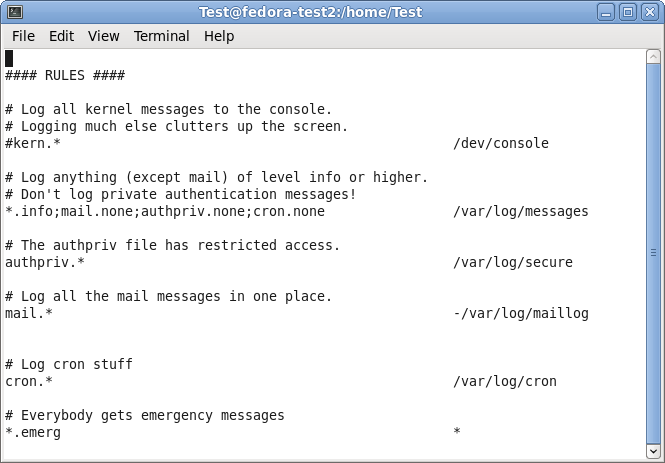
    When scrolling further down in the configuration file, we will find the header “#### RULES ####“.
    centralized_monitoring_4002

    Here, some rules are defined about which logs are stored in which location. These rules have a basic format. Basically, this looks like this:

    facility.severity storage_location

    The facility roughly determines, what has generated the log message. The severity tells you, how urgent the message is. And the storage location determines, where to store the logs. In the default config, there are several rules for some important log files. They will all be stored in the folder /var/log.

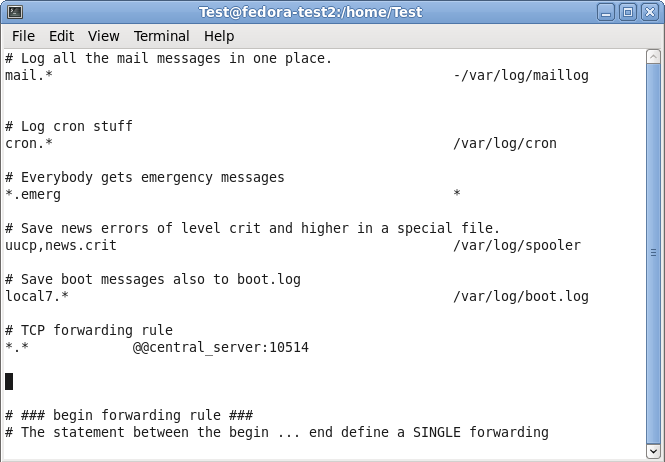
    We need to add another rule for forwarding all log messages via TCP syslog. For now, go to the last of the rules and insert the following:

    *.* @@central_server:10514

    This rule means that all messages, no matter the facility or severity, will be forwarded via TCP to the central server on port 10514. We need to choose port 10514, since our central server will listen to TCP syslog on this port.

    In the configuration file, this should look like this:
    centralized_monitoring_4003

    You can now save and quit vi.

    Step 4.5

    Now that we have altered our configuration according to our needs (which hasn’t been too much), we still have one more thing to do. We need to restart the service.

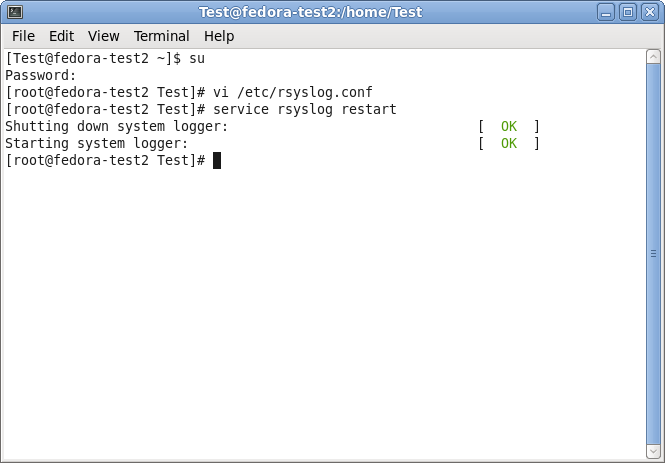
    Now that we are back on the command line, we can easily use the following command:

    service rsyslog restart

    This will tell the rsyslog service to stop and start again. Thus, the configuration will be loaded with the changes we made.
    centralized_monitoring_4004

    Step 4 – finished

    We are now finished with setting up rsyslog correctly. It will take all the logs it receives and forwards them to our central log server via TCP on port 10514. In addition to that, the default log rules still exist and will log messages to the local harddrive.

    Though, there could be many more scenarios and configurations. We decided to keep it simple for a basic setup.

    << Go back to the main page

    Centralized logging in a hybrid environment (Windows/Linux) – Step 3

    Step 3 – Setting up the other Windows Servers

    We already have the central server and the regular Windows clients set up. We now need to set up the other Windows servers. We assume, that we have other Windows 2008 Servers. On these servers we want to monitor the local Event Log and textfile-based log files. The log messages shall be transferred to the central server via TCP again.

    To achieve this, we need MonitorWare Agent installed on those servers. This is simply because it is able to monitor textfiles in addition to the regular Event Log. In addition to MonitorWare Agent, we need nothing to be installed. Since we want to monitor textfile-based log files, we assume there is an IIS running.

    Step 3.1

    First, we will set up the ruleset. By doing this, we can create the services and they will automatically bound to the ruleset.

    centralized_monitoring_1002

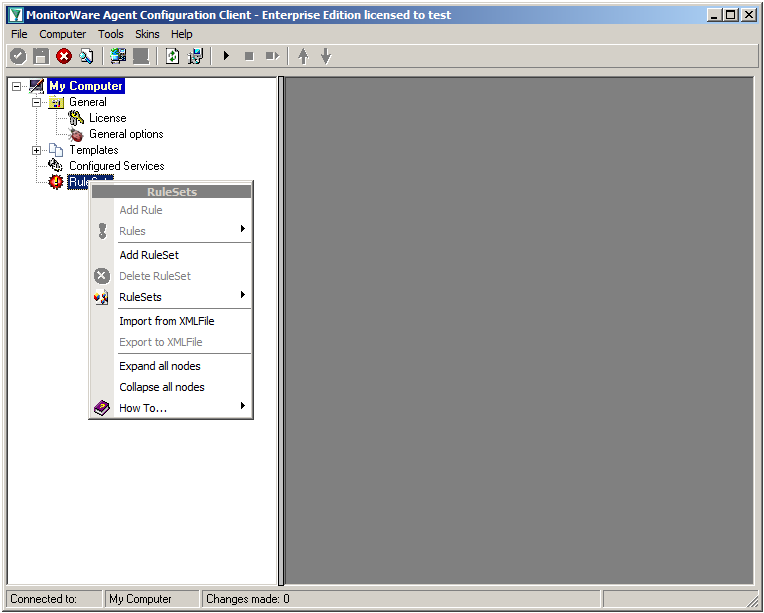
    Right-click on RuleSets in the left hand list. A context menu will appear. Click on Add RuleSet

    centralized_monitoring_3001

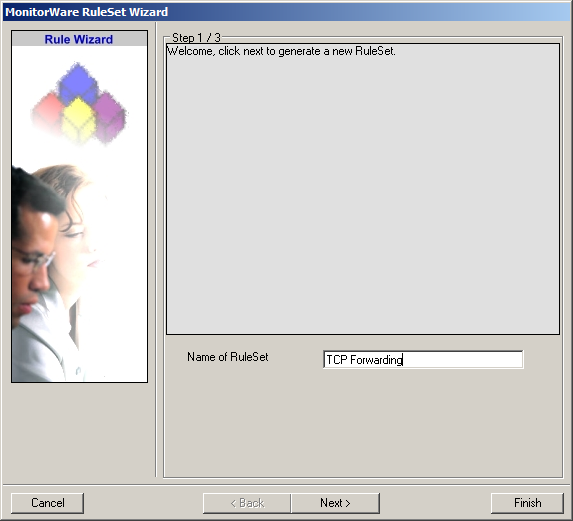
    The RuleSet Wizard will appear now. You can give your ruleset a name of course. We will use TCP Forwarding for this example. After that, click on “Next”.

    centralized_monitoring_3002

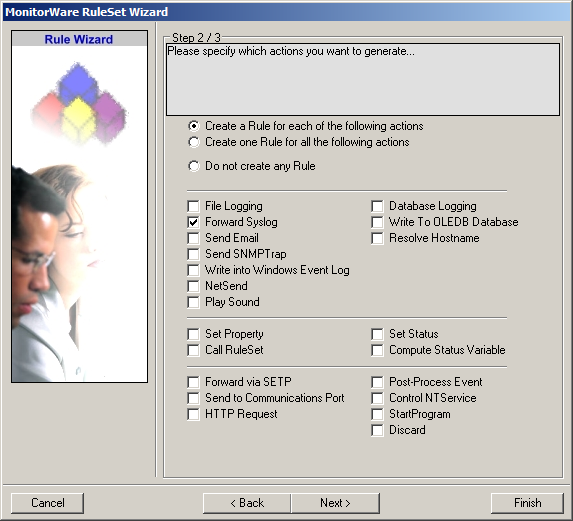
    On the second page of the wizard we can specify what actions we want. Since we only want the log messages to be forwarded via syslog, check the box next to “Forward Syslog”. After that, click “Finish” to create the ruleset and action.

    Step 3.2

    centralized_monitoring_3003

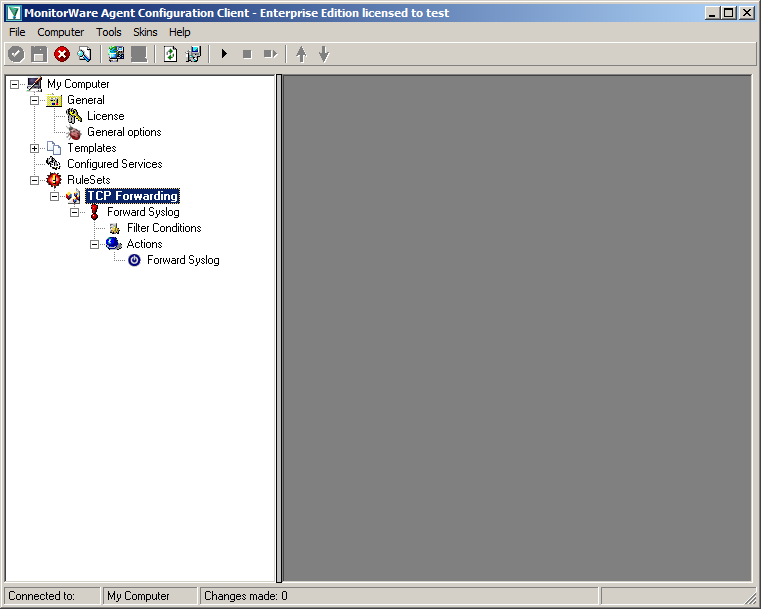
    When you expand the treeview now, you will find a rule named “Forward Syslog” with an attached action of the same name.

    centralized_monitoring_3004

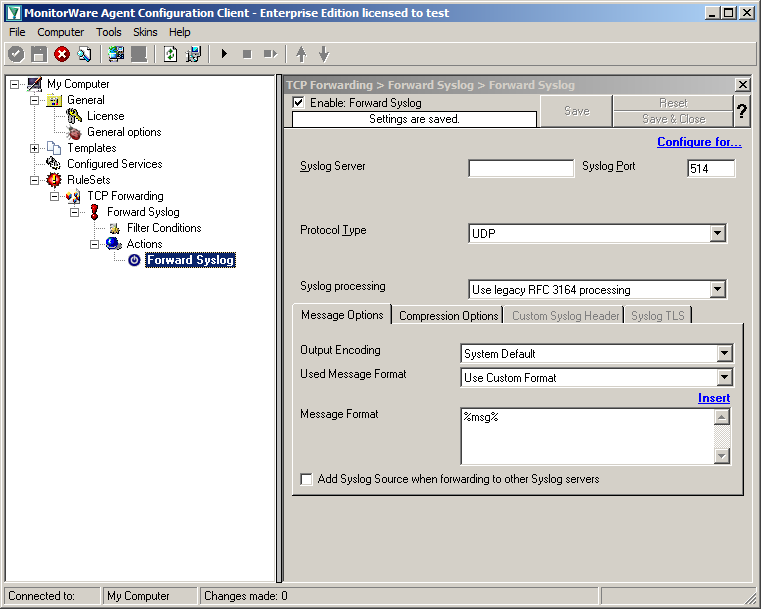
    Now click on the action “Forward Syslog. You can see the default values now.

    centralized_monitoring_3005

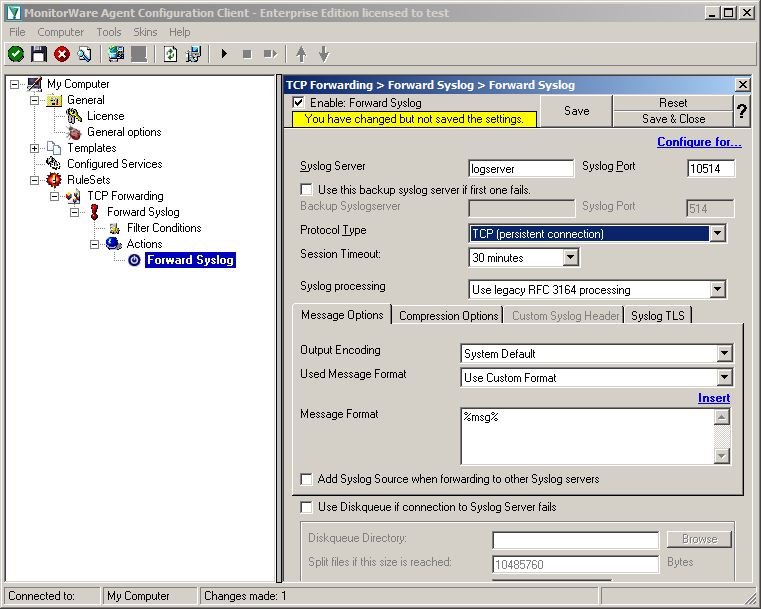
    We need to change some of those settings now. First of all we need to enter the IP or hostname of our central server into the field “Syslog Server”. After that, change the port to 10514, since our central server will listen to syslog on this port. And we need to change the protocol type. Change is to TCP (persistent connection). That is all for now. Click on the Save button on the top so we can go on configuring the Service itself.

    Step 3.3

    Currently, when clicking on Configured Services you will not see a thing. But we will configure the services now. Without them, MonitorWare Agent is not able to get any log messages. We will setup 1 EventLog Monitor and 1 File Monitor.

    centralized_monitoring_3009

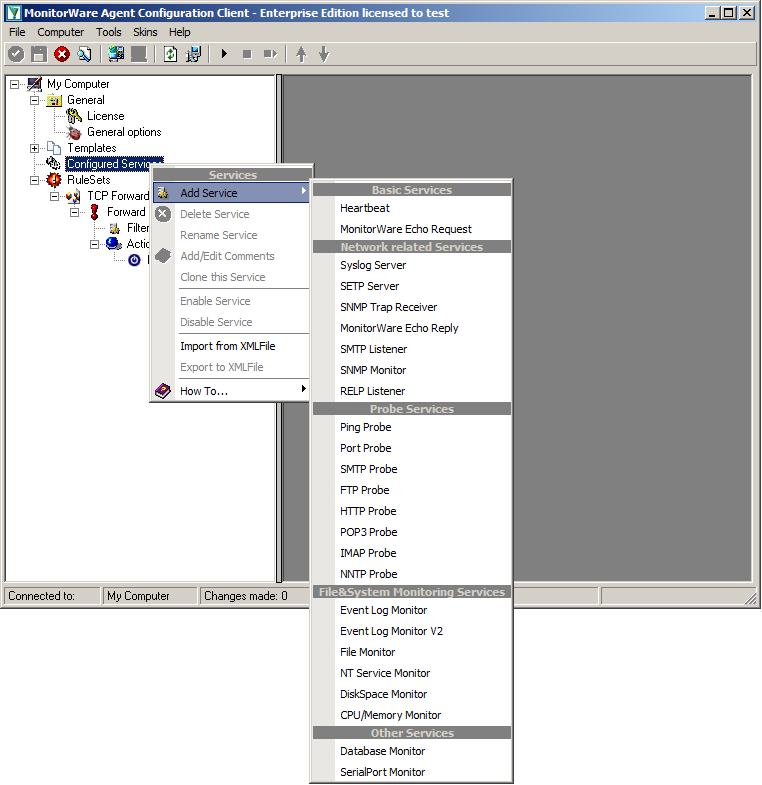
    When right clicking on Configured Services a context-menu will open. By moving your cursor to “Add Service” you can see a list of Services, that may be configured. The list seems pretty long, but we basically need 2 services of them.

    centralized_monitoring_3006

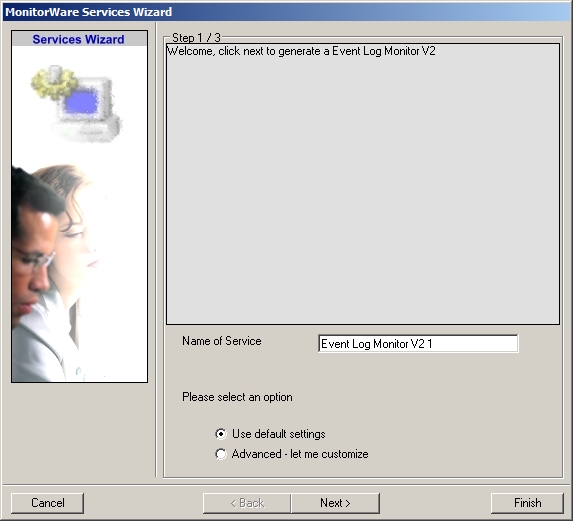
    Click on “EventLog Monitor V2” first. The Services Wizard will open. Simply click on Finish for now. Repeat this again for the File Monitor.

    centralized_monitoring_3010

    In the end, you should have a list with 2 Services. For our example I renamed the services by doing a right-click on the Service name I wanted to change and the choosing “Rename Service”.

    Step 3.4

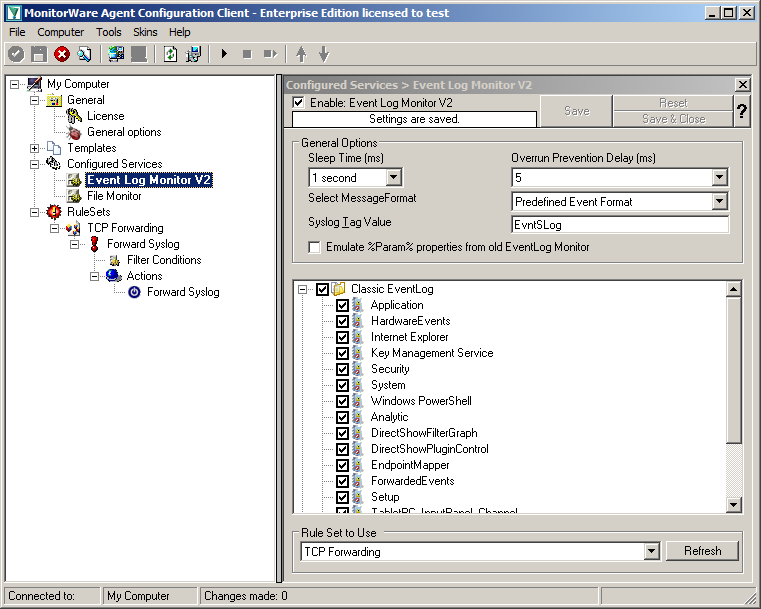
    Settings for Event Log Monitor V2

    centralized_monitoring_3007

    The Event Log Monitor V2 needs no additional setup. Again the default values are ok. If you want specific Event categories not to be stored, you can disable the options. But the basic format is sufficient.

    Step 3.5

    Settings for File Monitor

    centralized_monitoring_3008

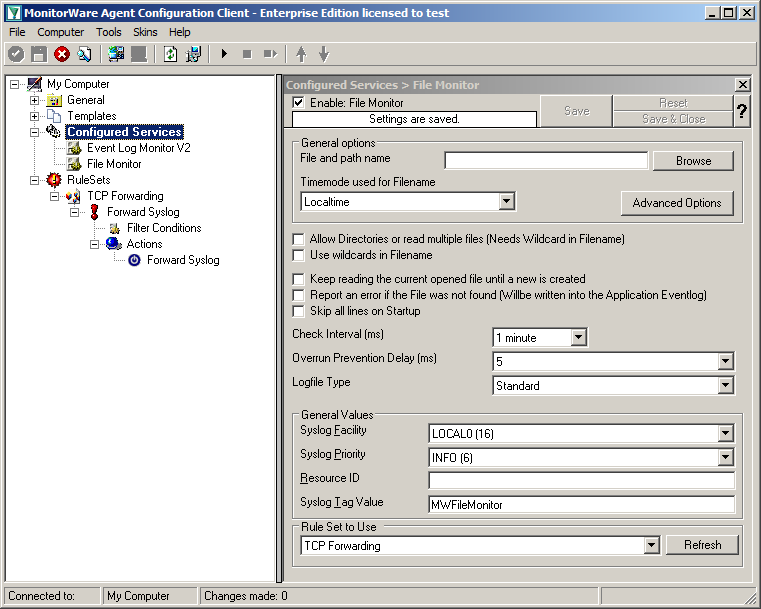
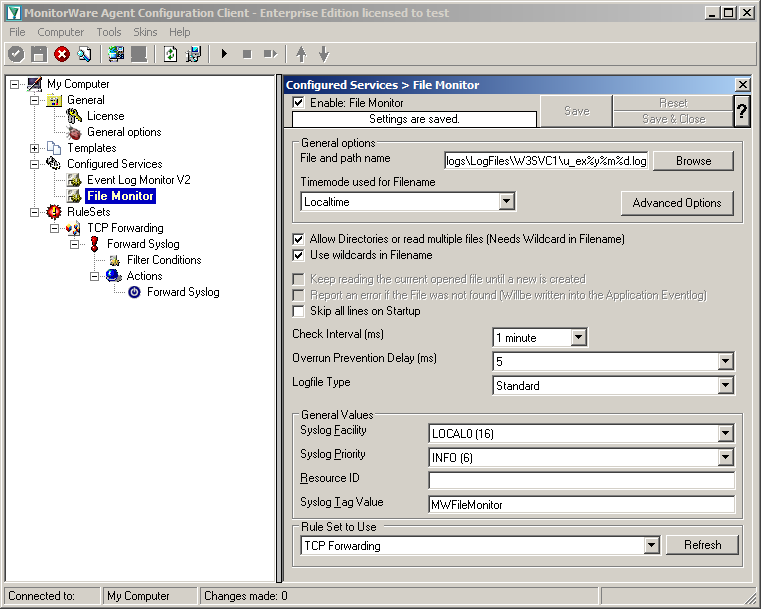
    The File Monitor needs some additional settings. First, enable the option “Allow Directories or read multiple files”. You will see, that the use of wildcards will be automatically enabled and some other options completely being disabled.

    Then we need to set the source files. For our example, we want to monitor the IIS logfiles. At the top of the File Monitor configuration you can see the option “File and path name”. There is a Browse button right next to it. Click it.

    A windows explorer window will open, where you can choose the file you want to monitor. Navigate to the path C:\inetpub\logs\LogFiles\W3SVC1\. This is the location where the log files are stored. Please note, that the file location could be different when using another version of IIS. Choose the first file in the list. (Note: Daily Internet Information Server log files are  named  “u_exyymmdd.log”, with yy being the 2 digit year, mm the month and  dd the  day of month. To generate the same name with file monitor, use  the  following name “u_ex%y%m%d.log”.)
    Set the Logfile Type to “W3C WebServer Logfile”.

    Please note, that this step can be easily adapted for other log files (e.g. DHCP log files) as well.

    Step 3 – finished

    We have now finished setting up the other server. You only need to Save the configuration and start the Service with the “Play” button at the top of the Configuration Client. MonitorWare Agent will pull the logs from the Event Log and the text files and forward them via TCP syslog to our central log server.

    << Go back to the main page
    Massive use of memory when using TCP

    Massive use of memory when using TCP

    Article created 2011-02-01 by Florian Riedl.

    Due to some testing we found, that in some cases MonitorWare Agent uses a lot of memory. This will happen, when MonitorWare Agent is configured as a syslog receiver and is listening to TCP. Additionally, this only occurs, when there are large message bursts, that are continously sent.

    We realized it, when MonitorWare Agent used up all free memory and even the page file and didn’t stop to allocate memory blocks. First we thought this was a real bug – the memory would be allocated, but not be purged after it was used. But that was not the problem. Further testing proved, that the memory would be free again after a while.

    It turned out, that the real reason was a configuration issue in MonitorWare Agent. With the default values for receiving syslog over TCP, the service would not recognize the line separators of the syslog messages, thus “thinking” it would get a single message only and thus allocating more and more memory for this “huge” message. This would happen when receiving large bursts of message and the buffer for receiving syslog messages would be full.

    The solution is pretty simple, yet effective. In the configuration client you need to activate a setting for the syslog server. Just activate “Messages are separated by the following sequence” in the TCP Options. With this activated, MonitorWare Agent can properly recognize line breaks. Thus, it will only allocate memory for the real messages in the queue.

    This option will be activated by default in the next release of MonitorWare Agent (8.0).