Does UNC Pathes work for WinSyslog, EventReporter and MonitorWare Agent ?

Does UNC Pathes work for WinSyslog, EventReporter and MonitorWare Agent ?

Created 2003-11-21 by Tamsila-Q-Siddique.

When UNC (\\severname\sharename\path) was given in the file path (in your defined “Write to File” action) Winsyslog, Eventreporter and MonitorWare Agent didn’t work?

Yes, UNC works for Winsyslog, Eventreporter and MonitorWare Agent, but due to Windows design you must meet some pre-requisites to enable them to actually work. They do NOT work in the default configuration. This is because WinSyslog, EventReporter and MonitorWare Agent are installed to be running under the Windows local system account. This account is restricted from network I/O by Windows design. To use a UNC name from a service (like WinSyslog, EventReporter and MonitorWare Agent ), please do the following:

  1. Create an account that has permissions to actually access the UNC share
  2. Then, you must grant it “log on a service” rights so that the service can use it.
  3. Also make sure that it has permissions to access all local resources needed.
  4. Then, go to Windows Services Manager and change the service account to the new one.
  5. Now you are able to access the UNC share.

Records are not displayed on the Web when MYSQL was the underline database ?

Records are not displayed on the Web when MYSQL was the underline database ?

Created 2003-11-19 by Tamsila-Q-Siddique

Records are not displayed on the web when I use MySQL ? Records aren’t displayed on the web when I use MySQL. The data isn’t retrieved even though the database is being populated and logs are being generated.

Note that MySQL under Linux requires “case sensitive” in the most cases. MySQL database tables and, field names should match with the ones defined in your “Data Base Logging Action”. That’s why records aren’t displayed on the web when MySQL is the underline database. For doing this do the following:
* Ruleset – > Actions – > Data Base Logging.
* MySQL -> (Databases)… -> Database -> YourDataBase (where YourDatabase could be any name).
* Check that the table names and the field names defined in the Data Base Logging and YourDataBase should match exactly.

A complete step by step guide that explains how the reports can be generated with MonitorWare Console

How To Generate Reports with MonitorWare Console Manually

Article created 2003-11-19 by
Wajih-ur-Rehman.

1. Once MonitorWare Console is opened, on the left hand
side, you can see a tree view with a node called "Reports". Click on that node.
It will show you the list of avaiable reports under it as well as on the right
hand side. You will see something similar to the following figure.


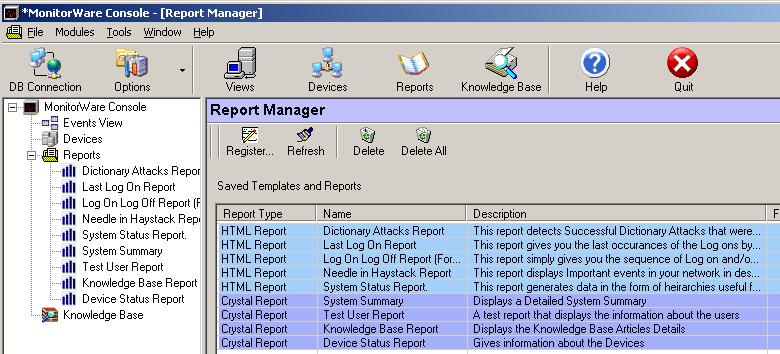
You can now click on any of the displayed reports.
For the purpose of this article, I have selected "System Status Report"
because it is a very comprehensive report and summarizes the overall network
activity very well. Once you click on the System Status Report, you will see
something similar to the figure shown below

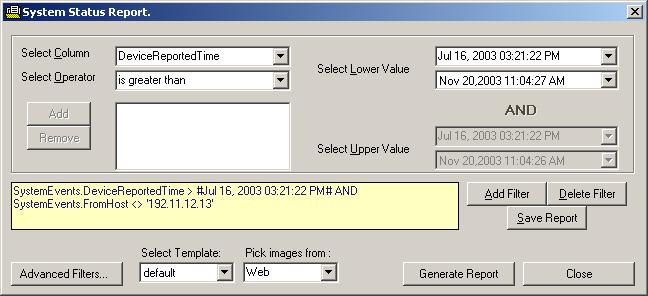
2. Once you click on System Status Report, the
following form will be displayed

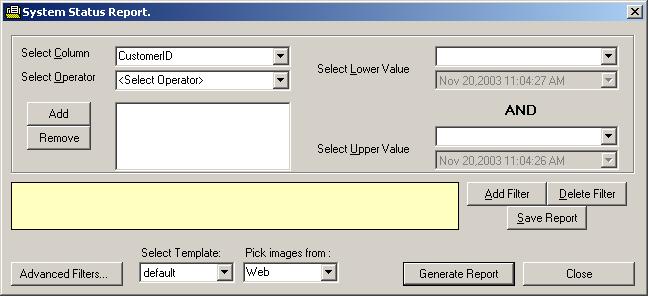
3. MonitorWare Console provides a powerful
feature of letting users define and apply filters on any report. Using this
form, you can apply the filters of your own choice. (For details about the
filters, please refer to MonitorWare Console’s Manual which can be accessed by
pressing the Help button in MonitorWare Console’s tool bar)

4. Lets say, I am interested in getting a
report for the records that were logged after July 16, 2003 and were not from
the machine 192.11.12.13. I can setup my filter in the following way:

5. At the bottom left of the screen shot
above, you can see there is a button which is called "Advanced Filters". If you
click on this button, a form similar to the one shown below will pop up:

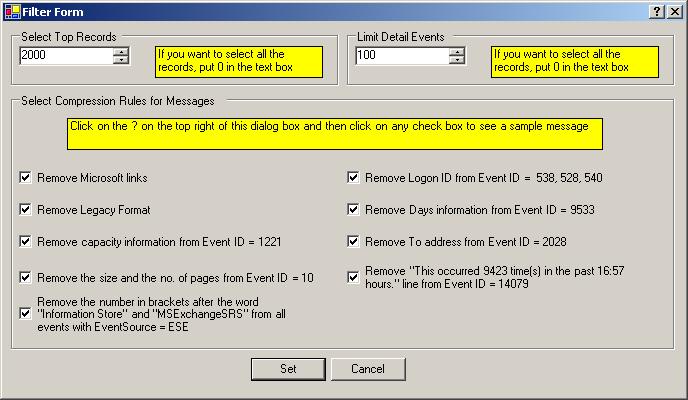
With this Advanced Filters’ Form, you can
specify some additional filters for the System Status Report. This Advanced
Filter form provides an opportunity to consolidate the records to a great
extent. I will give one example to clarify this. Some events that are generated
in the Windows Event Log have the same message but sometimes contain different
Microsoft links. If you select the check box "Remove Microsoft links" above, it
will remove the Microsoft links before consolidating them and hence a number of
different events with count 1 could be consolidated to just a single line.
Please note that it doesn’t remove the information permanently from the
database. It just removes this information for generating this report. Similarly
other check boxes can be checked to provide a greater level of consolidation.

6. Once you define the advanced filters in
the form shown above, press the "Set" button. You will be taken back to the
previous Filter From.

7. Once you have defined all the filters, you
can actually save all of your settings by pressing the "Save Report" Button in
the Filter Form so that you dont have to define these filters daily if you are
interested in seeing this report daily.

8. You can now press the "Generate Report"
button. It will open up a report in HTML format according to your defined
filters as shown below (Please note that some information has been removed
purposely for security reasons)

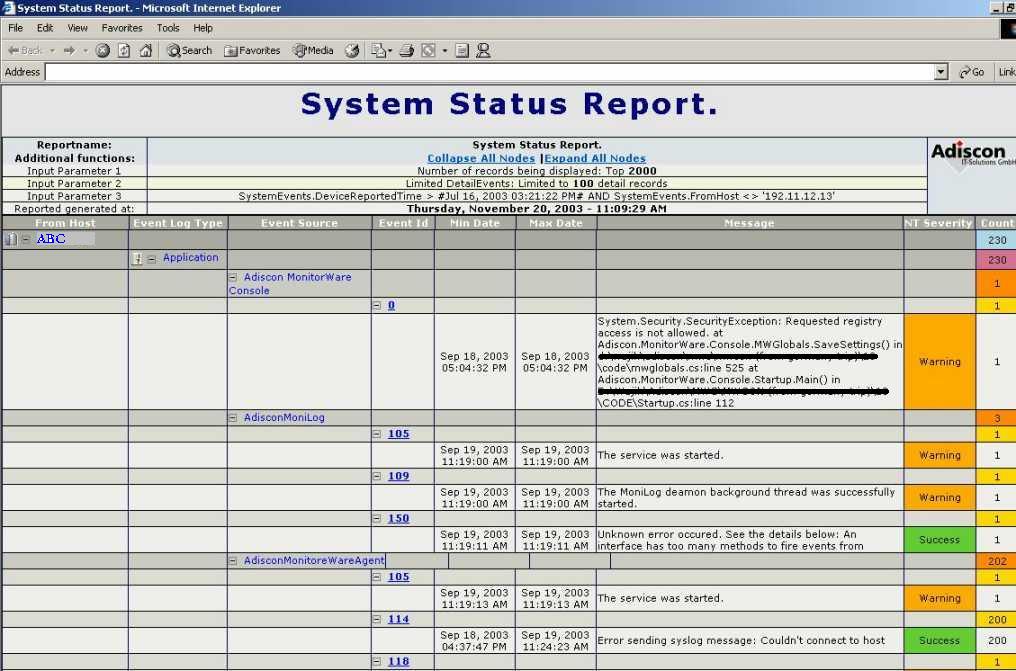
In this report, you also have the option of
expanding and contracting the node of From Host, Event Log Type, Event Source
and Event Id

How To setup MonitorWare Console

How To setup MonitorWare Console

Article created 2003-11-19 by
Wajih-ur-Rehman.

After installation, once MonitorWare Console is started, a
dialog box similar to the one shown below would be displayed.

The default user name is “admin” and password is nothing
(as shown above). Once a user enters into the application, this password can be
changed.

At the bottom left corner of this dialog box, there are two
links “Edit Database Connection” and “License Options” The latter one is
self-explanatory. If you click on it a license dialog appears where you can view
or change your license key and/license name. There is also a link to order the
product directly via our online ordering system.

The other link in the login dialog, “Edit Database
Connection” is used if the user wants to change the database connection.
Currently MonitorWare Console supports Microsoft Access, SQL Server and MySQL.
Once the above-mentioned link is clicked, a dialog box, as shown below, will pop
up. Using this dialog box, the user can change the underlying database.

In the DSN, you can provide the name of the DSN that is
pointing to some existing MonitorWare Database (Assuming that you already have
configured MonitorWare Agent, EventReporter or WinSyslog). You can also create a
new DSN by clicking on the link “Edit Database Sources”. It opens the ODBC Data
Source Administrator window. On the System DSN tab the user can configure all
found DSNs.

Use the System DSN tab to select the data source. Press the
“Configure…” button to setup the database path for the data source.

Provider tab at the top left of the above screen is used to
select the database. Connection tab is used to select the database path. Once
the provider and the connection has been selected, Test Connection button can
test whether the connection with the specified database has been established or
not.

If the dialog box, as shown below, is displayed, it means
that the connection with the specified database has been set up properly and the
user can proceed further by pressing the OK button

On the other hand, if a dialog box, as shown below is
displayed, it means that there is something wrong and the connection with the
mentioned database has not been established.

After setting up the database, the OK button in the top
most figure
will take the user inside the MonitorWare Console application.


Error on startup (Error event ID: 7026) explained.

Error on startup (Error event ID: 7026) explained.

Created  2003-11-06 by Andre Lorbach.

Many Adiscon products (e.g. WinSyslog, EventReporter or MonitorWare Agent) are available in a 30 days trial version.
After this time, the Service will stop working and if you are not logged on interactive, you will not see an error message. However, an error message in the application eventlog is generated by the system. It looks like the following:

Event Type: Error 
Event Source: Service Control Manager 
Event Category: None 
Event ID: 7023 
Date: xx/x/xxxx
Time: x:xx:xx AM 
User: N/A 
Computer: MYCOMPUTER
Description: 
The service terminated with the following error: 
The system could not find the environment option that was entered.

The reason why you get this error is, because your trial is expired.
The Service will skip initialization and the system will catch this with the error above.
What to do if you purchased the software, entered the license name / key and you still get this error?

1. Check the license name, it has to spelled correctly and to be case sensitive. Otherwise the license will not work.
2. Contact support@adiscon.com for further assistance.

Trouble with a non-Adiscon product? Then see this description of event 7026!


Do you want to control your Windows Server/Workstation events and get alerted on errors?
Take a look at the EventReporter product website!

Analysis, monitoring, near-real-time alerting of the Windows event log can be done with EventReporter.

Take a Quick Tour to EventReporter to know more about its exciting features or directly download the free and full-featured 30 day trial version.