Reporting Log Truncation

Step-By-Step Guides

Article created 2003-05-09 by Tamsila-Q-Siddique.

Reporting Log Truncation

This step-by-step guide was inspired by a customer question. The customer had a need to record all events seen in the event logs. But due to the overall setup, a lot of event log truncated messages occured. These, too, should be forwarded, but only one in a row (there occured multiple of such event quickly after each other, uselessly filling up the central log). This scenario also serves as a good sample on how to report only the first instance of frequently reoccuring events while reporting all of the rest. In this example we assume that all messages should be forward via syslog to the central syslog server at 10.0.0.1. We use the default format for forwarding. Please replace this with whatever actions you desire.

Step-by-step Instructions

In order to achieve this goal, we have to use filter conditions. Whenever a log is truncated Event ID 1011 is registered in Windows Event Log by Configuration Program. Keep in mind that an Event ID alone is not meaningful, so we need to complement it with the Source and the Log part to make it unique. The filter process will now basically work as follows (for details see steps below):

  • Rule 1: Finds the 1011 event and makes sure it is only reported once within a given period.
  • Rule 2: Discards all 1011 events (the first one will have been forwarded by rule 1, all consequive ones will simply be discarded – just as required by the scenario)
  • Rule 3: Processes all other message (event 1011 will never arrive here, because it was discarded in rule 2)

Obviously, Rule 3 can be many rules, as many as you like. Rule 1 and 2 can be iterated if you have more than a single event to be treated that way.

First Rule:

1. Once Configuration Program is opened, create a new service i.e. Event Log Monitor.

2. Add a new Ruleset. We name it as Reporting Log Truncation Rule.

3. Add a new rule named as Log Truncation.

4. Click on the Filter Conditions of Log Truncation. Now start applying filters, in the end your filter condition will look like as in the screen-shot shown below. To prevent this rule from firing too often we would enable “Minimum Wait Time”. This will make sure that the “log truncation” events are only forwarded once within a specified period.

5. Now create a new action as “Forward via Syslog” and configure it according to your settings e.g. Syslog Server has been configured to 10.0.0.1.

6. Don’t forget to bind your ruleset i.e. Reporting Log Truncation Rule to the service i.e. Event Log Monitor.

Second Rule:

1. Add a new Rule named as “Discard”.

2. Click on the Filter Condition and set the filter as described in step 4 but with out enabling Minimum Wait Time. It should look like as follow:

3. Now we define an action as called as “Discard”. This Discard action will make you to get rid of all those events after its been forwarded as Syslog.

Third Rule:

1. Add a new Rule named as “Forward Syslog”.

2. Leave the Filter Condition as it is i.e. no filters are specified. By default this apply to the rule as whole.

3. Now define a new action as “Forward via Syslog”. And set the configurations according to your settings e.g. Syslog Server has been configured to 10.0.0.1 as in First Rule.

Once done with the rules, don’t forget to restart your Configuration Program!

Firewall setup for MonitorWare Agent

Step-By-Step Guides

Article created 2003-05-09 by Rainer Gerhards.

Firewall setup for MonitorWare Agent

MonitorWare Agent can be used with standard firewalling. The product itself does not require any specific access privileges to network services like RPC or the like. The Windows networking support required is fully dependant on the needs of the network or security administrator. If a fully locked-down system is desired, the product can be run on a system without any network connectivity except for the activated services.

MonitorWare Agent’s network communication needs are solely depending on the configured services and actions.

For syslog or SETP servers, open firewall ports are needed for the configured incoming ports. By default, this is 514/UDP for syslog and 5432/TCP for SETP. Both settings can be changed, which is especially useful for syslog where a non-standard port can be good security measure.

Ping and Port probes need outgoing connectivity (and replies allowed) for ICMP PING and the probed ports, respectively.

Intrusion Detection via the Windows Event Log

Step-By-Step Guides

Article created 2003-05-09 by Rainer Gerhards.

Intrusion Detection via the Windows Event Log

The Windows event log provides multiple evidence of potential intrusions. We will discuss what to look for when checking the event log.

We have used Windows 2000 Server while creating this text. There may be differences for other versions, so you might want to check if you are using a different environment.

Detecting Failed Logons

Numerous failed logons are a good indication that someone is trying to guess user passwords. This is typically done using a so-called “dictionary attack”, where a list of words often used as passwords (the dictionary) is simply tried on a given account. If the account password is carefully chosen, not only the dictionary attack fails but there are many failed logon events. Even if the password is contained in the dictionary, chances are quite good that it is not in the first 5 to 10 words the attacker tries. Windows allows you to lock out an account that has too many invalid password attempts. If the configured threshold is reached, the account will be disabled for a given period of time and Windows will also log event in the security event log.

Configuring Windows

By default, Windows does not check for those kind of attacks. It must be turned on by the administrator. This is done in the “Account Lockout Policy” (part of the “Account Policies”). On a single server, this is configured with the “Local Security Settings” administrative tool. In a domain environment, this is part of the group policy set that is to be applied. Below is a snapshot of a typical configuration for it:

Please note that this policy does not apply to the build-in administrator account. It will never be locked out. This is another very good reason to rename it.

Activating this policy does not automatically write events to the Windows Event Log when an user is locked out by the system. To see these, you also need to turn on auditing. This is done with the same tool, under the “Local Policies”, “Audit Policy”. There, you need to enable at least “Success” audits for the “Audit account management”. This is circled in the screen-shot below.

Please note that I have also enabled Logon-related events in the screenshots. We will later see why I have done this.

With these settings, we will receive an security event 644 as soon as an account is locked out.


Screenshot of the 644 Event

Important: our testing has shown that the 644 security event does not occur under all Windows versions. While testing with Windows 2000 without a service pack, these events did not occur. After applying service pack 3, they appeared. So be sure to check that the events occur in your environment.

If the 644 event is not generated on your systems and you are not able to patch it to the service pack level that makes it appear, you can alternatively look into the 693 logon failure events. When someone tries to use a locked out account, they look as follows:

Please note the reason text. This reason only happens when an account is locked out. However, this reason does only occurs after the account has been locked out. The login failure leading to the lockout still has the normal “invalid password” text in it. As such, lockouts may be left undetected or detected only after the incident when using this event as notification. Not only for this reason we highly recommend to apply the most recent service pack.

Creating Rules for MonitorWare Agent

Now that we have the proper events present in the Windows Security Event Log, we can build MonitorWare Agent rules to detect unusual patterns. Please keep in mind that the rule set must be either bound to an event log monitor service or be included from another rule set that is bound to one. Without that, the rule set will not be executed. We will not explain this process here in this chapter. We just focus on the filters and rule set itself.

We will create a rule that fires if our 644 event is seen:

We use an email action to notify the admin once this happens:

Of course, we could also have done other things. Good example might be sending a syslog message to a syslog server specifically monitoring such events. The proper action is mainly depending on your intended result.

This rule detects attacks that will lead to an account becoming locked out. It will also fire if a user actually mistypes his password often enough to become locked out. This rule does not help against attacks where the user id changes together with the password. There are some tools out doing so.

Fortunately, we can detect those attacks, too. The key to it is counting failed logons. If the number of failed logons reaches a threshold within a given amount of time, we can suspect that something is wrong. Of course, the threshold is different for different types of machines. A web server, for example, that is just serving web pages and where only administrators and web authors log on, the number of failed logons should be really low. On a busy file server, on the other hand, that threshold should probably be much higher. As such, the actual numbers we use in our sample here should be treated with care. They need to be replaced by some values that match your typical environment and expectations. If in doubt, consult your past event logs to find out what is normal.

We have two different event ids to look at: the 529 event is generated when somebody logs onto the machine itself. This must not be an interactive logon. It can also be a logon via the network, via the web server, the ftp server or any other logon that is done either by the user himself or a process on his behalf on the local machine.

There is also the 681 event. That event is logged whenever the security authority authenticates a user. This event typically is logged on domain controllers when domain users authenticate. A domain controller can log this event even when no local logon happens afterwards. Also, as any domain controller can authenticate a user, the 681 event can occur on every domain controller. Thus, the amount of those events on a single domain controller can not reliable be used to detect the threshold. On a stand-alone server, event 681 is logged together with 529.

For our needs, this means we should monitor the 529 event if we are interested in the local failed logon activity and the 681 if our scope is the network. In the later case, it might be helpful to ensure that security events from all domain controllers are passed to a central MWAgent. Only this ensures that MWAgent has the full overview over network logon activity.

In our sample, we monitor a stand-alone server. So our filter looks like this:

Please note the area red encircled. This is the important part here. The “Fire Only if Event Occurs” setting means that there must be at least 10 failed logons within 60 seconds. If there are fewer, the filter will not apply, even though the filter condition would otherwise apply. Similarly, the “Minimum Wait Time” specifies that at least 120 seconds need to have passed since the last time this filter condition fired. Again, if the last match was more recent, the filter condition as whole does not evaluate as true. So with the above filter, we will receive a notification at most once every 2 minutes (120 seconds).

Obviously, the two global filter conditions need to be adjusted to your environment.

Detecting Suspicious Configuration Changes

There are many opinions on what a suspicious configuration change might be. In this sample, we assume we are dealing with an already configured web server. It again is a stand-alone server. There is not much need for configuration changes once a machine has reached this stage. Obviously, some of the notifications we generate here are overdone on a typical domain controller. Nevertheless, the example should provide an idea of what to look for.

Events we are interested in are these:

  • Account Management
    • 624 – User Account Created
    • 626 – User Account Enabled
    • 627 – Password Change Attempted
    • 628 – User Account Password Set
    • 629 – User Account Disabled
    • 630 – User Account Deleted
    • 631 – Security Enabled Global Group Created
    • 632 – Security Enabled Global Group Member Added
    • 633 – Security Enabled Global Group Member Removed
    • 634 – Security Enabled Global Group Deleted
    • 635 – Security Enabled Local Group Created
    • 636 – Security Enabled Local Group Member Added
    • 637 – Security Enabled Local Group Member Removed
    • 638 – Security Enabled Local Group Deleted
    • 639 – Security Enabled Local Group Changed
    • 641 – Security Enabled Global Group Changed
    • 642 – User Account Changed
    • 643 – Domain Policy Changed
  • System Events
    • 512 – Windows is starting up
    • 513 – Windows is shutting down (you will probably not see this event before the system is restarted)
    • 516 – Internal resources allocated for queuing of security event messages have been exhausted, leading to the loss of security event messages
    • 517 – The security log was cleared
  • Policy Change
    • 608 – A user right was assigned
    • 609 – A user right was removed
    • 610 – A trust relationship with another domain was created
    • 611 – A trust relationship with another domain was removed
    • 612 – An audit policy was changed
    • 768 – A collision was detected between a namespace element in one forest and a namespace element in another forest

Events in bold are uncommon on nearly all types of machines. Depending on the role a server is playing, events not shown in bold can occur as part of day-to-day operations. On such servers, they should obviously not trigger alarms. Again, on a fully configured web server in product, we would like to see neither of them.

We create two rules in MonitorWare Agent, one for the highly suspicious events and one for the others. Let’s start with the highly suspicious ones:

And this one holds the filter conditions for the other suspicious events:

In order for this rule-sets to work, we also need to tune our auditing settings. We now need to audit “System Events” and “Policy Change, too. This will lead us to these policy settings:

Sample Syslog Device Configurations

Step-By-Step Guides

Article created 2003-05-09 by Rainer Gerhards.

Sample Syslog Device Configurations

MonitorWare Agent can receive vital network status information from a variety of devices. As these devices are from many different vendors and have many different applications, it is impossible to provide detailed configuration information for all of them.

We provide configuration information for some well-known devices. Hopefully, the samples will provide some idea of how other devices might be configured.

NetGear RT314 Syslog Configuration

The RT314 supports syslog. Unfortunately, syslog messages cannot be enabled using web interface. It must be done using telnet, a command line interface.

To the best of our knowledge, the NetGear RT314 is compatible to ZyXEL Prestige 314. As far as we know, both of them operate with a version of the ZyNOS operating system that supports a menu system via telnet. As such, the description here does also apply to the ZyXEL product. There might be other routers available that base on the same operating system. If in doubt, start a telnet session to your router and check if this step-by-step guide applies to your device.

In our example, we assume the router has address 172.16.0.100. The syslog server has the address 172.16.0.4.

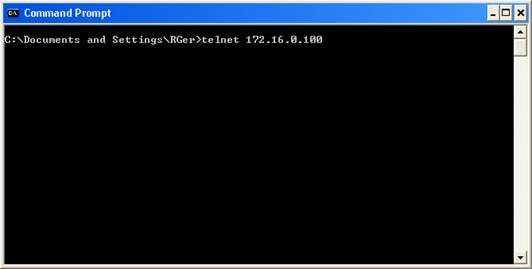
First, open a command prompt (“DOS box”). Then, type “telnet 172.16.0.100” as shown in this sample:

The router will prompt you for the password. Enter it and the following and the main menu will appear:

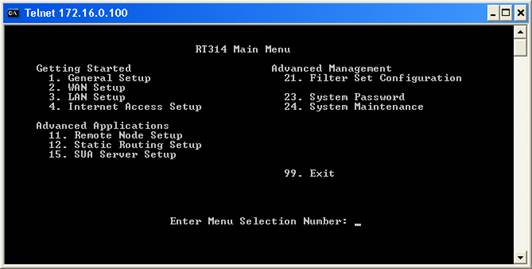
The syslog server’s address can be configured under “System Maintenance”. As such, enter 24 and press enter. The system maintenance menu appears:

There, enter 3 (as shown below) and press enter:

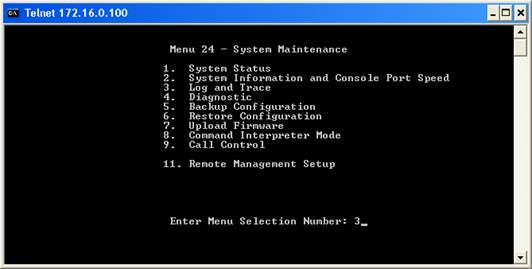
Now enter 2 and press enter. The syslog properties appear:

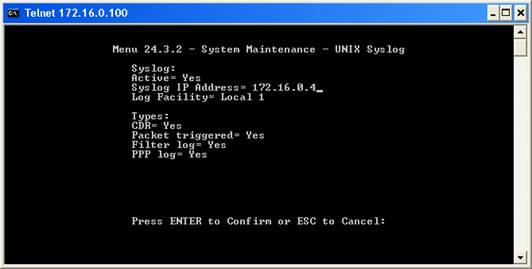
The screen shot displays the correct configuration for maximum logging. To change the properties, press enter. Each time you press enter, you will move from field to field. Once you are at the beginning of a field, you can simply type the value you would like to change. Follow the instructions on the lower left to change the configuration.

Make sure that you set “Active” to “Yes”, otherwise the RT314 will not generate syslog messages. Under “Syslog IP Address”, type the IP Address of the MonitorWare Agent. Please note that you must use an IP address – the computer name will not work. Under “Log Facility”, select the facility(Syslog Facility) the messages will be sent with. The RT314 does support only LOCAL_1 to LOCAL_7 – other facilities are not supported. If in doubt, leave this setting at “Local 1”.

Under types, select which events will be sent via syslog. All those with “Yes” configured will be sent.

Please see the RT314 manual for details.

Finally, press enter to confirm your configuration choice. This will store and active the new configuration and return you to the “Log and Trace” menu. There, press, ESC to return to the “System Maintenance” menu and ESC once again to return to the main menu. There type “99” and enter to exit the RT314 configuration utility.

Please note that telnet will display a “Connection to host lost” message – this is no error but the expected behavior.

This procedure concludes the configuration of the RT314. It will now generate syslog messages that can be received by the MonitorWare Agent.

HP JetDirect Interfaces

JetDirect interfaces are network print server. They are used internally in printers like the successful HP LaserJet series. They JetDirect is also available as external boxe to connect any brand of printer to the network.

The HP JetDirect interfaces support syslog protocol. To the best of our knowledge, they send status as well as print job information via syslog protocol. Status notifications include things like toner low or out of paper. Print job information includes data on completed an aborted print jobs.

The JetDirect Interface can be configured via the so-called HP JetAdmin program. In our sample, we use the web-based JetAdmin tool (HP is actively promoting the web version today).

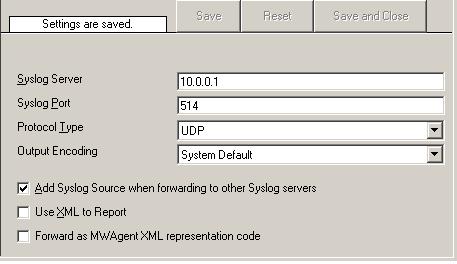
In our sample, we have a very basic configuration. The HP Web JetAdmin is installed on a server with the surprising name “SERVER”. The printer we are configuring has the also surprising name “HP LaserJet 4000”. The syslog server service is running on a machine with IP 10.0.0.1. In the sample, we configure the JetDirect interface to send syslog messages to this central server. We assume that you are already familiar with the HP Web JetAdmin program. Please note that the menus shown below can be slightly different depending on the HP Web JetAdmin version and the actual printer or JetDirect Interface model.

First, start the HP Web JetAdmin by pointing your browser to http://server:8000. This is the default address for Web JetAdmin. This will bring up the HP web interface.

Click on the jetadmin logo and click the continue button that pops up. Please note that depending on your browser settings a number of Java security warnings pop up. You need to allow execution of the applets, otherwise JetAdmin does not work. Continue until you reach the main menu:

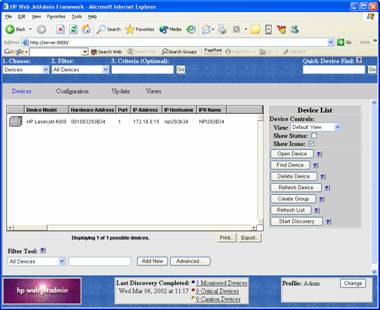
Double-click the printer. A screen like to following appears:

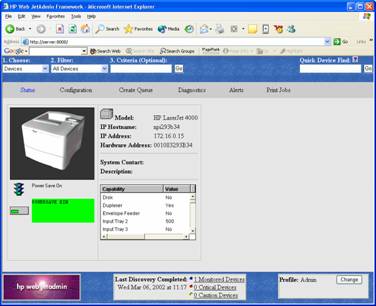
Click on the “configuration” tab. Then, select “network” in the left-hand menu.

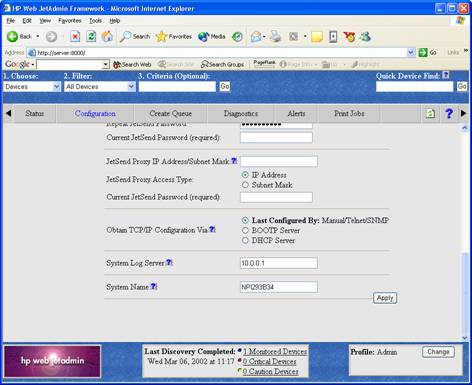
Find the “System Log Server” entry. Here, you must enter the IP address of the system the syslog server service is running on.

After doing so, press “Apply”. You will be directed to a “success” page:

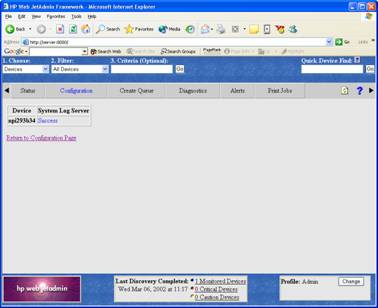
The syslog server address is now set and syslog message logging activated. You can now either return to the configuration menu or select any option in the menu available.

This procedure concludes the configuration of the HP JetDirect Interface. It will now generate syslog messages that can be received by the syslog server service.

Cisco PIX

Cisco’s PIX is a well known firewall appliance. It is highly scalable, from a small office or home environment to an enterprise environment. PIX is very widely used.

Cisco’s PIX supports syslog over both TCP and UDP. While WinSyslog supports both of these protocols, we will focus on UDP in our step-by-step guide as this is the standard protocol. Therefore, if you would like to consolidate logs from multiple devices and one of them is PIX, you will probably take the syslog over UDP route.

PIX can be configured using either a command line interface or the so-called PIX Device Manager (PDM), an HTML configuration application that comes with the PIX. Typically, PDM is used and as such we focus on it in our step-by-step guide.

First, start PDM by pointing your Java-Enabled web browser to the PIX. Important: Use a HTTPS URL. This is badly documented by Cisco. Using http instead of https will cause your connection to fail! If, for example you PIX has the internal IP address of 172.16.0.1, use the following URL:

https://172.16.0.1

Once this is done, the PDM opens. Most probably, a number of Java security and certificate related questions open. Please allow the product to proceed. Also, a number of browser windows open. Finally, you should see a window similar to the following:


PDM Start Screen

Now, switch to the system properties tab:

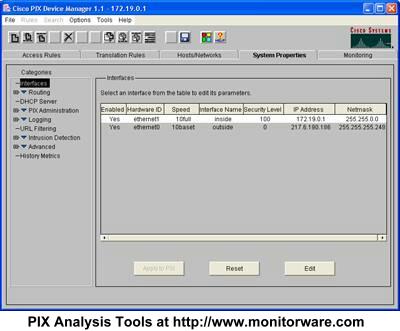
Next, expand “Logging” in the treeview and then select “Logging Setup”. A screen similar to this one appears:

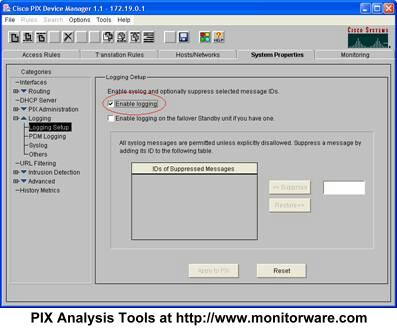
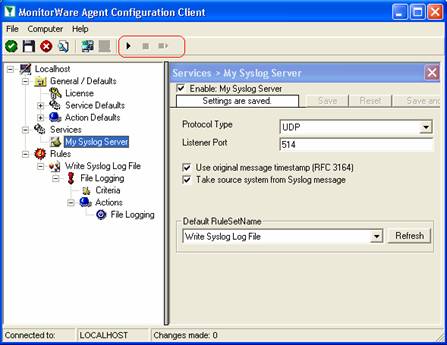
Make sure the “Enable Logging” box is checked as in the screenshot. Then, select “Syslog” in the treeview. This brings you to the page where syslog servers can be configured:

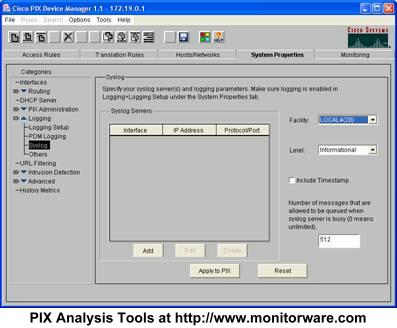
In the above example, no server is configured so far. This is the default setting for a freshly installed PIX. We will now configure a syslog server at IP 172.19.0.2. Press “Add” and the following dialog appears:

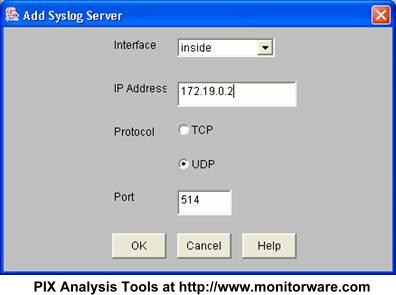
Typically, your syslog server will reside on the internal network. As such, leave the interface at “inside”. Then enter the IP Address of your syslog server into the field “IP Address”. In the screenshot, this has already been done. Next, make sure UDP is selected as protocol. The port value of 514 is the default and also the standard. There should be little need to modify it. If you do, make sure you fully understand the implications as a wrong port can disrupt traffic.

Of course, if you would like to use TCP logging, you can do so. However, in this case MonitorWare Agent must be configured to have at least one syslog listener running at the specified TCP port. Also, please note that other products do typically not support syslog over TCP and as such, messages from these devices cannot be received by a syslog over TCP receiver.

After configuring the syslog settings, be sure to press OK to return to the PDM main screen:

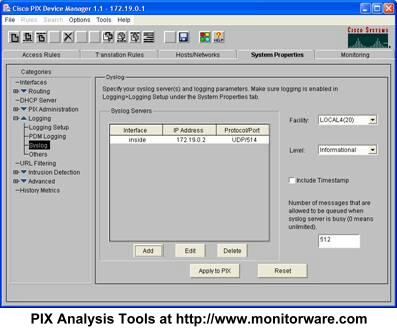
Here, you can modify the syslog facility and level as well as include a PIX timestamp – see settings on the right.

Important: the configuration you have created has not been saved so far! To save it, you must press the “Apply to PIX” button. Depending on your configuration and PIX model, the “Apply” can take some time.

Once the “Apply” is finished, you see the following screen:

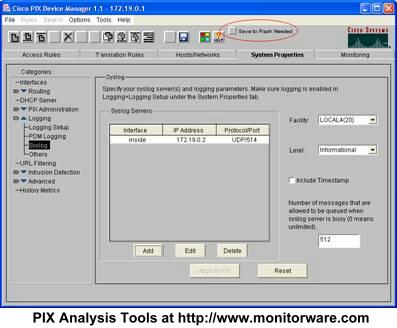
Please note the new “Save to Flash Needed” button. This one can easily be overlooked. When it is present, a new PIX configuration has been created but not permanently saved on the PIX. So you need to press “Safe to Flash Needed” in order to complete your configuration! If you forget the step, the PIX will either not forward syslog messages at all or stop doing so after the next PIX reboot.

Make sure that you see the following dialog before continuing:

This concludes the basic configuration of your PIX. You should now receive syslog messages on the configured syslog server. You can now close Cisco’s PDM. Of course, you can return at any time to change configuration settings or enable syslog messages to additional syslog servers you have created.

Other Cisco Products

All Cisco products we know support logging via syslog. This article covers all devices that use IOS (e.g. routers and switches). Unfortunately, this is not a full step-by-step guide as the others are. We are working to create a more verbose version of the Cisco guide – but we still decided to leave it in here, as it possible is useful for many users.

Syslog logging needs both to be configured as well as turned on. To configure, you must be in enable mode (see your Cisco documentation on how to enter enable mode). Then switch to configuration mode (the command is “configure terminal” or “conf t” as abbreviation). First of all, you need to specify the syslog host that the messages should be send to. This is the name or IP address of the system MonitorWare Agent is running on. Though a DNS-resolvable name can be used, we strongly recommend using the IP address directly. If your machine has the address “195.123.45.6” then the command is “logging 195.123.45.6”. Next, logging needs to be turned on. This command is “logging on”. Then exit from configuration mode and save the new configuration.

This setting enables syslog logging for common messages (e.g. router configuration and startup). If you would like to have traffic-related logging activated, you need to create traffic filter rules that specify the “log” option and apply them to the interface you are interested in.

More and detailed information can be found at Cisco’s web site under the “logging” command. Please note: this link is to one of Cisco’s product documentation areas. You might want to search the Cisco site to find information specific to the product (router, switch, firewall, etc.) you are using.

Creating a simple Syslog Server

Step-By-Step Guides

Article created 2003-04-30 by Rainer Gerhards.

Creating a simple Syslog Server

In this scenario, a simple syslog server will be created. No other services are configured. The syslog server will operate as a standard syslog server on the default port of 514/UDP. All incoming data will be written to a single text file.

Step 1 – Defining a Rule Set for File Logging

The rule set specifies what action to carry out. You might be tempted to define the service first, but starting with the rule set makes things easier as it already is present when the service will be defined later and needs to be bound to a rule set.

To define a new rule set, right click “Rules”. A pop up menu will appear. Select “Add Rule Set” from this menu. On screen, it looks as follows:

Then,a wizard starts. Change the name of the rule set to whatever name you like. We will use “Write Syslog Log File” in this example. The screen looks as follows:

Click”Next”. A new wizard page appears:

There,select file logging. Do not select any other options for this example. Also, leave the “Create a Rule for each of the following actions” setting selected. Click “Next”.

This is just a confirmation page. Click “Finish” to create the rule set.

The wizard closes and the client shows a newly created rule set.

As you can see, the “Write Syslog Log File” rule set is now present. Please expand it in the tree view until you have the following screen contents:

As you can see, we have a “File Logging” action configured. We will review the settings just for your information. Click on “Filter Conditions”:

As you can see, none of the filter conditions are enabled. This means that the all information units (incoming messages) will be matched by these filter conditions. As such, the rules for the “File Logging” action will always be carried out.

Please note that this also means that all syslog priorities and facilities will be written to the same file.

Now let us check the “File Logging” action itself. Please select it in the tree view:

As you can see, it has been created with the default parameters. Each day, a file will be created in the C:\temp directory and its base name will be MonitorWare. It will include all information items in the file.

If you would like to store it into a separate directory or change the file name, here is the place to do it. Important: please make sure the directory you specify exists! If it does not yet exist, please create it before you start the service. If the directory does not exist, the service is not able to store any files.

In our example, we would like to save it to “c:\logfiles” with a base name of “syslog”. Therefore, we change these properties:

After doing so, you will notice the yellow text on top of the window. It tells you that the configuration changes have not yet been applied. To do so, press “save”.

Now you have a workable rule set for logging incoming messages to a text file.

Step 2 – Create a Syslog Server Service

Now we need to define a syslog server service. A syslog server is also sometimes called a “syslog daemon”, “syslogd” or “syslog listener”. It is the process that receives incoming messages.

To define it, right click on “Services”, then select “Add Service” and the “Syslog Server”:

Once you have done so, a new wizard starts:

Again, you can use either the default name or any one you like. We will use “My Syslog Server” in this example. Leave the “Use default settings” selected and press “Next”:

As we have used the default, the wizard will immediately proceed with step 3, the confirmation page. Press “Finish” to create the service. The wizard completes and returns to the configuration client. There, you will see the newly created service beneath the “Services” part of the tree view:

To check its parameters, select it:

As you can see, the service has been created with the default parameters. As such, it operates as a RFC compliant standard syslog server.

Please note that the “Write Syslog Log File” has been automatically assigned as the rule set to use. This is the case because we already created it and it is the only rule set. By default, the wizard will always assign the first rule set visible in the tree view to new services. If another one is to be used, you need to change it to the correct one here in the service definition.

Also, ote that the wizard uses the default properties from the “Service Defaults”. Obviously, if these are changed, the default properties for new services will differ.

This procedure completes the configuration of the syslog server.

Step 3 – (Re-) Start the MonitorWare Agent Service

MonitorWare Agent cannot dynamically read changed configurations. As such, it needs to be restarted after such changes. In our example, the service was not yet started, so we simply need to start it. If it’s already running, you need to restart it.

Service control can be done with both the respective operating system capabilities (like service manager MMC) or with the configuration client. These are shown in the red surrounded area in the following screen shot:

The buttons resemble Windows service manager – start, stop and restart. In this example, stop and restart are grayed out because the service is not running.

After service restart, the new definitions are active and MonitorWare Agent is ready to accept and store incoming messages.

Step 4 – Configure your Syslog-Enabled Devices

Even though MonitorWare Agent is now ready, it can only receive messages if some devices send them. Remember, syslog is a protocol where the server is passively waiting for incoming messages. As long as no device sends message, the syslog server will not log anything.

Since there are a large variety of devices, we unfortunately cannot provide device specific instructions. However, almost all devices need to be configured with their specific configuration tool. Typically, only two settings need to be made: one to activate syslog messages at all and one with the syslog server IP address or name.

For some devices, we have step-by-step guides. Please read “Sample Syslog Device Configurations” for further details.

Remember: the computer running MonitorWare Agent now acts as a syslog server. As such, you need to find out its IP address or name and supply it to the device as the syslog server. Please note that not all devices can operate with computer names. Use the IP address, if in doubt.

400-201 Study Guides   ,
70-980 Study Guides   ,
640-911 exam   ,
SSCP certification   ,
70-177 Brain dumps   ,
220-901 pdf   ,
2V0-621 test   ,
70-410 Brain dumps   ,
640-916 certification   ,
1Z0-051 Study Guides   ,
220-801 Exam   ,
LX0-104 certification   ,
1Y0-201 pdf   ,
OG0-093 certification   ,
1V0-601 certification   ,
LX0-104 test   ,
350-060 exam   ,
200-101 pdf   ,
1z0-808 Study Guides   ,
300-209 dumps   ,
PMP certification   ,
EX300 test   ,
JN0-102 certification   ,
70-177 pdf   ,
640-916 pdf   ,
000-104 test   ,
CAS-002 dumps   ,
300-075 certification   ,
350-001 test   ,
100-101 test   ,
70-533 certification   ,
2V0-621D test   ,
070-461 test   ,
640-692 Study Guides   ,
70-413 Study Guides   ,
70-411 test   ,
1Z0-051 dumps   ,
200-310 pdf   ,
70-463 Study Guides   ,
700-501 certification   ,
1Z0-804 exam   ,
810-403 dumps   ,
70-347 pdf   ,
OG0-093 dumps   ,
352-001 pdf   ,

“A complete step by step guide on setting up EventLogMonitor Service

How To setup EventLogMonitor Service

Article created 2003-02-24 by Rainer Gerhards.
Last Updated 2005-08-16 by Timm Herget.


Note: This guide was initially written for MW Agent, but the steps are the same in EventReporter.

1. First, right click on “Services”, then select “Add Service” and then “Event
Log Monitor”:

2. Once you have done so, a new wizard starts.

If the following Popup appears, please select “Create Service”:

Again, you can use either the default name or any one you like. We will use
“My Event Log Monitor” in this sample. Leave the “Use default settings” selected
and press “Next”.

3. As we have used the default, the wizard will immediately proceed with step
3, the confirmation page. Press “Finish” to create the service. The wizard
completes and returns to the configuration client.

4. Now, you will see the newly created service beneath the “Services” part of
the tree view. To check its parameters, select it:


As you can see, the service has been created with the default parameters.

Note
1:
The “Default RuleSet” has been automatically assigned as
the rule set to use. By default, the wizard will always assign the first rule
set visible in the tree view to new services. In our case, this is not correct
and will be corrected soon.

Note 2: If you want to generate reports (using Monilog) on the data via this service i.e. EventLogMonitor, then you have to press
the “Configure for Monilog” button and make the settings as shown in the screen-shot.


Note 3: If you want to generate reports (using MonitorWare
Console) on the data via this service i.e. EventLogMonitor, then you have to
uncheck the “Use Legacy Format” option. This is recommended. If you don’t
uncheck this option then meaningful reports aren’t generated (i.e. reports are
not properly consolidated by MonitorWare Console).

5. Now you must differentiate between clients and central hub server. In
clients use the “Forward ” RuleSet we have created in Step 2, select it as rule
set to use. In central hub server select the “Database Logging” RuleSet we have
created in Step 3. Leave all other settings in their default.

Clients:

Central hub server:

6. Finally, save the change and start MonitorWareAgent. This procedure
completes the configuration of the syslog server.

MonitorWare Agent cannot dynamically read changed configurations. As such, it
needs to be restarted after such changes. In our sample, the service was not yet
started, so we simply need to start it. If it already runs, you need to restart
it.

With step 5 the client machines configuration has finished. All the next
steps are only concerned with the central hub server.