How To Schedule Reports with MonitorWare Console 2.0
Article created 2004-04-14 by
Tamsila-Q-Siddique.
Reports in MonitorWare Console can be scheduled using Job
Manager. Job Manager is a Window Service that runs in the background and
generates the reports according to user-defined schedule. It also has the
capability of sending the generated reports to specified recipients via email.
The settings of this service are done from the MonitorWare Console Client. This
client will only be available to you if you have a valid license for “Windows
Reporting Module” or “PIX Reporting Module” or both. Once you open up Job
Manager Settings form as shown in Figure 1, you will be able to schedule all of
the reports (whether PIX or Windows) but only those reports will be generated whose license is valid. So,
for example, you have PIX Reporting Module license with you, then you will be able to access the screen shown in Figure 1 and
configure all of the reports but Job Manager will only generate those reports that are
PIX and will not generate any of the configured Windows Report since you dont have
the license for it.
Profiles have been introduced in the Job Manager. You can associate different reports to different profiles and they will be generated according to your specified time
and date. You can create as many profiles as you like in Job Manager which
means that now, you can generate the same report as many times as you would
like in one day.
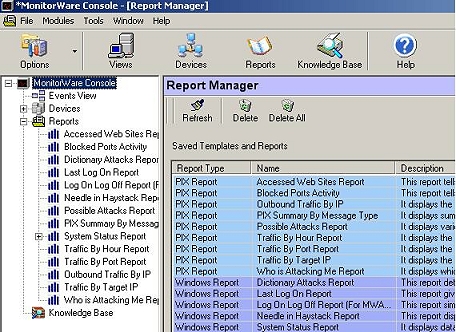
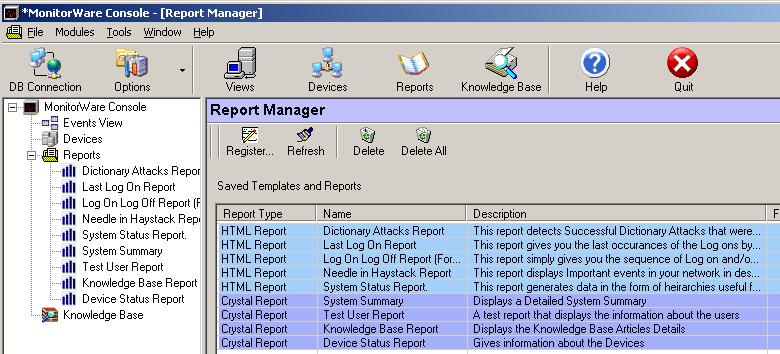
Job Manager can now
also generate those reports that you have saved in the Reporting Module by applying various
filters. The reports that are indented in Figure 1 are those reports that had been
saved using Report Manager.
With Job
Manager you can not only schedule the reports such that they are saved on the
hard disk but also you can schedule the reports such that they are sent via
email to specified recipients.
1. Click “Options” in the main tool bar
of MonitorWare Console and then click on “Job Manager Settings…” You will see a dialog
box as shown below:
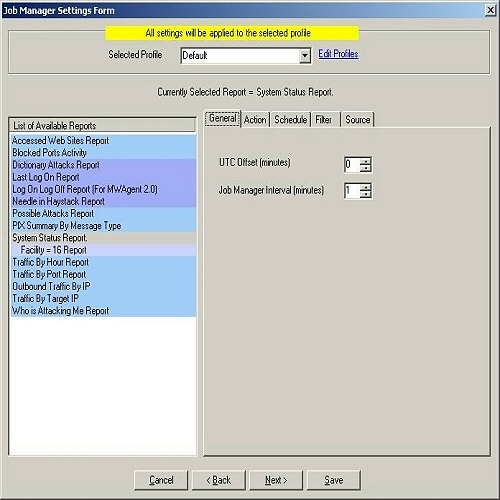
Figure 1: Job Manager Settings Form
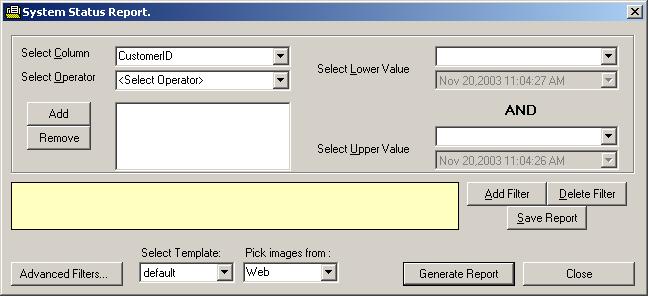
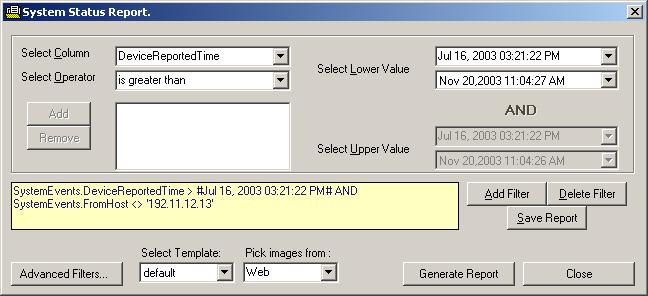
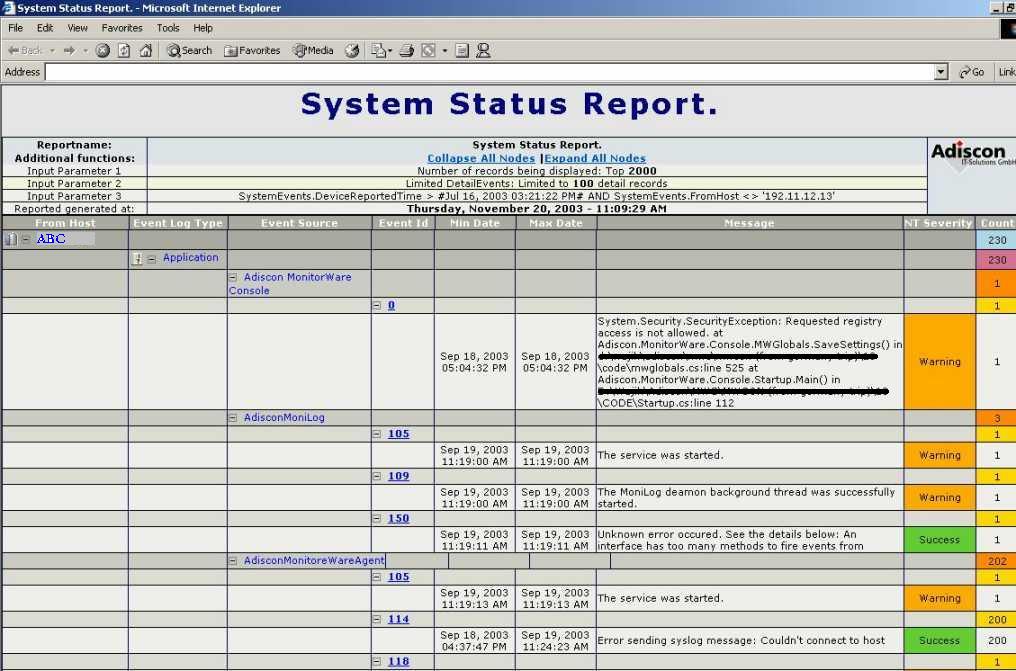
2. Click on the report that you want to schedule. In this example I will
illustrate the scheduling of “System Status Report”.
3. Click on “System Status Report” on the left hand side.
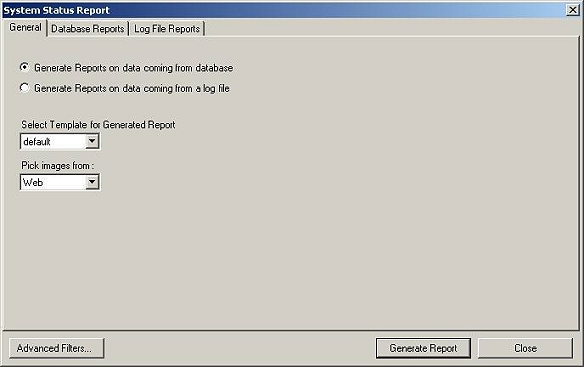
4. On the right hand side, in the general tab set the
UTC offset and Job Manager Interval. If you have logged the records in the
database with local time, then you dont need to set this UTC value. It will stay
at 0. The Job Manager Interval can be set over here, by default it is 1
minute. This is the wake up time for Adiscon MWCJobManager. This specifed interval invokes JobManager and it looks for the scheduled report,
if it’s time to run the scheduled report then the report is generated otherwise it goes into the
sleep state until it’s invoked again. The settings are shown in figure 1.
5. Once done click on Action tab or press Next button.You will see as below:
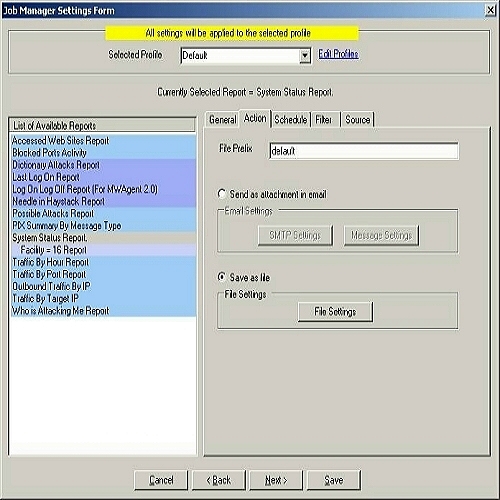
Figure 2: Job Manager Settings Form – Action Tab
6. Set the File Prefix. In this case, I leave it as default.
7. You have got two options over here. Either you can save the report on the hard disk or
you can send an email when the scheduled time is met. If you select “Save as
file” radio button, then the “File Settings” button will be enabled and on the
other hand, if you select “Send as attachment in email” radio button, then both
“SMTP”
Settings and “Message Settings” buttons will be enabled. You can either
carry on with Step 8 or Step 9 depending upon your requirements.
8. If you want to save the report on the hard disk at the scheduled time then
select “Save as file” radio button and click on “File Settings” button. Once you
do that, you will see the following dialog box:
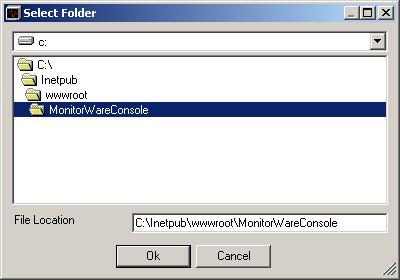
Figure 3: File Settings – Select Folder Form
You can select any path over here that you feel like. But if you want to view this report
on the web, you will have to create a folder under Inetpub -> wwwroot.
In this case, I have created a folder named “MonitorWareConsole” and have
selected the same in the above dialog box. Click OK, once you have done that.
9. If on the other hand, you are interested in the report being emailed to
some specified recipient at the specified time, then you should select the radio
buttion labeled as “Send as attachment in email”. After Selecting it, click on
SMTP Settings. It will show you the following dialog box:
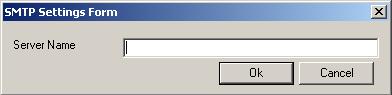
Figure 4: SMTP Settings Form
Enter your SMTP server name. Click OK. Then click on “Message Settings”
button. You will see a dialog box similar to the one shown below:
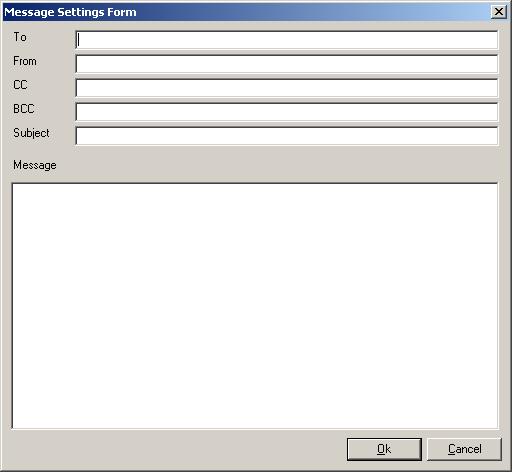
Figure 5: Message Settings Form
Fill in these values and click OK when done.
10. After setting the “Action” tab according to 8 or 9 above, click on Schedule tab or press Next
button. Once done, you will see following dialog box:
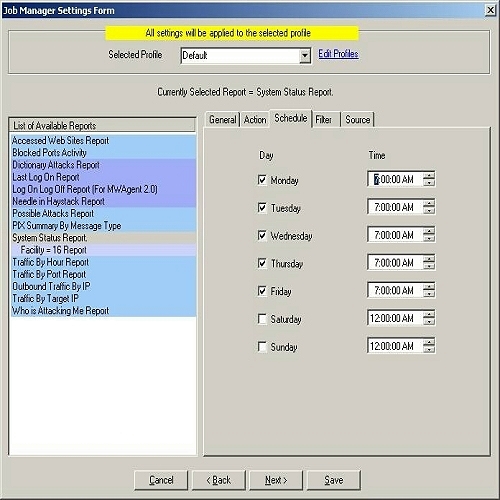
Figure 6: Job Manager Settings Form – Schedule Tab
For example, you can tell Job Manager to generate the System Status report at 7:00 AM
on Monday, Tuesday, Wednesday, thursday and friday. Whenever you come to office, you will see a complete report on your system on the above mentioned days and you can take necessary actions
right away.
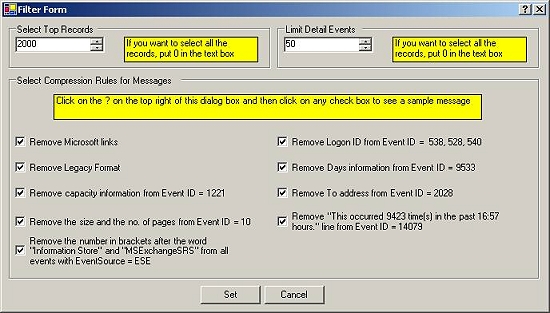
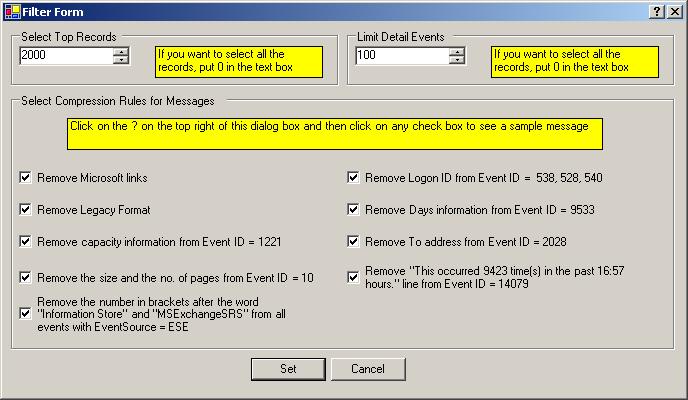
11. After setting the “Schedule” tab according to 10, click on Filter tab or press Next
button. Once done, you will see following dialog box:
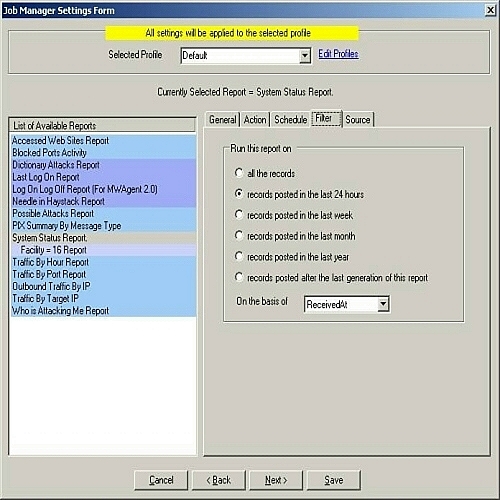
Figure 7: Job Manager Settings Form – Filter Tab
You can select one of the above 6 mentioned filters based on your
requirements.
12. After setting the “Filter” tab according to 11, click on Source tab or press Next button. Once done, you will see following dialog
box:
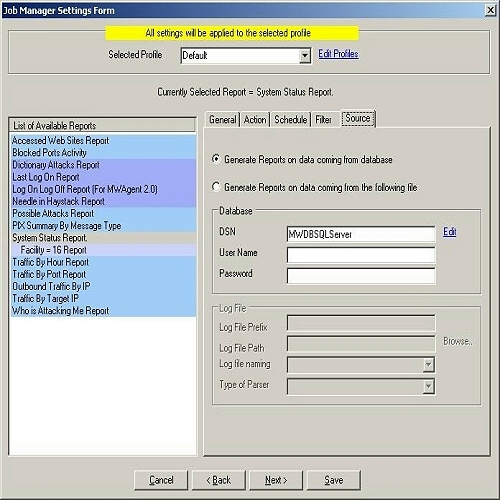
Figure 8: Job Manager Settings Form – Source Tab (Database option checked)
You have two options over here. Either you can generate the report from a database or you can use log files i.e. these
two options are mutually exclusive. If you select “Generate Reports on data coming from database” radio
button, then the schedule reports would be generated on the basis of the
underlying database. We have provided this option so that if your main
data on which you want to generate reports is present in some other database, then
you can give its DSN over here. And If you select “Generate Reports on data
coming from the following file” radio button, then the reports would be generated on
the basis of the configured log files and not on
any database. You can either carry on with Step 13 or Step 14 depending upon
your requirements.
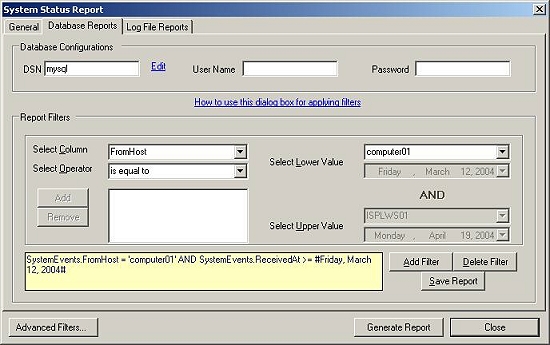
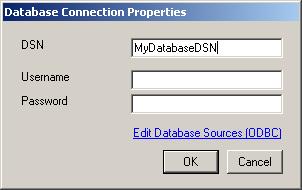
13. If you want to generate the report from the
underlying database or from any other database then you select “Generate Reports on data coming from database”
radio button. Once this option is checked then provide
the DSN, User Name and Password as shown in Figure 8.
Note: If you had
created the DSN with the “Windows Integerated Security”, then you don’t need to
give any User Name or Password. We highly recommend to create a specific account with very limited permissions if
you store a password. This account does only need to have “select” permissions.
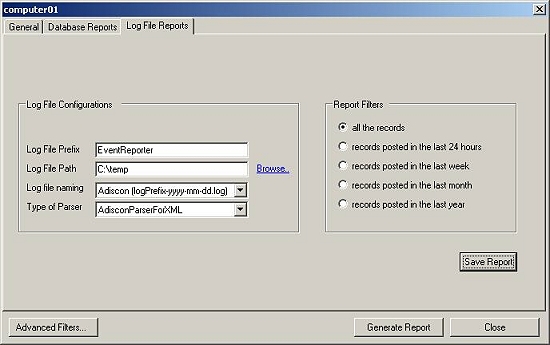
14. If you want to generate the report from the log files
then you select “Generate Reports on data coming from the following file” radio button. Once you
do that, provide all the required fields as in the screen-shot shown below:
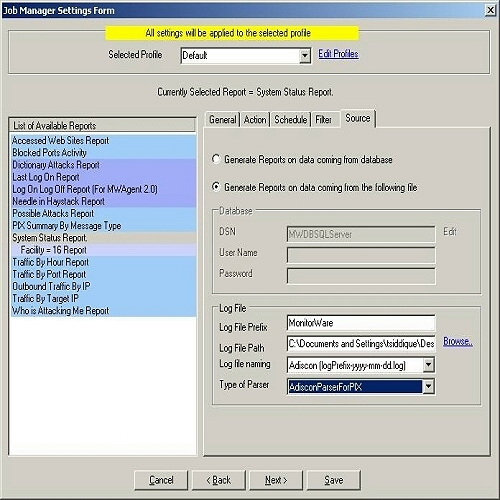
Figure 9: Job Manager Settings Form – Source Tab (Log File option checked)
Note: If you are
interested in Windows Report then choose AdisconParserForXML. And if you are interested in PIX Reports
then choose AdisconParserForPIX. The Specific Logfile Format has been given
below:
Format of the Log File for Window’s Report – If you want to generate the above Windows’ Reports on log files, then
its absolutely necessary that the log files are in a specific format. Only the
following two check boxes in the “Write to File Action” of EventReporter,
MonitorWare Agent or WinSyslog should be checked.
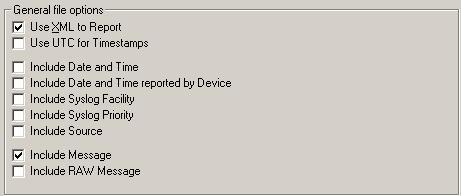
Figure 10: Write to File Action of EventReporter, WinSyslog and MonitorWare Agent.
If any of these check boxes is not checked or any other check box is checked apart from the above shown, then
the report will not be generated. If the log file entries are not in the correct
format, then MonitorWare Console will write error messages for first 50 lines in
Windows Event Log and will ignore them for the generation of report
Note: Do NOT check “Use Legacy Format” in your EventLogMonitor Service. If you check this, the records
can not properly be compressed and you will receive a very large report.
Format of the Log File for PIX Reports – If you want to generate the above PIX Reports on log
files, then its absolutely necessary that the log files are in a specific
format. Only the following check boxes in the “Write to File Action” of
EventReporter, MonitorWare Agent or WinSyslog should be checked.
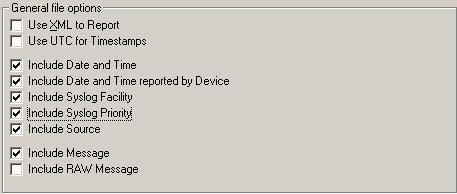
Figure 11: Write to File Action of EventReporter, WinSyslog and MonitorWare Agent
15. Once done, click on “Save” button. All the settings will be saved permanently. If the Job Manager Service is running, it will give you
a message saying that it would restart the service so that new settings could take effect.
If on the other hand, the service in the background is not running, it
would give you a message saying that you have to manually restart the service. You
can start the service manually by going to Control Panel -> Administrative Tools
-> Services and start AdisconMWCJobManager
Service.