Centralized logging in a hybrid environment (Windows/Linux)
Created 2011-03-11 by Florian Riedl
This article will describe how to setup centralized logging in a hybrid environment. Basically, we will have various major steps, that show different configuration of several clients, which forward their log data to a central loghost. There, everything will be stored into a database and processed further for alerting.
To describe the situation basically, we want all machines on the network send their log data to a central syslog server (if possible). For the central log server we take a windows machine running MonitorWare Agent (www.mwagent.com). Here we can receive syslog, monitor local log files and the Windows EventLog. Data shall be stored into a database and several email alerts shall be configured. The other steps describe the configuration of simple Windows workstations and servers, as well as Linux servers.
For TCP transmission we will use port 514 (default) for UDP and port 10514 for TCP. We want to use TCP mainly, because it ensures the transmission of the syslog messages. This is due to UDP being connectionless and thus it can occur (and will) that messages get lost.
The Client machines in this example consist of several different types of machines. We have regular Windows Workstations. Here we will use EventReporter (www.eventreporter.com). In addition to our central server, we have some other Windows Servers which will get MonitorWare Agent as well and some Linux machines which have rsyslog (www.rsyslog.com) installed. These machines will send their log messages via TCP syslog to the central server.
Additionally to these clients, we will mention some other devices and appliances (just roughly), like firewalls, switches and routers.
Step 1:
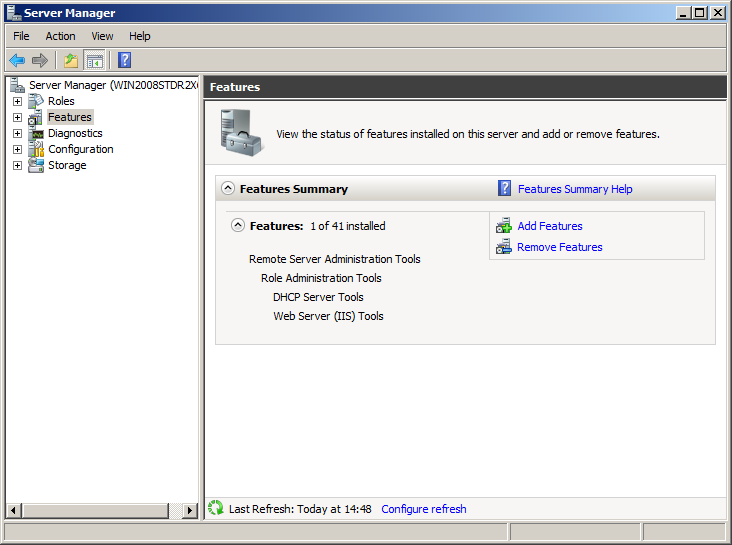
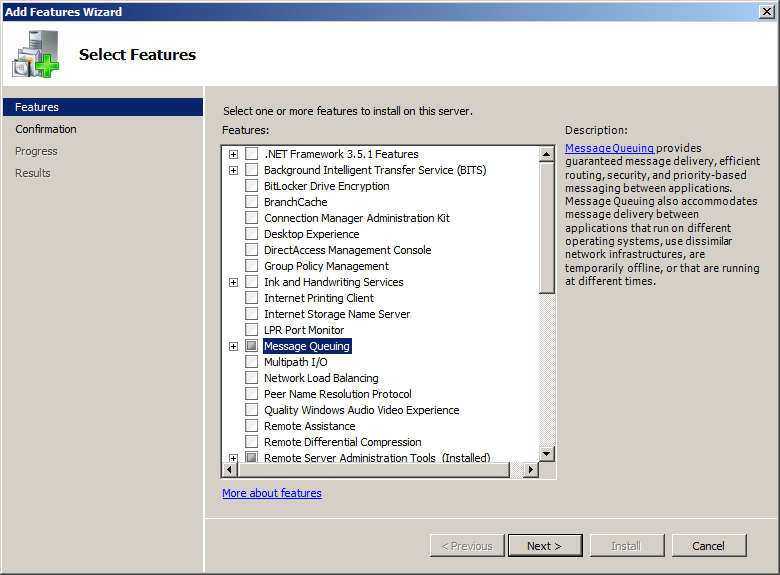
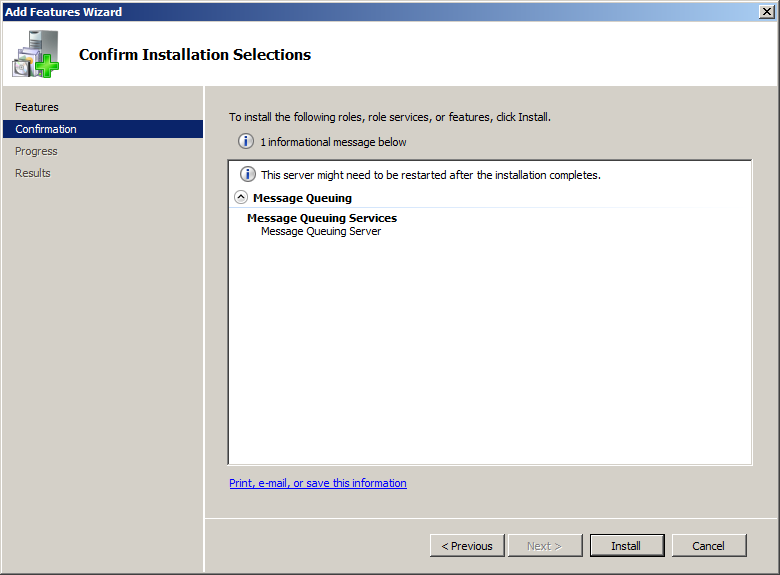
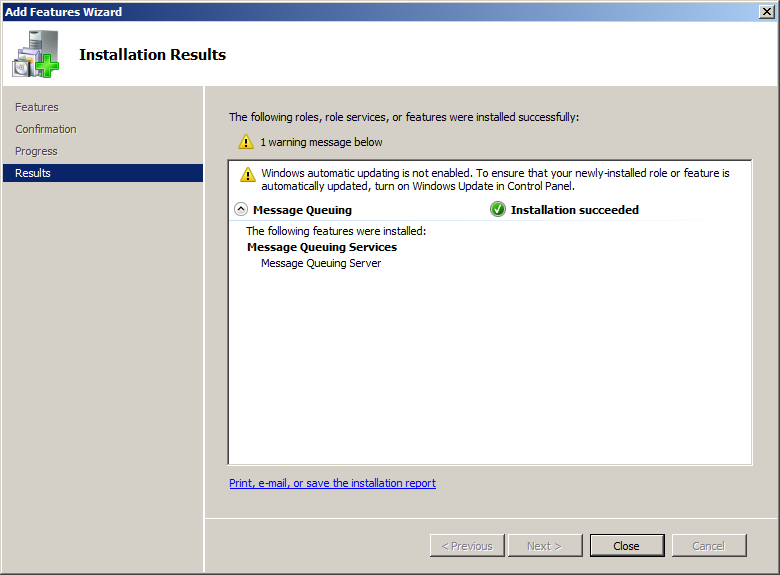
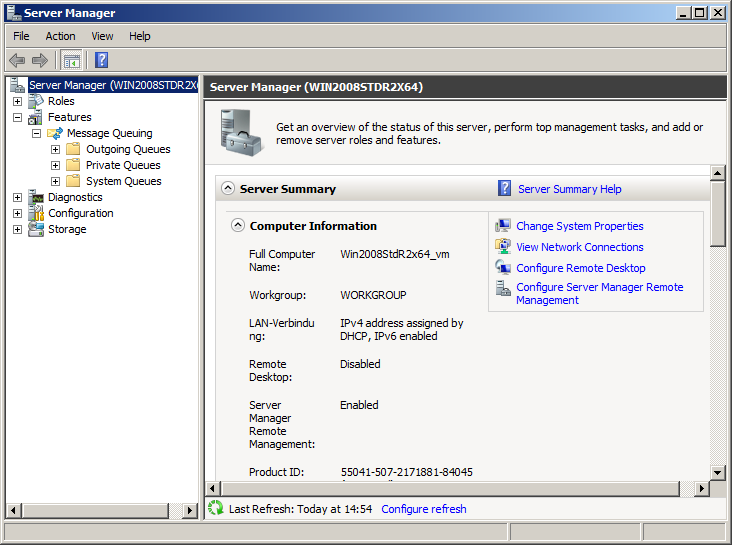
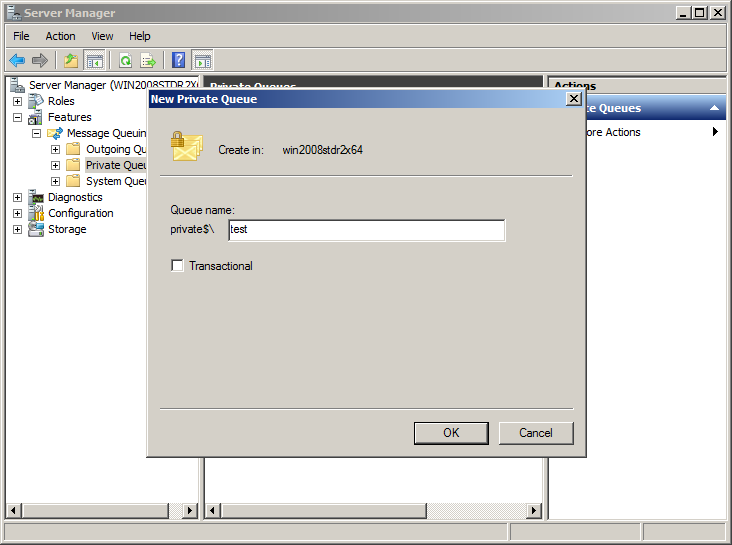
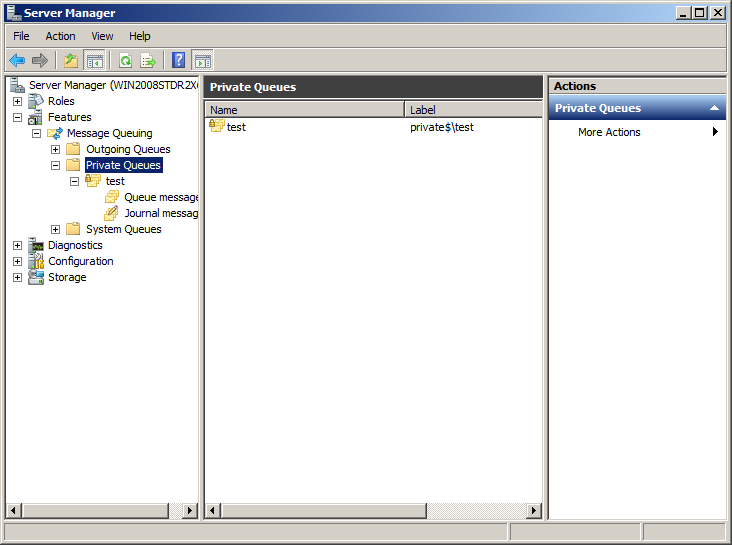
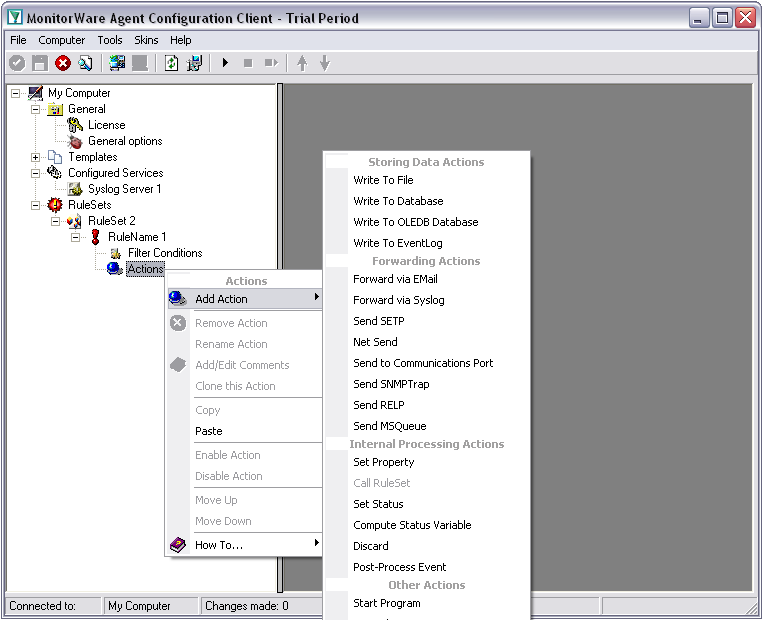
This is the first and biggest step. We will configure the central server first. The reason is simple. If this is already running, we can setup the clients and it will directly start logging everything. We assume, this is a Windows Server where MonitorWare Agent is installed. The central log server shall provide the following functionality:
- syslog receiver with TCP (for devices that can send TCP syslog)
- syslog receiver with UDP (for devices that can only send UDP syslog)
- monitor the local Windows EventLog
- monitor local textfile-logs
- store all log messages into a database
- send email alerts to an admin on error or critical log messages
Step 2:
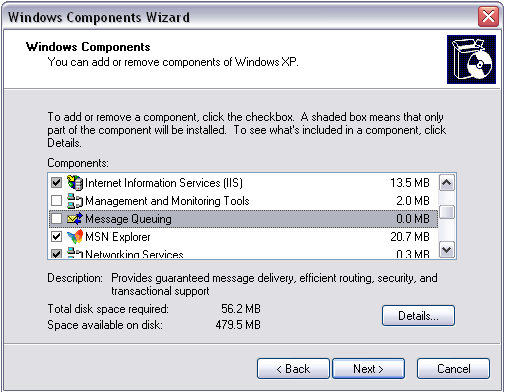
In step 2 we will set up the regular Windows clients. These are usually the workstations the people work on. We will use EventReporter here. It can pull all log messages from the Windows EventLog and forward them via TCP syslog. Thus the following functionality is mandatory:
- monitor the local Windows EventLog
- forward all log data via TCP syslog
Step 3:
Now we will configure the other Windows servers. Again, we will use MonitorWare Agent because it has the most functionality. We need the following functions to be setup here:
- monitor the local Windows EventLog
- monitor local textfile-logs
- forward all log data via TCP syslog
Step 4:
Now we get to the Linux servers. Here we need to use a completely different product – rsyslog. For a first-time user, this might look a bit strange. The configuration we want to have here needs the following:
- monitor local log messages
- monitor local textfile-logs
- forward all log data via TCP syslog
Step 5:
This is rather just a note on other devices and appliances that are not yet covered. Often devices (like routers, firewalls or switches) have the possibility to send log data to a syslog server. Usually, this only works via UDP and some machines are even capable of sending logs via TCP. Since there is such a huge mass of different systems and devices, we cannot give correct steps for everything. Please refer to the user manual that came with the device or contact the manufacturer for information about how to configure the devices for sending syslog.
If you already know how to configure it, let it send it’s log messages to the central server on port 514 for UDP or (if possible) port 10514 for TCP.
Conclusion
We now have a setup that stores all the log data that machines on the network will generate to a central database for storage. Most of the clients on the network send their log data securely via TCP to the central log storage. Some machines were rather quick to set up, others needed more effort. Usually the effort rises with the amount of features that will be used. Thus we thought of this setup to be quite simple.
If you have any remarks or ideas of improvement for this guide, please let us know and send an email to info@adiscon.com.