How to setup File logging in MonitorWare Agent to consolidate Webserver logs and view them in phpLogCon.
Article created 2008-10-05 by Andre Lorbach.
This article will help you to setup an environment where you can store weblogs from your webserver at a central place using MonitorWare Agent, and view and search them using phpLogCon.
You can download a preconfigured configuration from this link and import that into your own system. The configuration sample contains comments for better understanding. MonitorWare Agent Client can import the XML/REG configuration file via the “Computer Menu”.
Table of Contents
1. Requirements
1.1 About the requirements
1.2 Installing and configuring WAMP
1.3 Installing MYSQL ODBC Connector
2. Installing and configuring MonitorWare Agent
2.1 Download and Install MonitorWare Agent
2.2 Setup Processing RuleSet
2.2.1 Setup Database Logging
2.2.2 Create the Database Action in MonitorWare Agent
2.3.1 Setup File Logging
2.4 Add File Monitor Service(s)
2.5 Starting MonitorWare Agent and verifying the configuration
3. Install and Setup phpLogCon
3.1 Download and copy phpLogCon to the right location
3.2 Install and configure phpLogCon
Final Thoughts
1. Requirements
1.1 About the requirements
| If you already have a web server with PHP support and MYSQL Server running, you can skip step 1.1 and 1.2. This can be done with Internet Information Server, but this article focuses on using Apache to do the job. There is another article underway which describes IIS. So in order to setup phpLogCon later, you will need a web server with PHP support and a MYSQL Server with an administration interface. For these tasks, we recommend the following open source applications:
You can install and configure all these applications separately, but it is much easier to get WAMP for Windows. WAMP means Apache, MYSQL, PHP on Windows and combines all applications with a default configuration. This results in a system which can be used out of the box. So you do not need to worry about the Apache or MYSQL configuration, you just install WAMP first. Download the latest WAMP Version from here: |
1.2 Installing and configuring WAMP
 After you downloaded WAMP, start the installation and follow the instructions. After you downloaded WAMP, start the installation and follow the instructions.Make sure you do not have a web server or MYSQL Server already installed because this could result in conflicts. Most often Microsoft ISS is already installed on the Windows platform. If so, there is no need to install WAMP, but you still need MySQL and php for IIS. This is described in another guide. I will use the default installation location in this article which is C:\wamp. |
| Back to Top |
 Once the Installation is finished, a new Icon appears in Windows Icon tray. Click it, and choose “Localhost” from the menu to verify if the installation was performed successfully. If it was, you should see a web site looking like the one on the right. To check if your MYSQL is running, click on the phpMyAdmin Menu button in the WAMP Menu, and login with the username “root” and no password – if you are asked for a login. |
1.3 Installing MYSQL ODBC Connector
 If you intend to store messages in MYSQL database, you need to install the MYSQL ODBC Connector. Otherwise you can skip this step. MonitorWare Agent will need a MYSQL ODBC driver in a later step in order to write into the MYSQL database. These drivers have to be downloaded and installed separately from here: If your Windows System is a x64 version, it is important to install the x64 Version of the MySQL Connector driver. As the WinSyslog Service runs as a 64bit application itself, it will need the connector to be 64bit as well. |
2. Installing and configuring MonitorWare Agent
2.1 Download and Install MonitorWare Agent
| So if you have not done so already, go to www.mwagent.com and download the latest MonitorWare Agent Version. It is always recommended to use the latest Version of MonitorWare Agent. Once the download has completed, go ahead and install it. Depending on your system, a system restart may be needed (but it usually is not) |
2.2 Setup Processing RuleSet
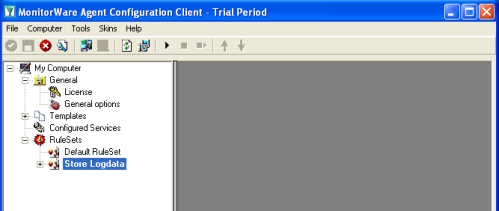 Start MonitorWare Agent Client, and skip the First Startup Wizard. Start MonitorWare Agent Client, and skip the First Startup Wizard.Add a new RuleSet and call it “Store Logdata”. |
| Back to Top |
2.2.1 Setup Database Logging
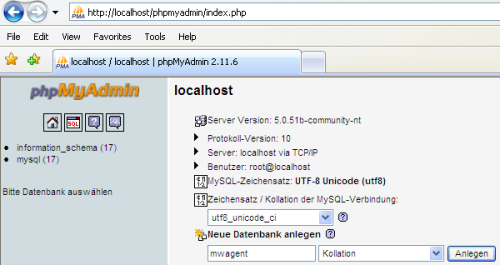 If you want to store messages inside MYSQL, follow this step. Click on your WAMP Icon, and open the phpMyAdmin. Now Create a new database called “mwagent”. |
| Back to Top |
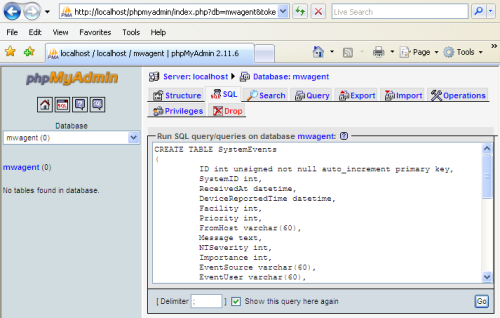 Once done, select the newly created database, switch to the “SQL” tab and copy the SQL statements from the textbox below. Now insert the copied commands into the SQL field. Then Click “GO”, you should see “Your SQL query has been executed successfully” after that as well as two new tables on the left list called systemevents and systemeventsproperties. |
2.2.2 Create the Database Action in MonitorWare Agent
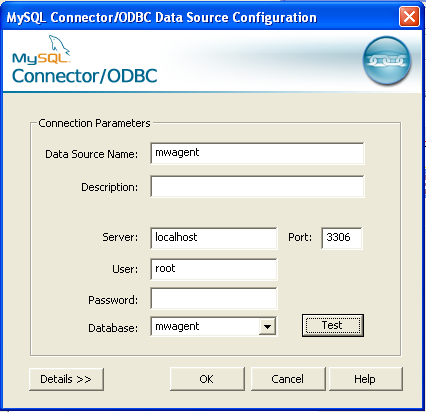 Get back to the MonitorWare Agent Client and create a new Rule in your self-created RuleSet called “Database”. Then add a new “Write to Database” Action, and name it “MYSQL ODBC”. After creating this action, you should automatically be taken to the actions properties. Click on the “Data Sources (ODBC)” button to open the System ODBC Administrator. Click on the “System DSN” Tab and add a new Datasource, select “MySQL ODBC 5.1 Driver” as driver. It is important to add a System DSN rather then a User DSN, because User DSN’s are not usable by the MonitorWare Agent Service (this is a Windows design restriction). Name the new datasource “mwagent” and use “localhost” as Server, “root” as username and no password. Then you are able to select the database which we created before called “mwagent”. |
| Back to Top |
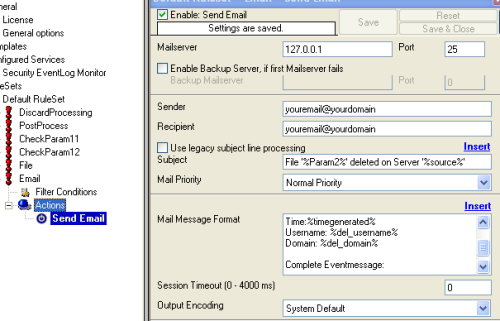
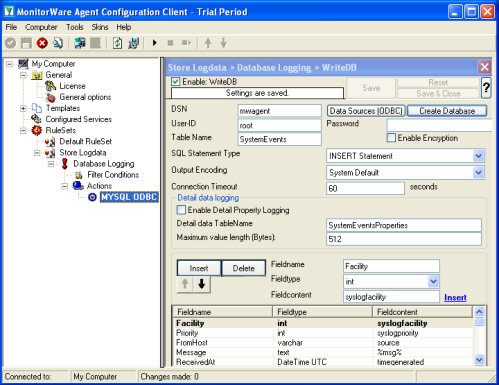 Check the database logging action again, it should look like the one in the screenshot. |
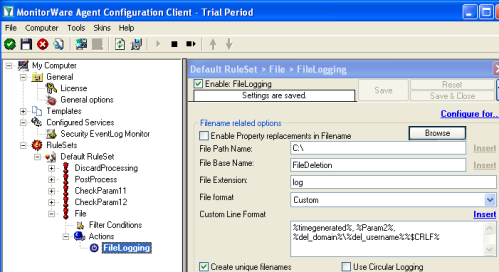
2.3.1 Setup File Logging
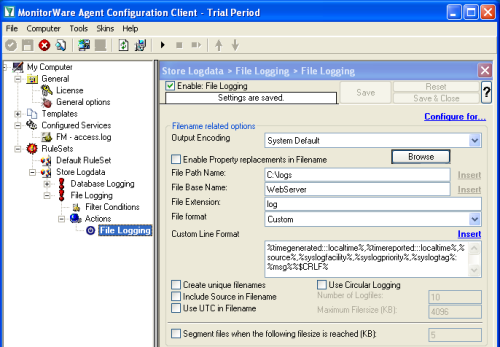 If you want to consolidate your webserver logfiles in one large logfile, proceed with this step. Otherwise you can skip this step.
|
| Back to Top |
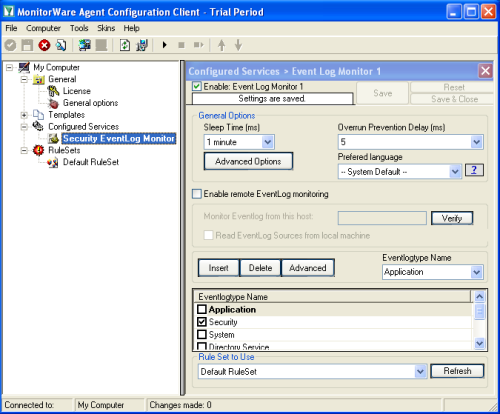
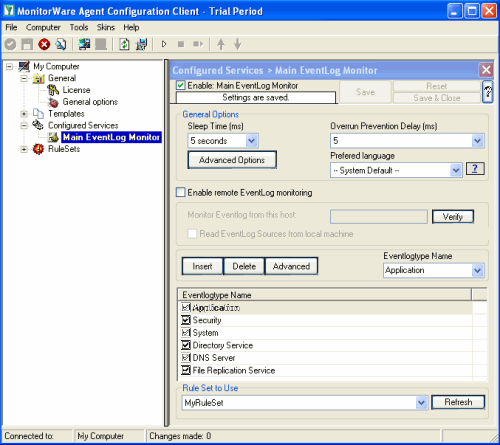
2.4 Add File Monitor Service(s)
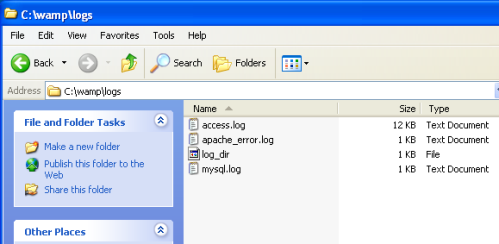 First of all find the exact location of the webserver logfiles you want to monitor. In this example, I use the access.log from my local wamp installation located at C:\wamp\logs. |
| Back to Top |
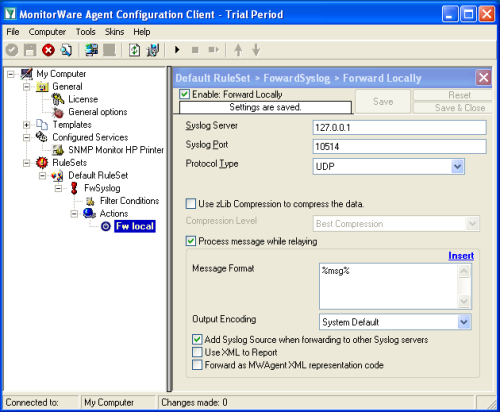
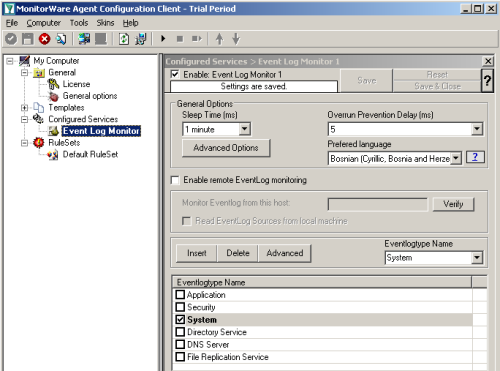
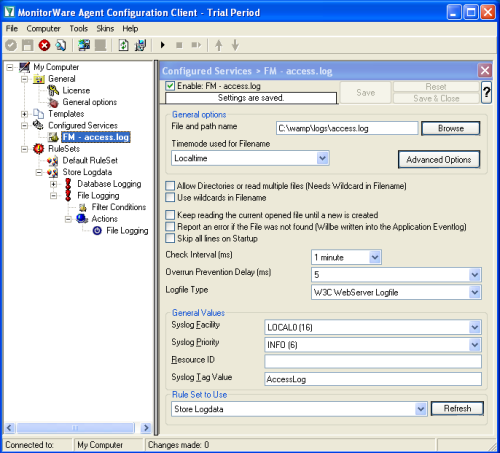 Now add a file monitor service. Inside that service, configure the correct file and path name of the file to be monitored. If you would like to read multiple files, you can enable the property replacer inside the filename. Be sure to specify the log file type to “W3C WebServer Logfile”. This is important so that the contents can properly be interpreted. It may also be a good idea to set a syslog tag name that matches the filename (or the function of the file name, e.g. “online-shop”). By doing so, you can easily filter inside phpLogCon. |
| Back to Top |
2.5 Starting MonitorWare Agent and verifying the configuration
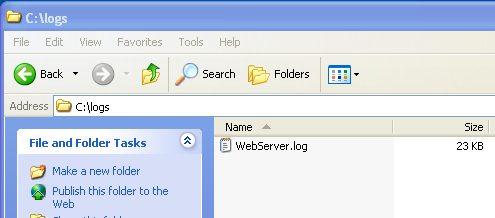 From the MonitorWare Agent configuration point of view, everything is setup now. So kindly start the MonitorWare Agent Service and wait a few moments, so that the data can be processed. From the MonitorWare Agent configuration point of view, everything is setup now. So kindly start the MonitorWare Agent Service and wait a few moments, so that the data can be processed.If you are using file logging, you should see that the logs folder on C:\ has been created and contains a WebServer.log file. If not, something went wrong. In this case please check the Windows Application EventLog for possible error reports from MonitorWare Agent. |
| Back to Top |
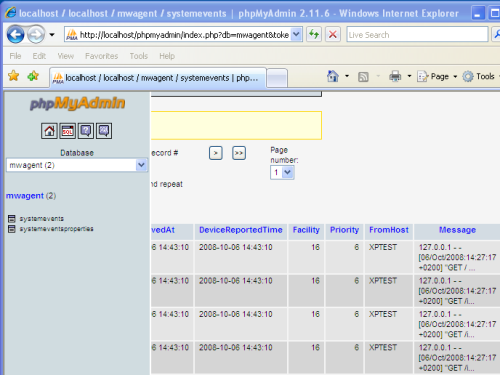 If you are logging into a database, switch back to phpMyAdmin and browse through the systemevents table. You should see at least one data record in this table now, like in the screenshot sample. If not, something went wrong, in this case please check the Windows Application Event Log for possible error reports from MonitorWare Agent. |
3. Install and Setup phpLogCon
3.1 Download and copy phpLogCon to the right location
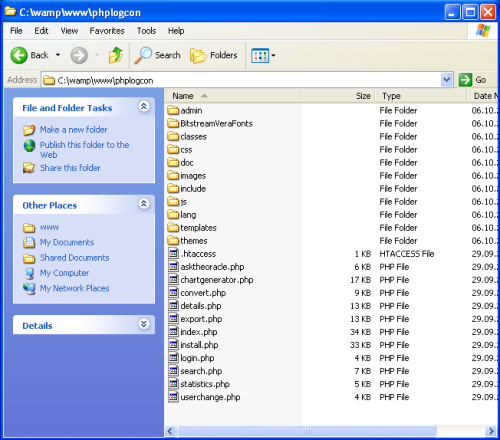 If you are using MonitorWare Agent 8.3 or higher, a proper version of phpLogCon can be found in the MonitorWare Agent installation folder. If you are using an older Version of MonitorWare Agent, I recommend to download the latest stable or beta build from here: http://www.phplogcon.org/downloads To unpack the install set, you need a program capable of processing tar.gz files. Most ZIP programs support this. If you do not have one, you can find WinRAR by following the link (we have no affiliation with the makers of WinRAR, but have found it to be a useful tool – use at your own risk). Open windows explorer and go to the www folder of your Apache web server, which is the folder where you can place html/php files. By default this will be “C:\wamp\www” if you have installed WAMP into the default installation folder. Create a new folder called phplogcon there. If you downloaded and unpacked phpLogCon, and copy or move the content of the src folder into the C:\wamp\www\phplogcon folder. If you have MonitorWare 8.3 or higher, you can use and copy the contents of the phpLogCon folder of your MonitorWare installation. The explorer window should look like in the screenshot now. |
3.2 Install and configure phpLogCon
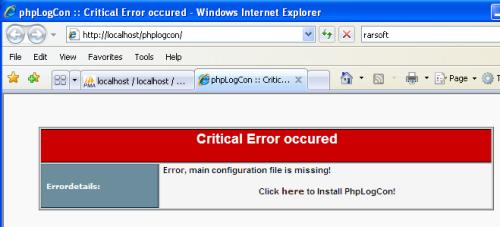 Open this link to start the phpLogCon installation: http://localhost/phplogcon/ If you do not see a page like in the screenshot, something went wrong in the steps before, please check them in this case. Otherwise click on the text-link “here” on phpLogCon’s error page to start its installation routine. |
| Back to Top |
| Follow the installation steps of phpLogCon. I recommend to “Enable User Database” in Step 3, as this will give you an advanced admin control panel. The User Database requires a MYSQL database to work, you can use the same one as you are using for MonitorWare Agent. |
| Back to Top |
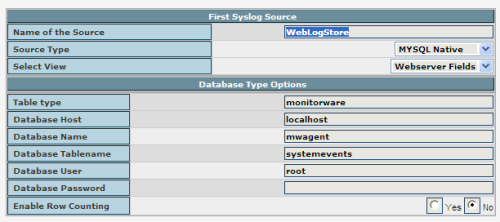 If you are using MYSQL to store log messages and you have reached Step 7, switch the source type to “MYSQL Native” and name the Source “WebLogStore DB” Use “mwagent” as Database Name and “root” as Database User. Leave the other configuration variables as they are, see the screenshot for how it should look like. Then click on the Next button to finish the installation. If you are using MYSQL to store log messages and you have reached Step 7, switch the source type to “MYSQL Native” and name the Source “WebLogStore DB” Use “mwagent” as Database Name and “root” as Database User. Leave the other configuration variables as they are, see the screenshot for how it should look like. Then click on the Next button to finish the installation. |
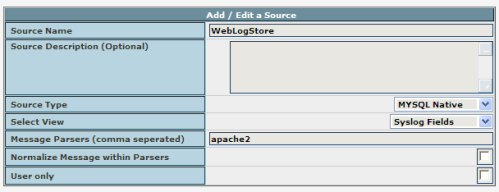 After you finished the Installation of phpLogCon, you need to login and switch to the sources admin and configure the source “WebLogStore DB” there. After you finished the Installation of phpLogCon, you need to login and switch to the sources admin and configure the source “WebLogStore DB” there.– In field “Message Parsers” add apache2 if you are using combined log format. Add apach2common if you are using common log format. |
| Back to Top |
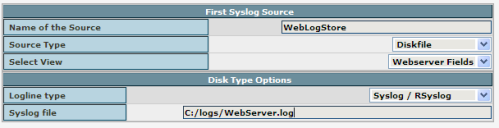 If you are using file logging and you have reached Strep 7, switch the source type to “Diskfile” and name the Source “WebLogStore FILE” Use “C:/logs/WebServer.log” as syslog file. Leave the other configuration variables as they are, see the screenshot for how it should look like. Then click on the Next button to finish the installation. If you are using file logging and you have reached Strep 7, switch the source type to “Diskfile” and name the Source “WebLogStore FILE” Use “C:/logs/WebServer.log” as syslog file. Leave the other configuration variables as they are, see the screenshot for how it should look like. Then click on the Next button to finish the installation. |
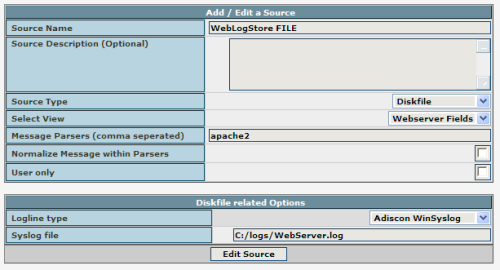 After you finished the Installation of phpLogCon, you need to login and switch to the sources admin and configure the source “WebLogStore FILE” there. After you finished the Installation of phpLogCon, you need to login and switch to the sources admin and configure the source “WebLogStore FILE” there.– In field “Message Parsers” add apache2 if you are using combined log format. Add apach2common if you are using common log format. |
| Back to Top |
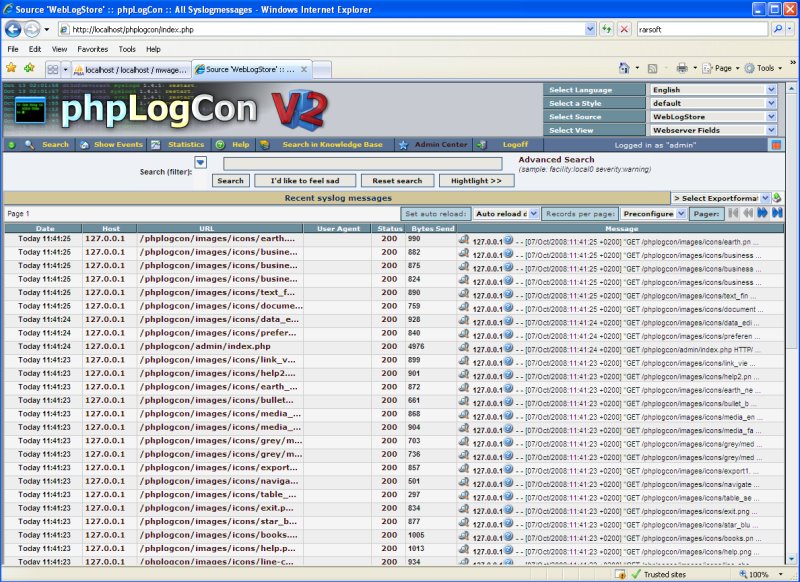
| After clicking on the “Finish” link, you should see a working phpLogCon installation. If you do not see any data, there may be no data in your database yet. Otherwise you will see an error code and message from phpLogCon.
|
Final Thoughts
I hope this article will help you installing and configuring phpLogCon and MonitorWare Agent. If you have problems or question related to this article, don’t hesitate to contact me or our support by email.
Please note that while this setup works, it is not very secure. At a minimum, it is recommended to set proper passwords for the databases (instead of using a password-less root account). Please review the relevant documentation on how to do that.
 Start the MonitorWare Agent Client and skip the wizard on startup.
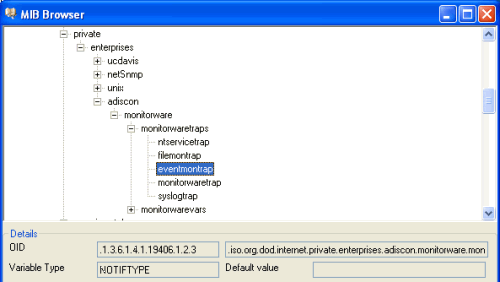
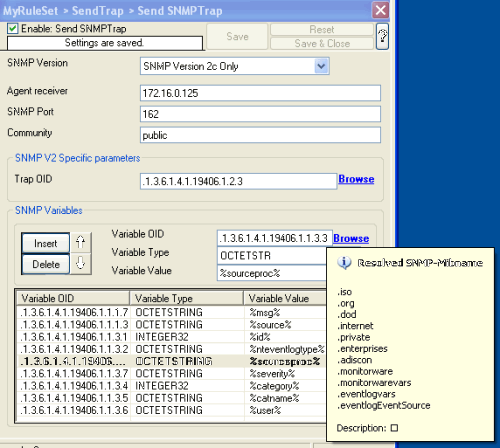 Now what you don’t see in the mib browser is the list of variables which are connected with the SNMP Trap. For the eventmontrap, we need a few snmp variables:
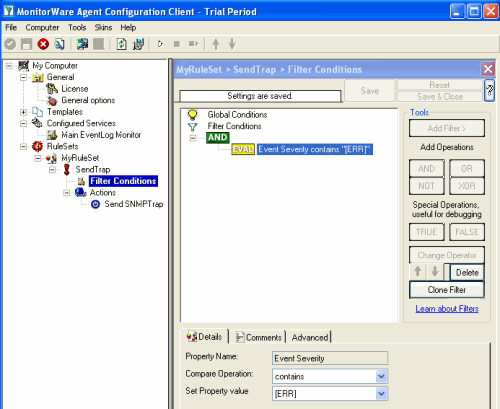 With our current setup, you would send one SNMP Trap for each incoming Syslog messages. But you may not want this, so you can optionally add some filters to reduce the number of outgoing SNMP Traps.
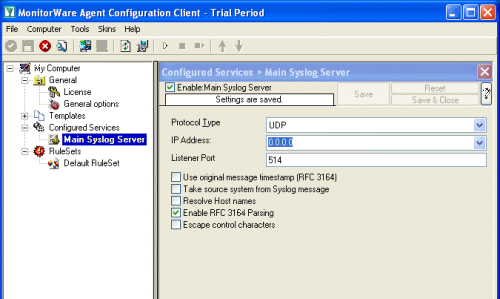 Start the MonitorWare Agent Client and skip the wizard on startup.
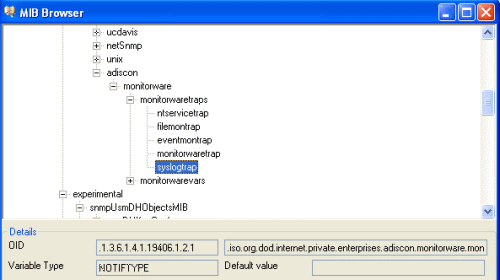
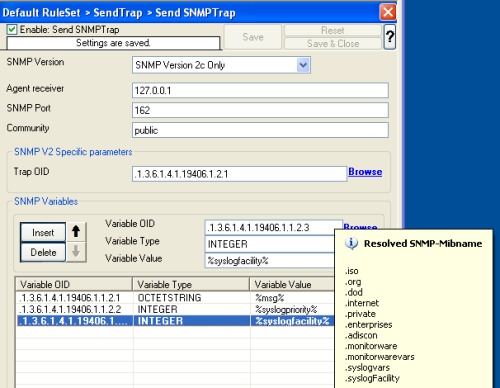 Now what you don’t see in the mib browser is the list of variables which are connected with the SNMP Trap. For the syslogtrap, we need syslogMsg, syslogSeverity and syslogFacility.
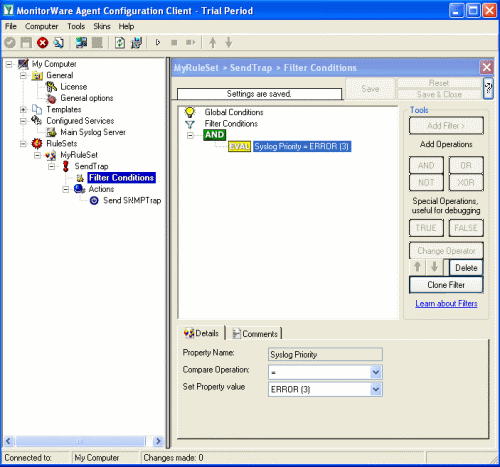 With our current setup, you would send one SNMP Trap for each incoming Syslog messages. But you may not want this, so you can optionally add some filters to reduce the number of outgoing SNMP Traps.