How do I Add filters for MonitorWare Agent, WinSyslog and EventReporter?
Article created 2004-07-15 by
Tamsila-Q-Siddique.
Article updated 2006-06-19 by Timm Herget.
1. You would at least need the Basic Edition of MonitorWare Agent / WinSyslog / EventReporter for this scenario.
Please Note: We are using MonitorWare Agent in this guide whereas MonitorWare Agent is
superset of WinSyslog and EventReporter. So this guide is also applicable for WinSyslog and
EventReporter.
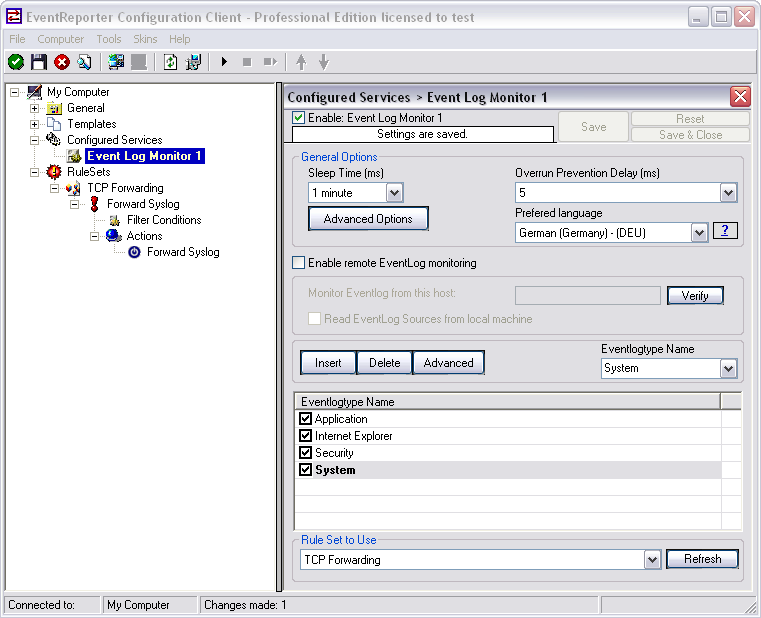
2. When the Configuration Program client is accessed select your language – in this example, I
use English, so it might be a good idea to choose English even if that is not your preference. You
can change it any time later, but using English makes it much easier to follow this guide here.
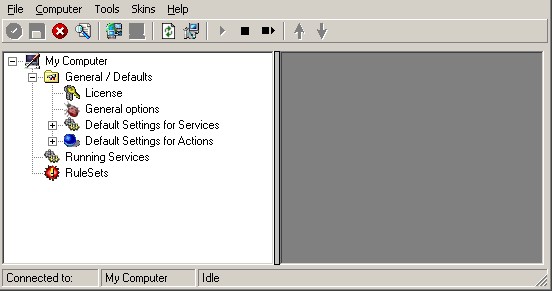
Once done you would see a screen-shot similar to the one below:

3. Lets assume that we are interested in getting an e-mail alert in a given time period for the
following filter condition:
( (Event ID is 500 OR 1000 OR 2000 OR 3000) ) AND ( FromHost is not equal to WS01 ) )
AND
( ( Event Source is equal to Security ) OR ( Priority is greater than 5 ) )
And you also want to log the rest of the messages into a text file. The filter process will now
basically work as follow (for details see steps below):
- Rule 1: Finds the Filter condition stated above and makes sure it is only reported
once within a given period. Later on when the required filter condition is evaluated to true,
an e-mail alert is generated. - Rule 2: Processes all other incoming message and log them into text file.
Important note about Filter Condition
String comparison in Filter Conditions are “Case Sensitive”! For example, if the
Source System name is “ws01” and you had written “WS01” while applying the filter, then this filter
condition would “NEVER” evaluate to True! Please double check before proceeding further!
Step 1 – Create a Syslog Server
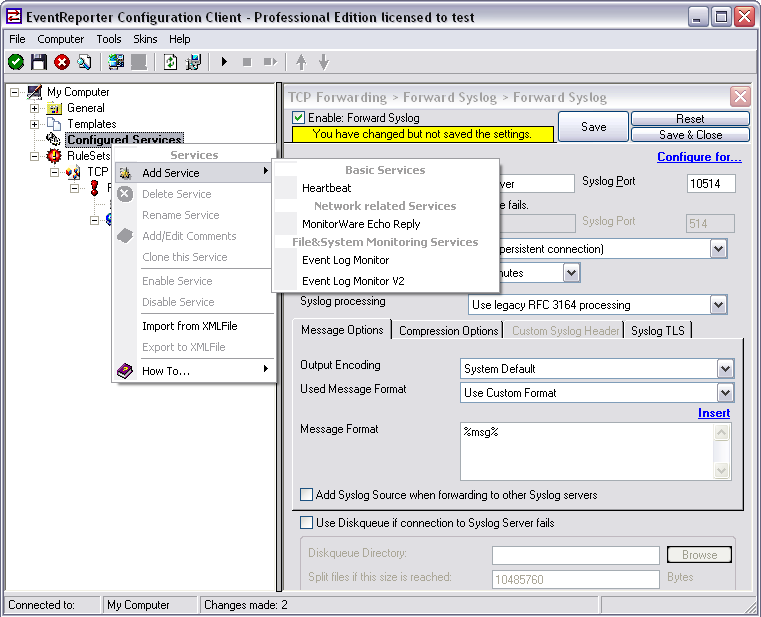
1. In the configuration program, right click on Running Services. A menu is opened up, select
“Add Service”. Choose “Syslog Server”. Once done it will look like as below:

Once you click on the “Syslog Server” a dialog box similar to the one displayed pops up:

In this tutorial first we will create the service and then we would make the required Rule Set.
So we choose the “Create Service” option. You can opt for otherwise.
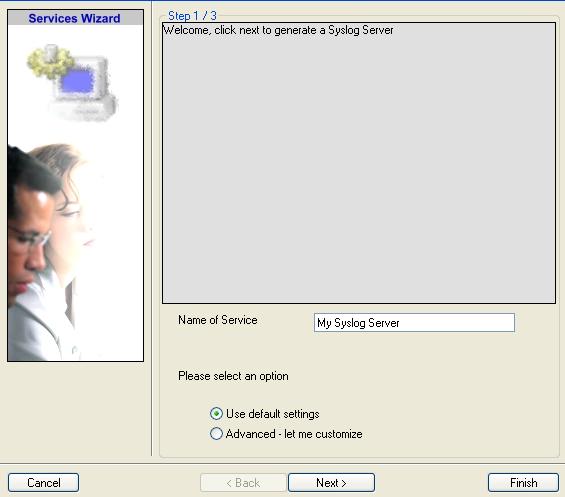
Once you have done so, a new wizard starts.
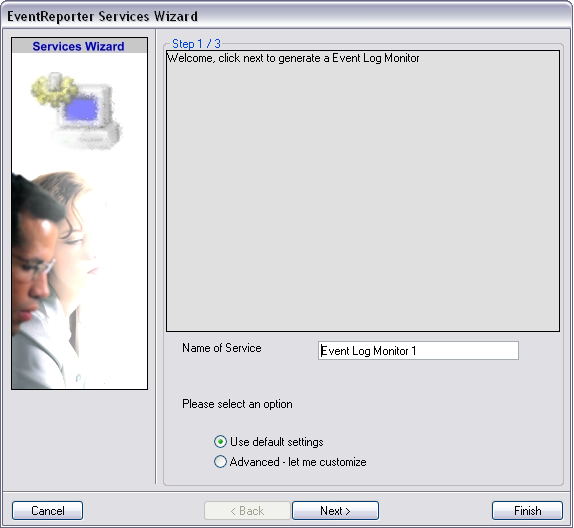
2. You can use either the default name or any other you like. I will use “My Syslog
Server” in this sample. Leave the “Use default settings” selected and
press “Next”.

3. As we have used the default settings, the wizard will immediately proceed with step 3, the
confirmation page. Press “Finish” to create the service. The wizard completes and returns
to the configuration client.
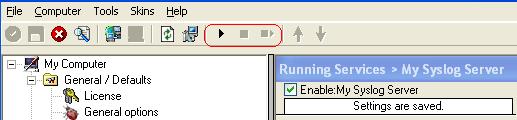
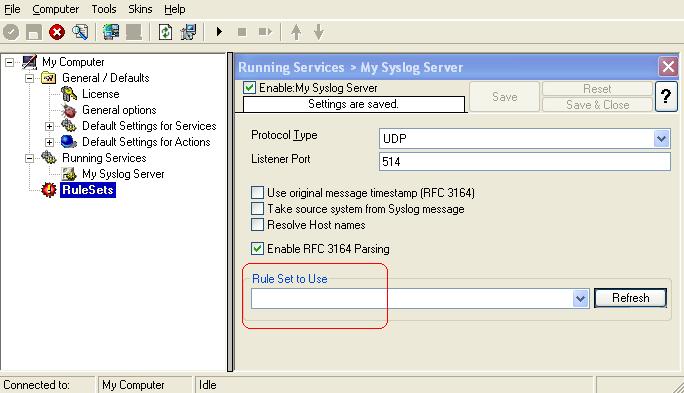
4. You will see the newly created service beneath the “Services” part of the tree
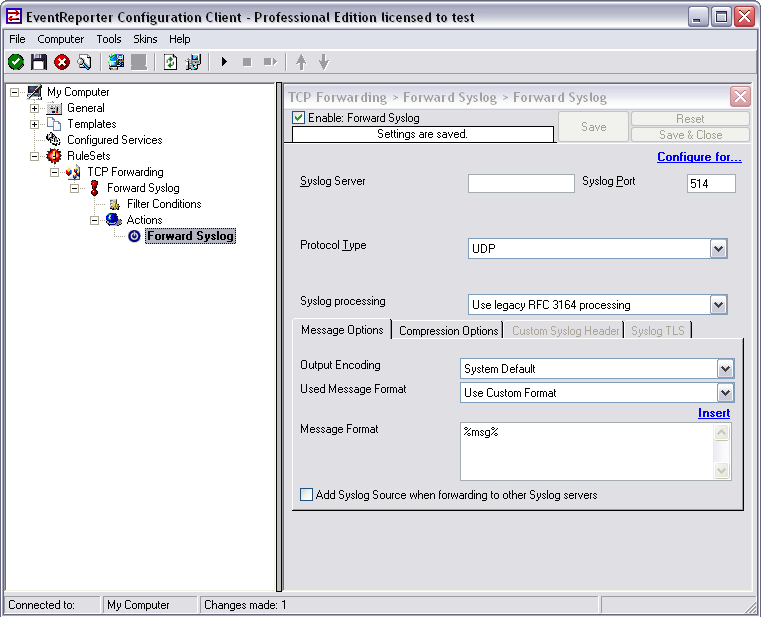
view. To check its parameters, select it:

As you can see, the service has been created with the default parameters. Please note that
there is no rule set bound to this service.
Step 2 – Create a Rule Set for Email Alert Generation and File Logging
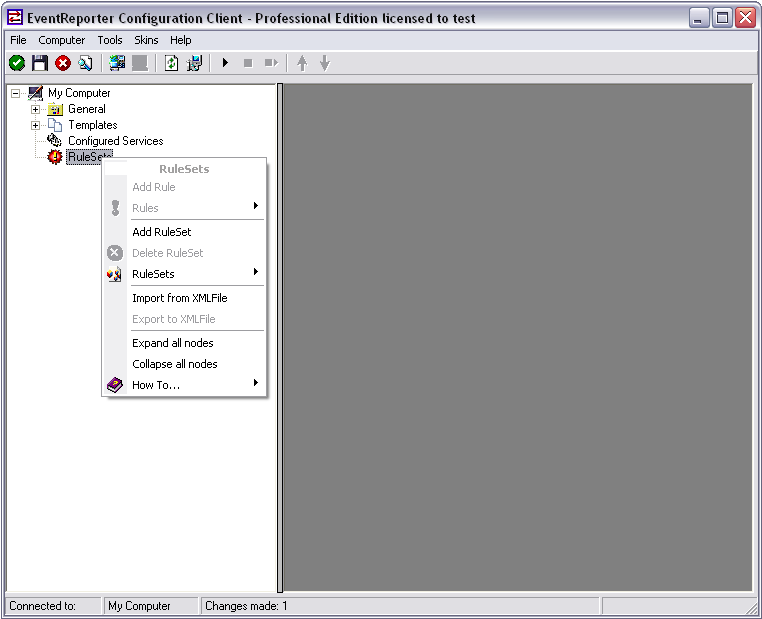
3. Define a new Rule set, right click
“Rule set”. A pop up menu will appear. Select “Add Rule set” from this
menu. On screen, it looks as follows:

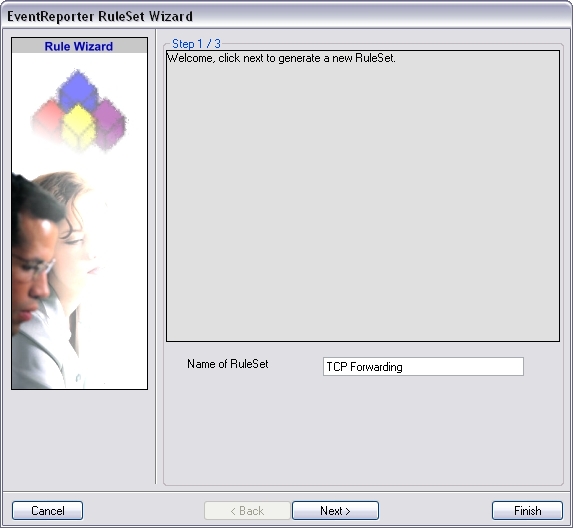
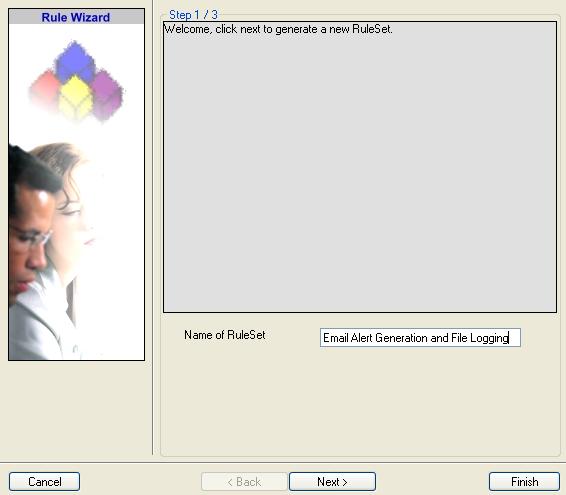
4. Then, a wizard starts. Change the name of the rule to whatever name you like. We will use
“Email Alert Generation & File Logging” in this example. The screen looks as follow:

Click “Next”. A new wizard page appears.
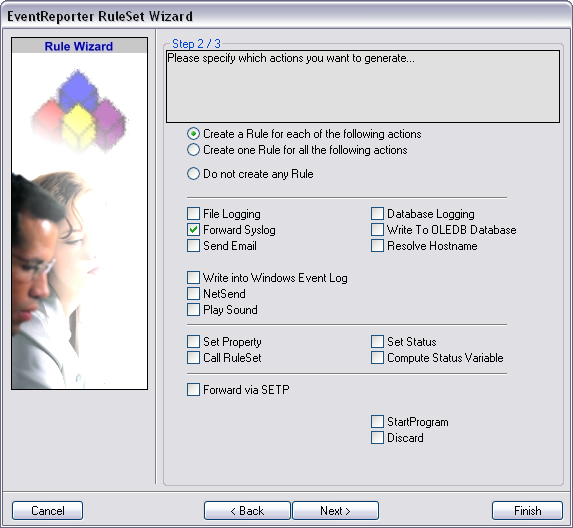
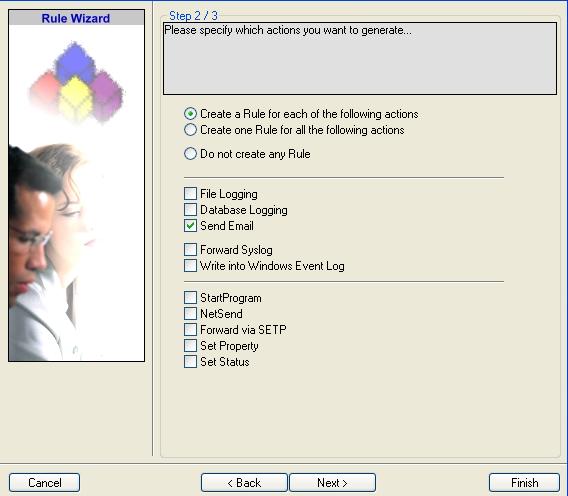
5. Select only “Send Email”. Do not select any other options for this sample. Also, leave the
“Create a Rule for each of the following actions” setting selected. The screen looks as
follow:

6. Click “Next”. You will see a confirmation page. Click “Finish” to create
the Rule set.

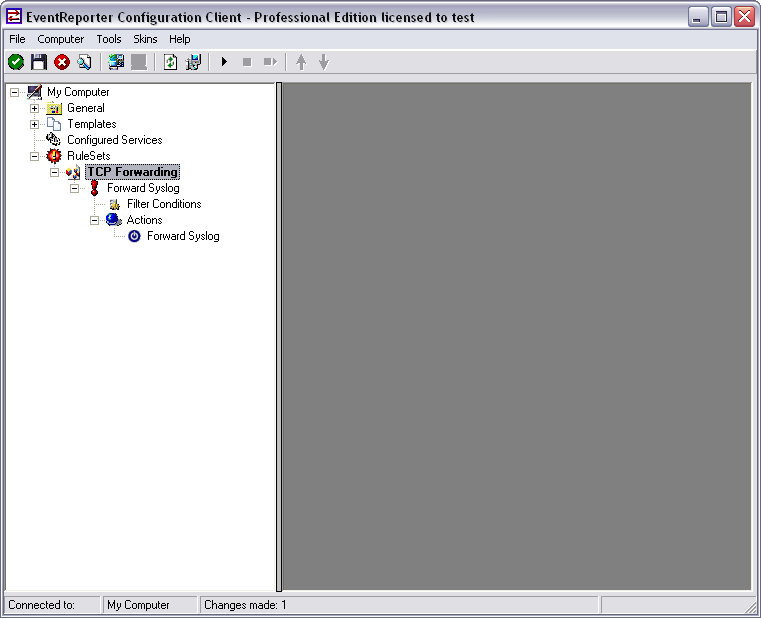
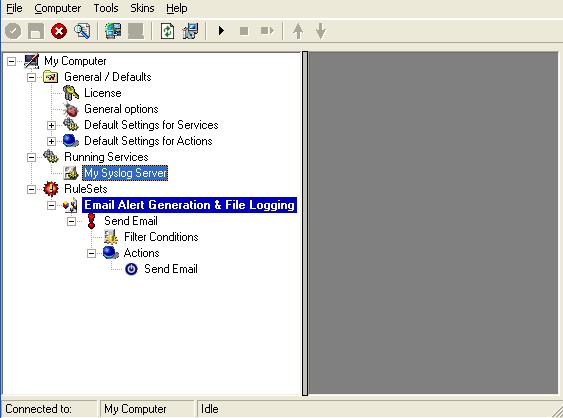
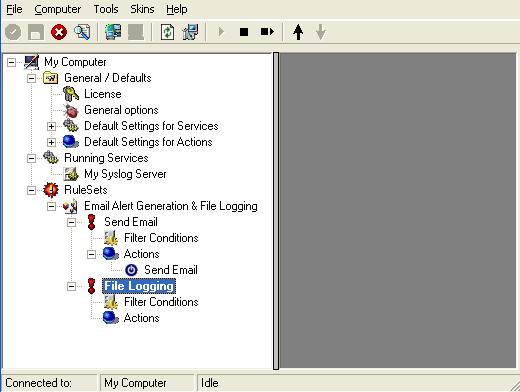
7. As you can see, the new Rule set “Email Alert Generation & File Logging” is
present. We would create the “File Logging” Rule later on. Please expand the Rule Set in the tree
view until the action level of the “Send Email” Rule and select the “Send
Email” action to configure.

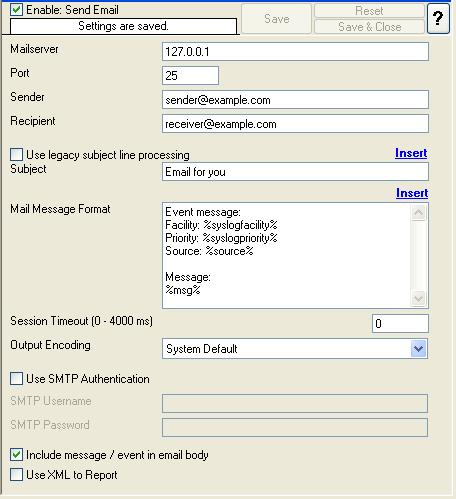
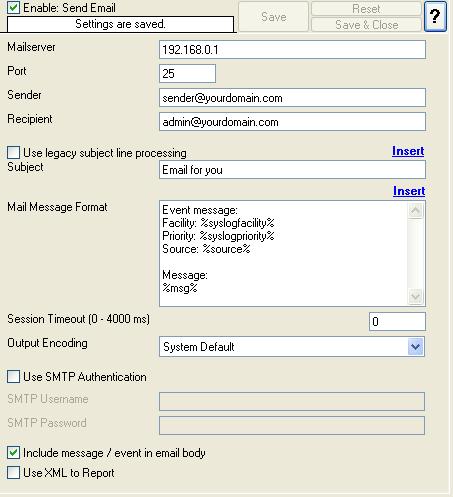
8. I have used factual values in the sample. In this sample I assume that the Mail Server IP
address is 192.168.0.1. The Sender and Recipient email addresses are “sender@yourdomain.com” and
“admin@yourdomain.com” respectively. Please replace these values and configure it according to your
environment.

9. Once the “Send Email” settings are configured, we will setup the filter condition. The Filter
Condition would be something like the one below:
( (Event ID is 500 OR 1000 OR 2000 OR 3000) ) AND ( FromHost is not equal to WS01 ) )
AND
( ( Event Source is equal to Security ) OR ( Priority is greater than 5 ) )
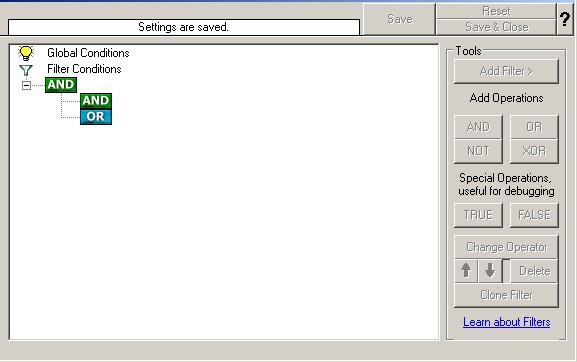
10. Click on the filter condition of the “Send Email” Rule to set up the filter condition.

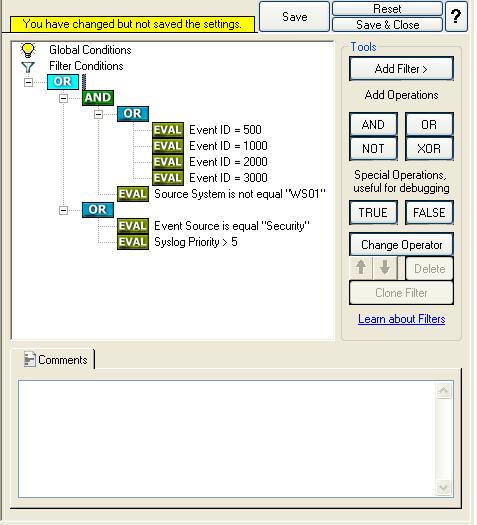
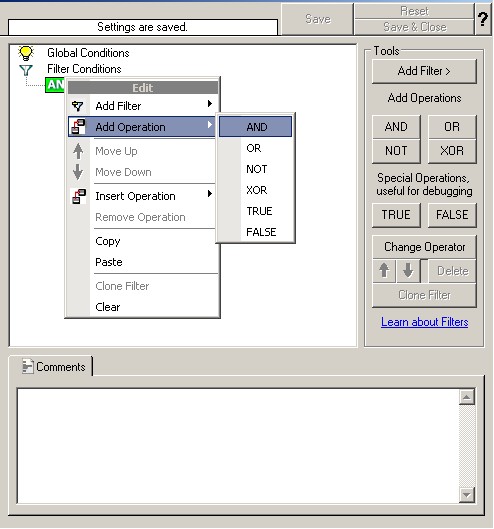
11. Right click on the AND button. A pop up menu appears. Select Add Operation and then choose
the “AND” Operator. Your filter condition will look like this:

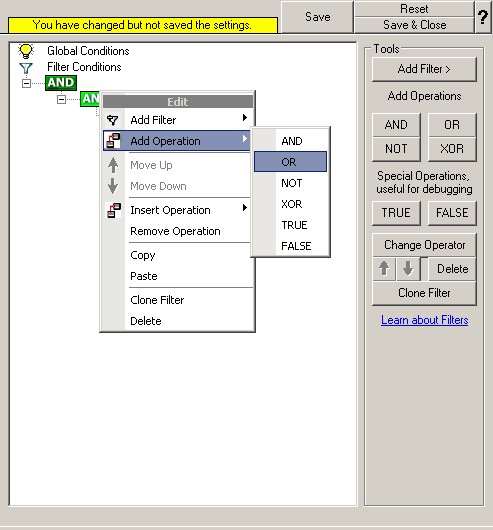
Once done, repeat the same process again. But this time Select the “OR” Operator. “AND” or “OR”
Operator are at the same level. Your filter condition will look like this:

12. Select the lower AND from the tree view and right click on the AND button. Choose “Add
Operation” from the pop up menu. Then select the OR operator. This is done to cover this part of the
filter condition “(Event ID is 500 OR 1000 OR 2000 OR 3000)”.

Right Click on the OR button. Click on the “Add Filter” from the pop up menu. Or you can use the
Add Filter Button. Select “Event Log Monitor” and then “Event ID”. This can be seen in the screen
shot below:

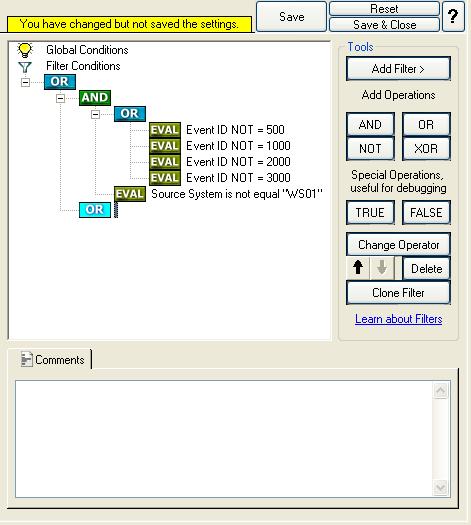
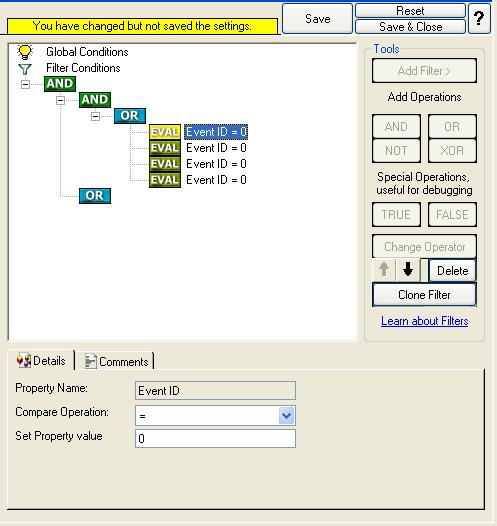
13. I prefer to add all four Event ID’s property filters first and later on change the
Event ID’s to the actual values in the sample. When you have added them, it should look as
follows:

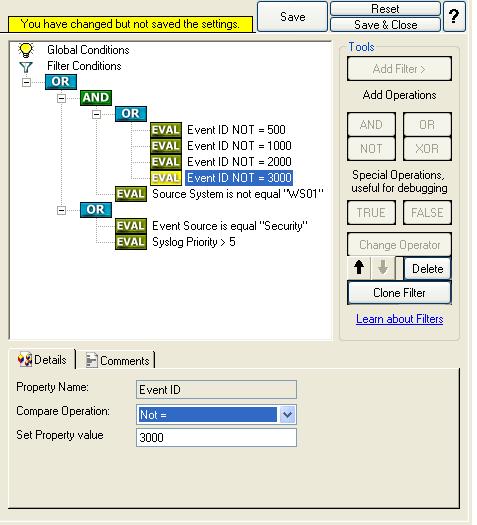
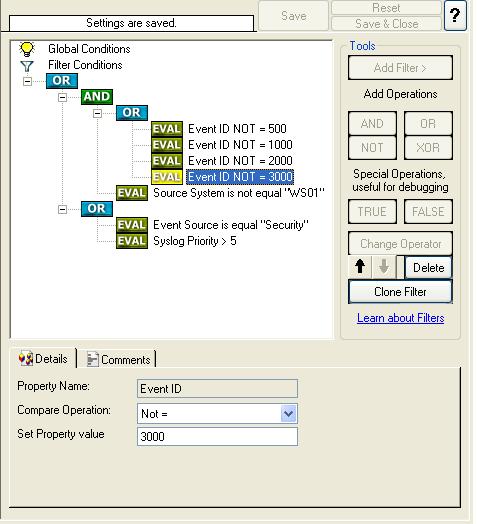
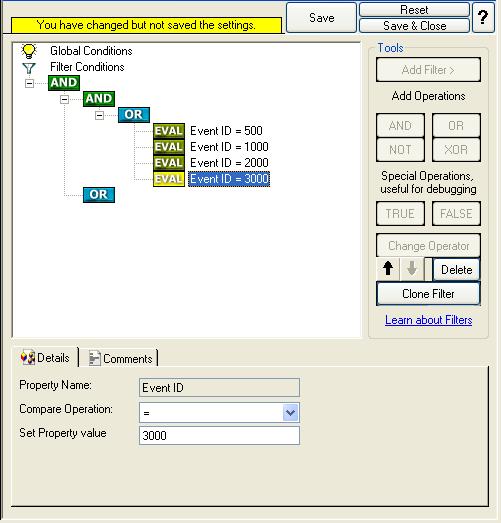
14. In order to enter the actual values, select each of the four filters. A small dialog opens
at the bottom of the screen. There you enter the values you are interested in. In our sample, these
are Event ID 500, 1000, 2000, and 3000. As we are only interested in exactly these values, we do a
comparison for equality, not one of the other supported comparison modes. When you have made the
updates, you screen should look as follows:

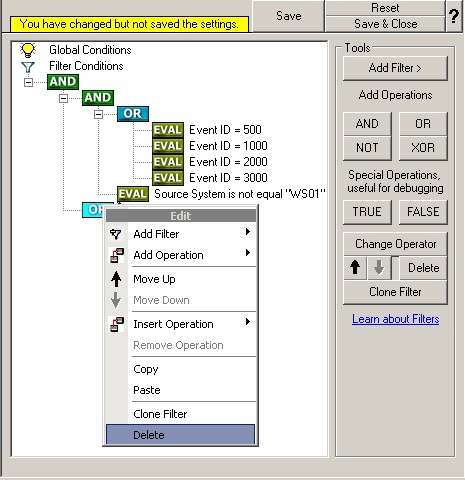
15. Right click on the lower AND in the tree view (under which you want to add another condition
now) and click on the “Add Filter” from the pop up menu. Or you can use the Add Filter Button.
Select “General” and then “Source”.

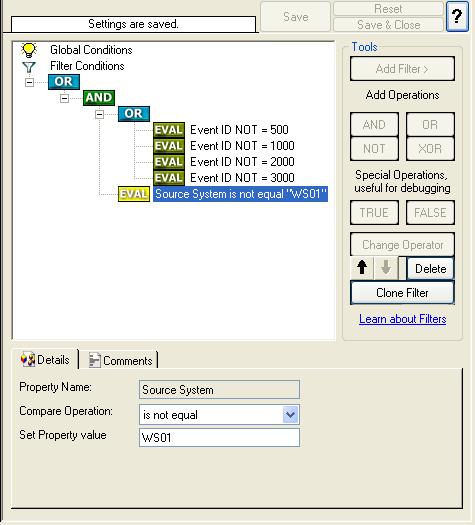
Once the filter is added, from the “Compare Operation” combo box, select “is not equal” and
then set the value as “WS01”. When you have made the updates, you screen should look as
follows:

16. So far we have accomplished this part of the filter conditions.
( (Event ID is 500 OR 1000 OR 2000 OR 3000) ) AND ( FromHost is not equal to WS01 ) )
AND
We will work on the second part of the filter condition in the upcoming step i.e. on the
following filter:
( ( Event Source is equal to Security ) OR ( Priority is greater than 5 ) )
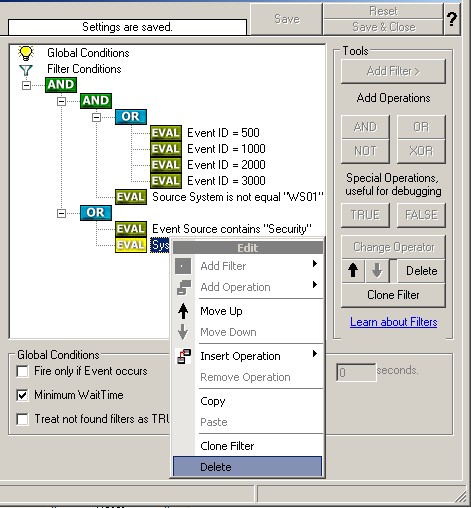
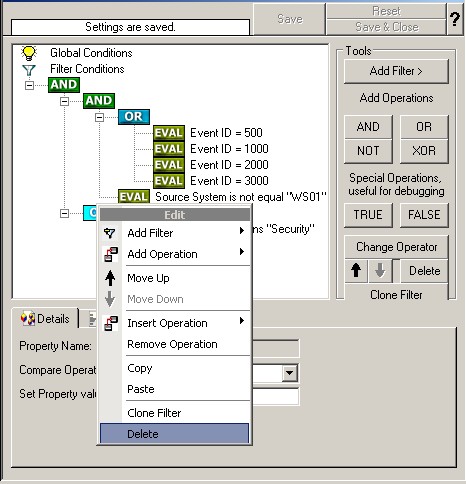
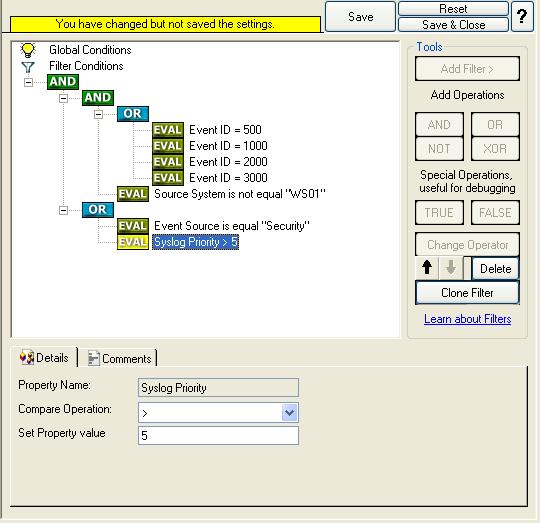
17. Select the lower OR from the tree view and right click on the OR button. Click on the “Add
Filter” from the pop up menu. Or you can use the Add Filter Button. Select “Event Log Monitor” and
then “Event Source”. This can be seen in the screen shot below:

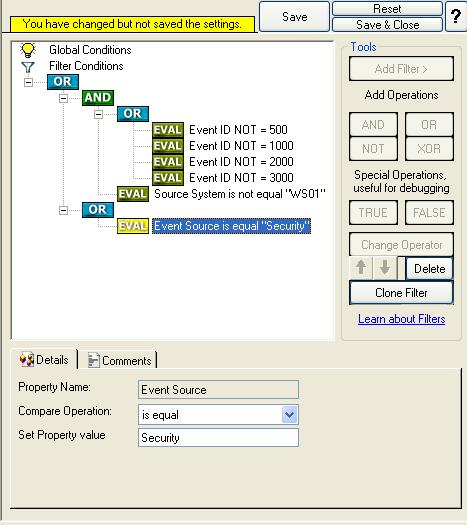
Once the filter is added, from the “Compare Operation” combo box, select “is equal” and
then set the value as “Security”. When you have made the updates, you screen should look as
follows:
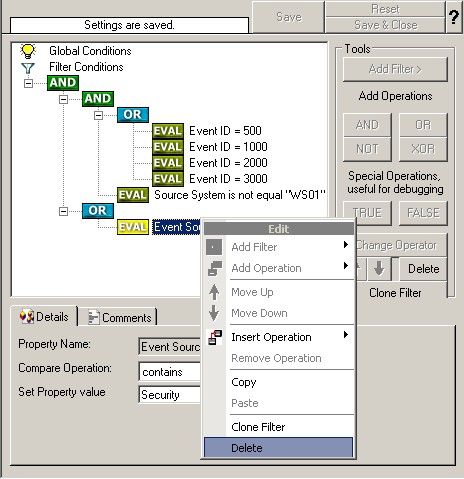
18. Select the lower OR from the tree view and right click on the OR button. Click on the “Add
Filter” from the pop up menu. Or you can use the Add Filter Button. Select “Syslog” and
then “Priority”. This can be seen in the screen shot below:

Once the filter is added, from the “Compare Operation” combo box, select “greater than” and
then set the value as “5”. When you have made the updates, you screen should look as
follows:

Don’t forget to save the settings by clicking the (diskette-like) “Save” button.
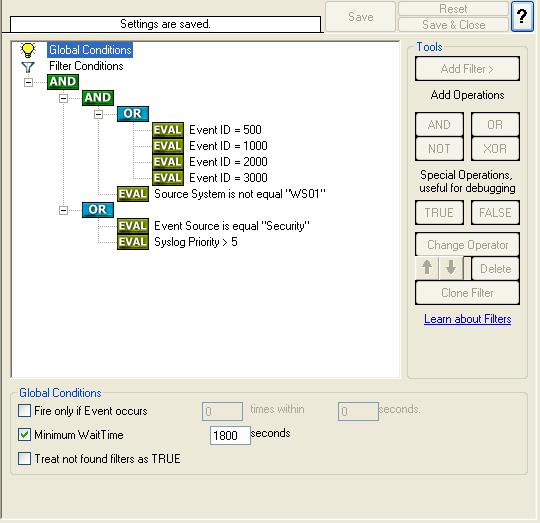
19. We have now selected all events that we would like to get email alerts. In order to prevent
this rule from firing too often we would enable “Minimum Wait Time”. This will make sure that (the
Syslog Facilities defined in the filter condition) in “Send Email” Rule are only forwarded once
within a specified period. Click on the Filter Conditions you would see an option called as “Global
Condition”. Select the “Minimum Wait time” and configure it. In this sample I have set the “Minimum
Wait time” to 1800 Seconds (i.e. 30 minutes). Please replace this value as you like it.

Click
here to know the difference between the Fire only if Event occurs and Minimum Wait Time.
20. We are almost done! Now we have to create a Rule for File Logging. Please note that we
are creating a “Rule” and not a “Rule Set”! The reason is that each Rule Set can have as many
Rules as you like and only one Rule Set can be associated with any service at a time (i.e My Syslog
Server in this case). Each Rule in turn can have one filter condition but as many actions as you
like. All the Rules that are part of a specific rule set are executed in a sequential manner.
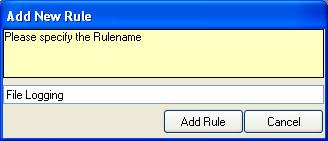
In order to create a new Rule, right click on “Email Alert Generation & File Logging”
RuleSet, and select “Add Rule”. The screen looks as follow:

You can use either the default name or any other you like. I will use “File Logging” in
this sample.

21. You would see that the “File Logging” Rule has been created. If you expand the Rule in the
tree view until the action level of the “File Logging” Rule, you would notice that the
“File Logging Action” is missing. This is by default. We would create this action in the next
coming steps.

22. In order to create a “File Logging” Action, right click on the Action of the “File Logging”
Rule. A pop up menu appears. Select “Add Action.” Then opt for “Write To File”. The screen looks as
follow:

23. Then, a wizard starts. Change the name of the action to whatever name you like. We will use
“Write to File” in this example. Leave the default settings. The screen looks as
follow:

Click “Next”. You will see a confirmation page. Click “Finish” to create the
action.
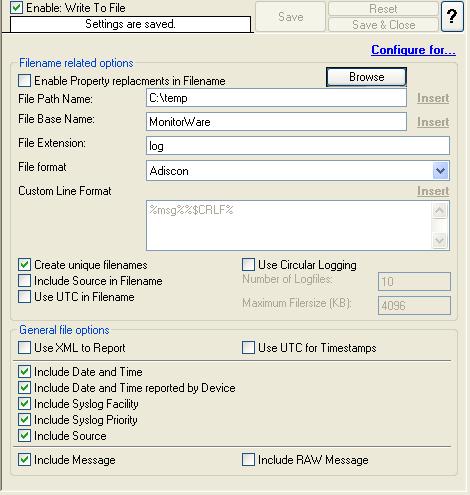
24. Please select the “Write to File” action to configure.

25. The default File Path and File Base Name is “C:\temp” and “MonitorWare”. I am
using these values in this sample. You can configure it according to your environment.
Please note: If the configured directories is missing then the latest version of the
MonitorWare Agent, WinSyslog and EventReporter have the capability to create the missing
directories.
26. Leave the filter condition of “File Logging” Rule as it is. Global Conditions apply to the
rule as whole. They are automatically combined with a logical AND with the conditions in the filter
tree. The reason behind doing this is to processes all other incoming message and getting them
logged into the text file.

27. Last, save the changes if you haven’t done it before and then restart the MonitorWare /
WinSyslog or EventReporter service. This procedure completes the configuration of the Syslog
server.

MonitorWare / WinSyslog or EventReporter cannot dynamically read changed configurations. As
such,it needs to be restarted after such changes.