How To setup Windows centralized Monitoring
Article created 2003-11-24 by
Wajih-ur Rehman.
Article updated 2004-04-22 by
Tamsila-Q-Siddique.
Monitoring Windows NT/2000/XP/2003 is important even for small environments.
This article is strictly task focused. It does not describe why the
systems should be monitored nor does it provide any further background. Please see
the respective backgrounders or product documentation on this. This article is a
step-by-step description of what you need to do in order to centrally monitor
your Windows NT/2000/XP and 2003 systems.
This article has been extracted from the
MonitorWare Agent documentation. Please be sure to check the MonitorWare Agent online help
if a newer version is available.
Centralized Event Reports
In this step-by-step guide, MonitorWare Agent is configured to work together with
Adiscon’s MonitorWare Console to automatically
generate event summaries for the monitored servers and other devices.
This
guide focuses on a typical small to medium business topography with a single
geographical location and 5 Windows clients and a central hub server. All
systems are well connected via a local Ethernet. Event reports from all machines
should be stored in a database. The administrator shall receive daily
consolidated event reports.
What you need
In
this guide, I am focusing on building a solution with Adiscon’s MonitorWare
Agent and MonitorWare Console. This combination allows you to centralize all your event logs
and report events from them. Free 30 day trial versions are available at the
respective product sites (links below), so you can try the system without the
need to buy anything.
You
need to run the following products:
- 1 MonitorWare
Agent for each system that is to be monitored. In our scenario, this means 6
copies, one for each client and one for the central hub server to be monitored. - 1 MonitorWare Console togenerate consolidated reports based on the gathered log data.
To deliver
MonitorWare Console’s reports, you need a local web server (for example Microsoft’s IIS or
Apache) and a mail server capable of talking SMTP (most modern servers support
this)
You
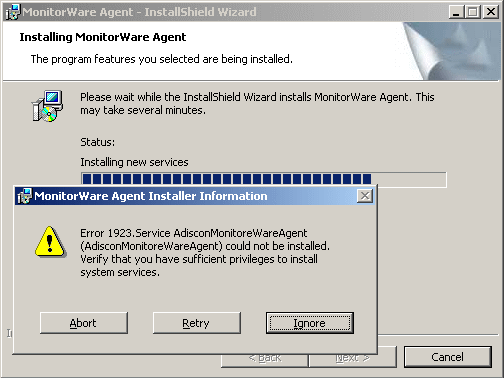
need administrative privileges on each of the machines. This is required both
for installation and configuration. Make sure you log on with a sufficiently
privileged user account.
Step 1 – Download Software
As you read the MonitorWare Agent
manual, you most probably downloaded the MonitorWare Agent. If you haven’t,
please visit www.mwagent.com/download
to do so. In addition to the agent, you also need MonitorWare Console. A free,
full-featured 30 day trial is available at
http://www.mwconsole.com/en/download/.
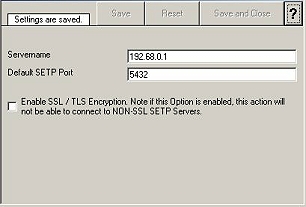
Step 2 – Install MonitorWare Agent
Run the MonitorWare Agent setup
program on all systems that should be monitored. This means you need to run it
on all 5 clients and the central hub server. Take a note of the central hub
server IP address or host name. You’ll need this value when configuring the
agents on the client machine. For our example, we assume this system has an IP
address of 192.168.0.1.
For larger installations (with many
more servers) there are ways to set it up in a simpler fashion, but in a
scenario like ours, it is faster to install it on each machine manually. You can
install it with the default settings. When setup has finished, the program
automatically is configured to operate as a simple syslog server. However, it
does not yet create the log in our database we need. So we will go ahead and
change this on each of the machines or by launching it on one machine and
remotely connecting to the others. It is your choice. In this sample, I use the
MonitorWare Agent on each machine (it is easier to follow).
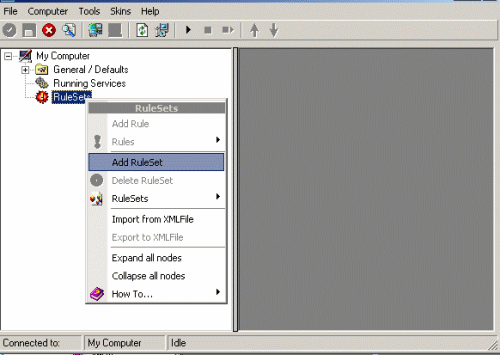
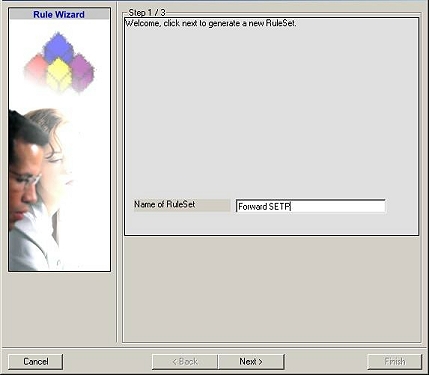
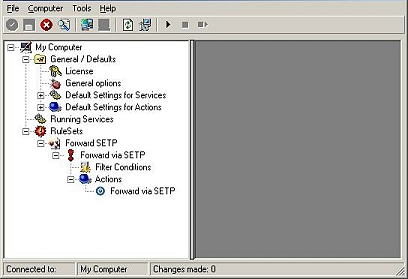
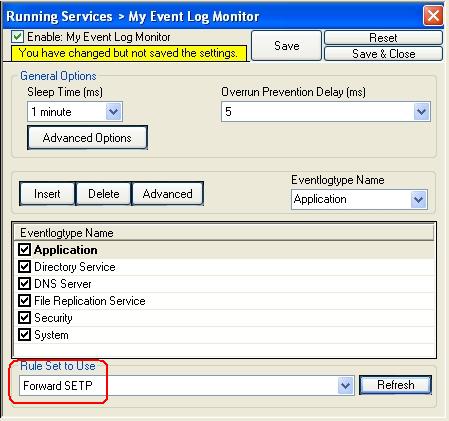
Step 3 – Create a RuleSet for Forward by SETP
The steps to configure the agents are
as follows (repeat this on each of the 5 client machines). This step needs not
to be done on the central hub server!:
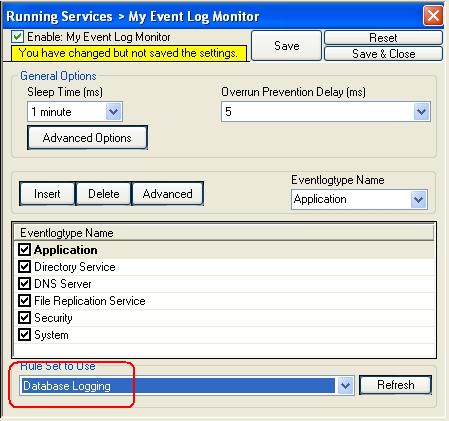
Step 4 – Create a RuleSet for database logging
This
step needs only to be done on the central hub server!
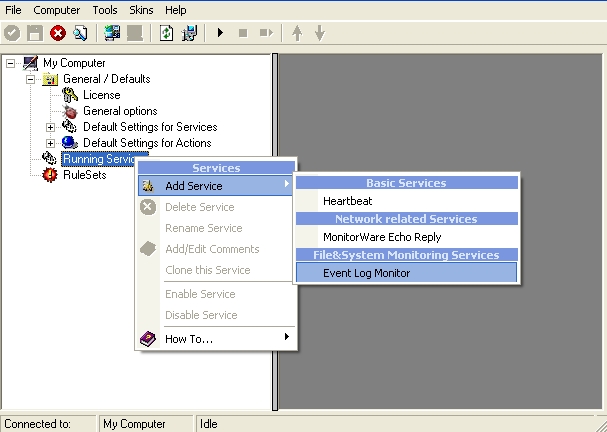
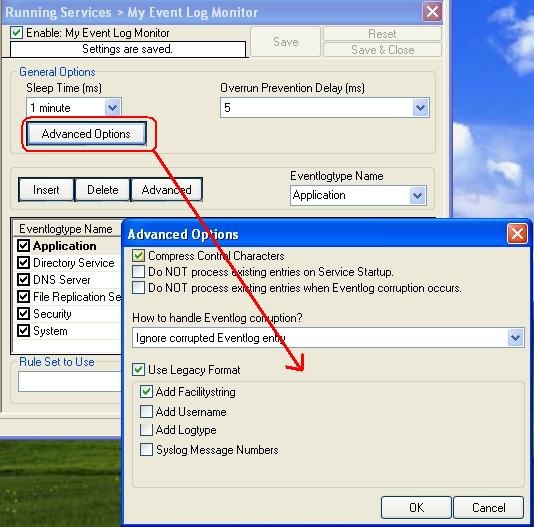
Step 5 – Create an Event Log Monitor Service
The steps to configure the MonitorWare Agents are as follows (repeat this
step on each of the 5 client machines and the central hub server!):
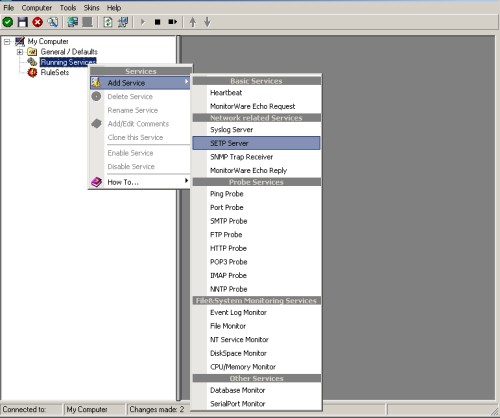
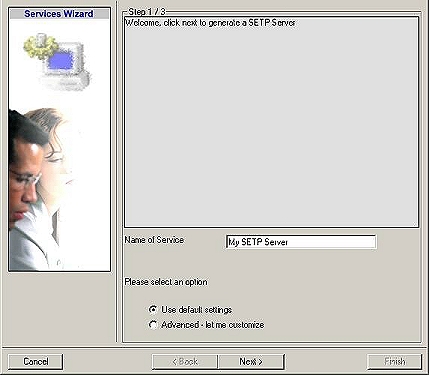
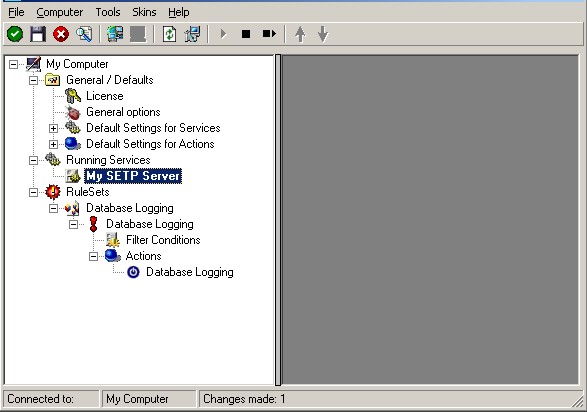
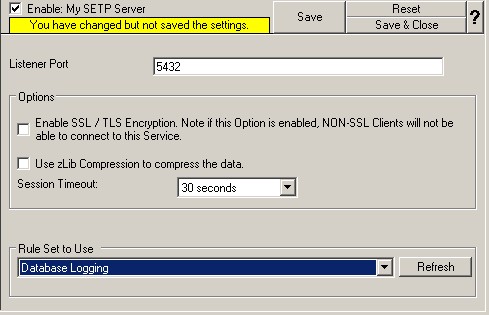
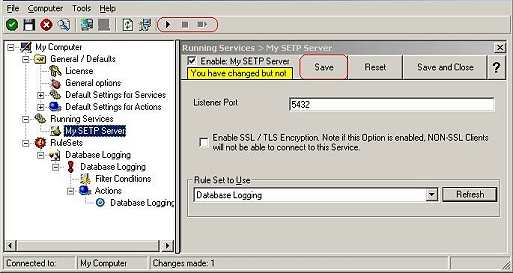
Step 6 – Create a SETP Server Service
The
steps to configure the agents are as follows (only central hub server!):
Step 7 – Preparing Web Server for MonitorWare Console
MonitorWare Console publishes its reports through
the local web server (central hub server).
To avoid confusion, we recommend
creating a separate directory on the web server for MonitorWare Console. Let us assume you
use Microsoft Internet Information Server and run it in the default
configuration. Then, you web pages are stored in the c:\inetpub\wwwroot
directory. Create a subdirectory “MonitorWareConsole” directly beneath this
directory.
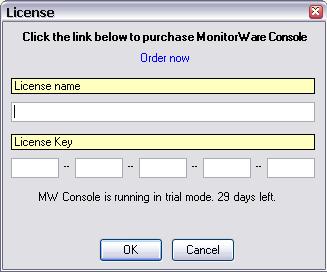
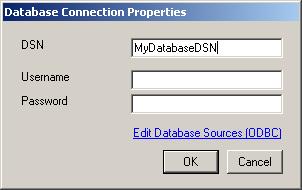
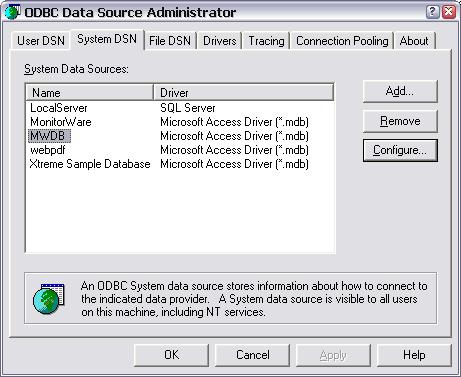
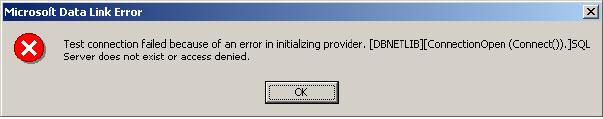
Step 8 – Installing and Configuring MonitorWare Console
MWConsole- Installation and Configuration Steps (1.1)
MWConsole- Installation and Configuration Steps (2.0)
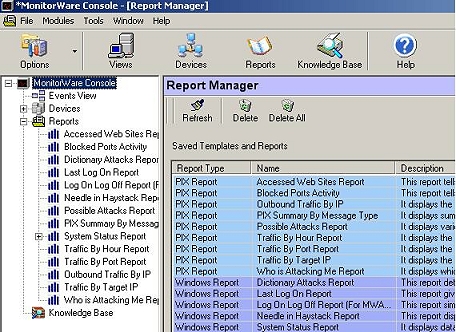
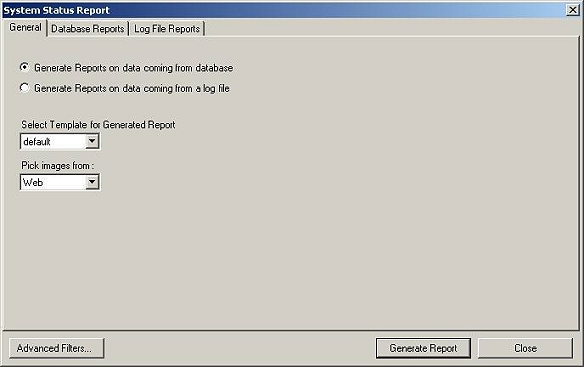
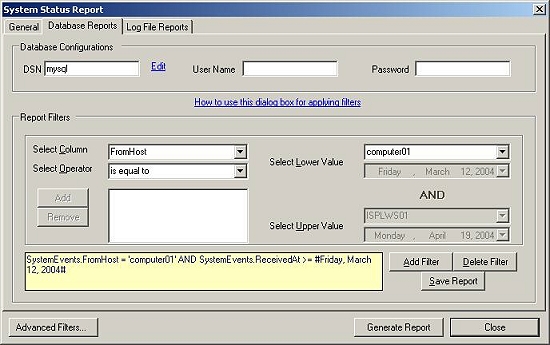
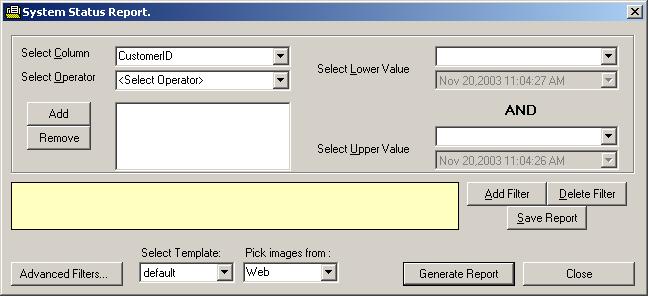
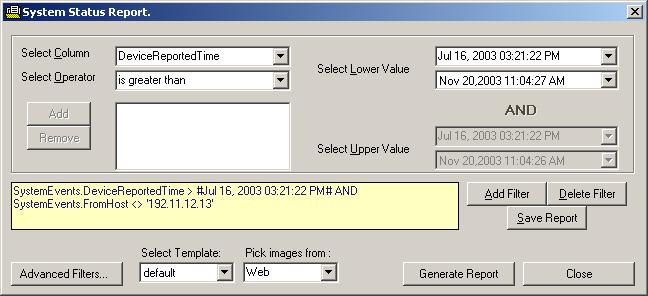
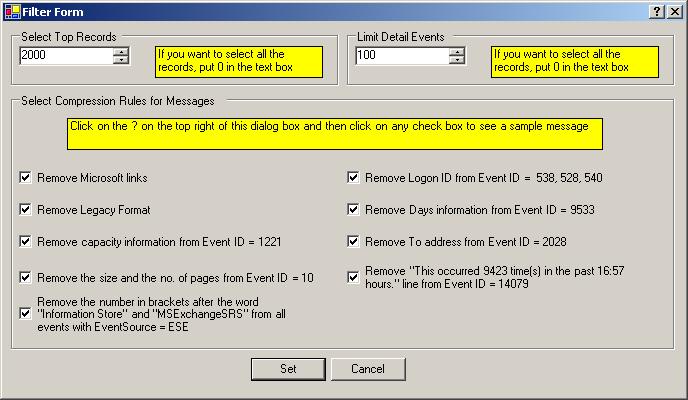
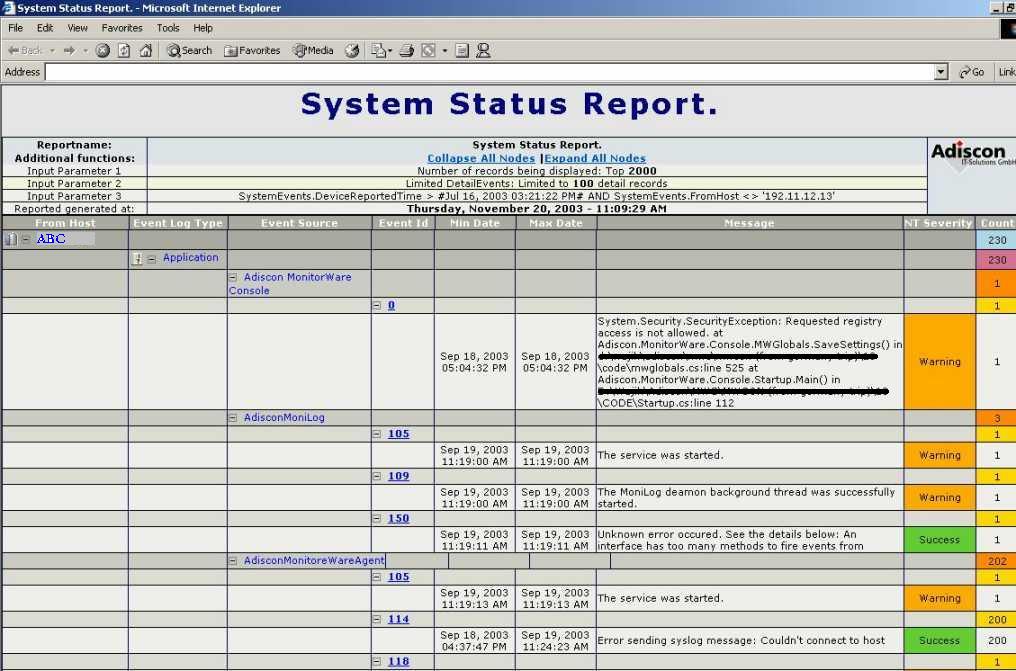
Step 9 – Generating Reports with MonitorWare Console Manually
This section explains how the reports can be generated with MonitorWare
Console manually. Since “System Status” Report is most comprehensive report that
tells a detailed description about the network, in this section I will explain
this report only. Please note that, the procedure for generating any report is
almost the same.
Generating Windows Reports with Console 1.1 Manually
Generating
Windows Reports with Console 2.0 Manually
Step 10 – Scheduling the Generation of Reports with MonitorWare Console
This section explains how the reports can be generated with MonitorWare
Console automatically using Job Manager. With Job Manager, you can generate all
the reports based on a pre-defined schedule and ask it to either store it in
some location on the hard disk or send it to specified recipient via email. Once
again, I will explain the scheduling of System Status Report in this section.
Please note that, the procedure for scheduling any report is the same.
Scheduling Reports with Console 1.1
Scheduling Reports with Console 2.0
You are done!
Well, this is all you need to do to
configure the basic operations. Once you are comfortable with the basic setup,
you can enhance the system with local pre-filtering of event, enhanced logging
and alerting (with MonitorWare Agent) and changing report options (with
MonitorWare Console).
We hope this article is helpful. If you have any questions or remarks,
please do not hesitate to contact us at
support@adiscon.com