Step-By-Step Guides
Article created 2003-04-30 by Rainer Gerhards.
Last Updated 2008-02-04 by Florian Riedl.
Forwarding NT Event Logs to an SETP Server
In this scenario, an event log monitor is used to forward all events written to the NT Event Log to a SETP server. This is another instance of the MonitorWare Agent, typically running at a central hub system. This instance receives the event data generated by the sending MonitorWare Agent/EventReporter and can then act accordingly on it. Please note that by utilizing SETP instead of syslog, the MonitorWare Agent/EventReporter can guarantee reliable delivery. Also, the full event details are preserved: another thing not possible with syslog.
This is a scenario often used in a Windows MonitorWare based management system. The event log monitor is used here to forward events into a central repository, where it will be analyzed using pre-existing procedures. Of course, it could also be combined with other event sources like the file monitor or the ping probe. This has been left out to keep the step-by-step guide simple.
Please note that if you need to forward event log data to a syslog based monitoring system (for example on UNIX), you need to use the syslog forwarder. A step-by-step guide on how this can be done is found at “Forwarding NT Event Logs to a Syslog Server”.
In our example, we assume all events should be forwarded to a SETP server at address 10.0.0.1.
Step 1 – Defining a Rule Set for SETP Forwarding
The rule set specifies what action to carry out. You might be tempted to define the service first, but starting with the rule set makes things easier as it already is present when the service will be defined later and needs to be bound to a rule set.
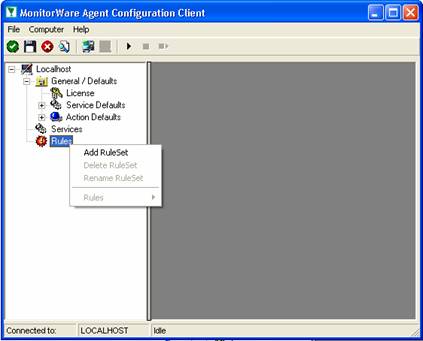
To define a new rule set, right click “Rules”. A pop up menu will appear. Select “Add Rule Set” from this menu. On screen, it looks as follows:
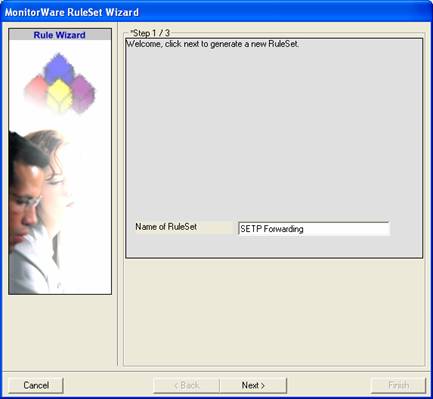
Then, a wizard starts. Change the name of the rule set to whatever name you like. We will use “SETP Forwarding” in this example. The screen looks as follows:
Click “Next”. A new wizard page appears:
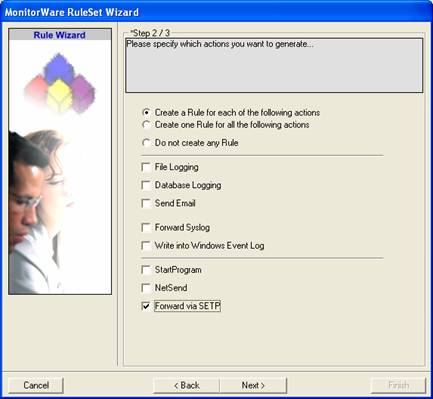
There, select only “Forward via SETP”. Do not select any other options for this sample. Also, leave the “Create a Rule for each of the following actions” setting selected. Click “Next”.
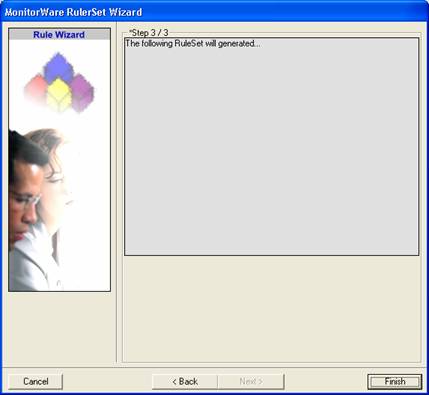
This is just a confirmation page. Click “Finish” to create the rule set.
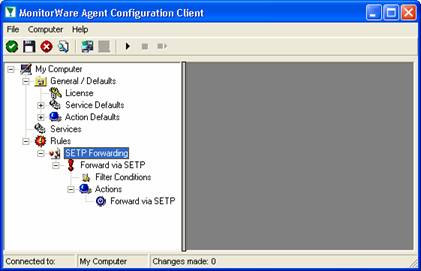
The wizard closes and the client shows a newly created rule set.
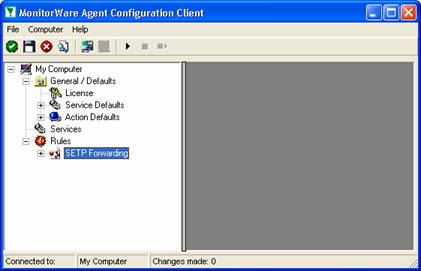
As you can see, the “SETP Forwarding” rule set is now present. Please expand it in the tree view until you have the following screen contents:
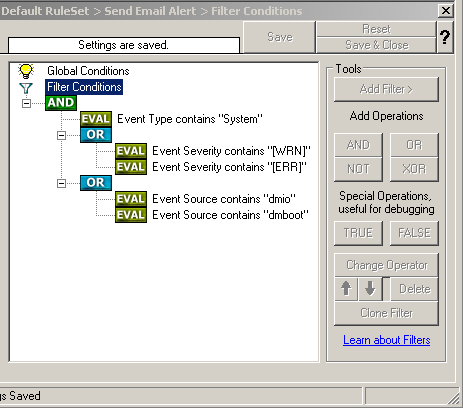
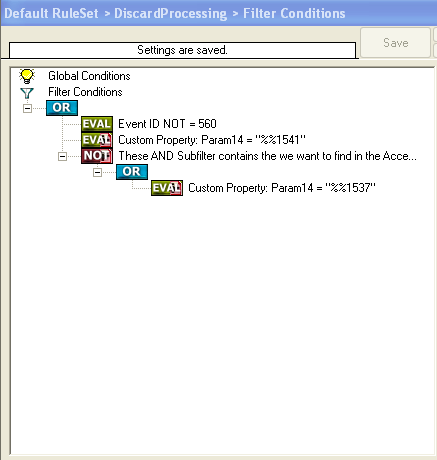
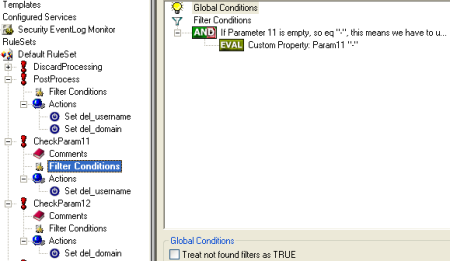
As you can see, we have a “Forward via SETP” action configured. We will review the settings just for your information. Click on “Filter Conditions”:
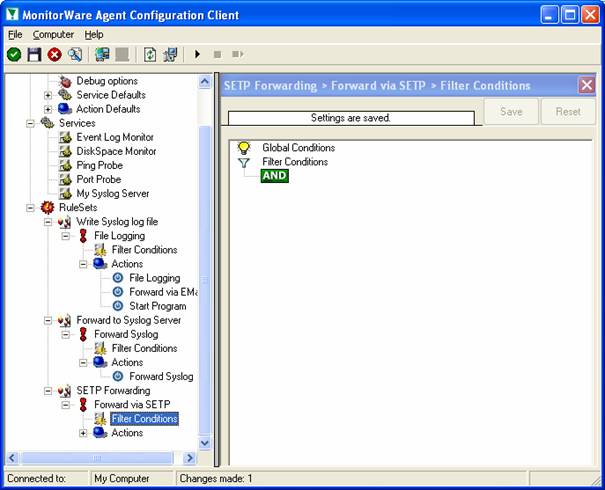
As you can see, none of the filter conditions are enabled. In addition, all weekdays are selected. This means that the all information units (the event log information) will be matched by these filter conditions. As such, the rules for the “Forward via SETP” action will always be carried out.
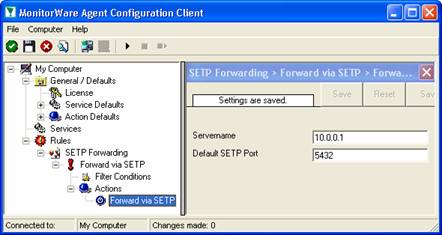
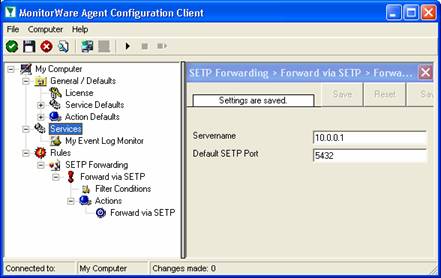
Now let us check the “Forward via SETP” action itself. Please select it in the tree view:
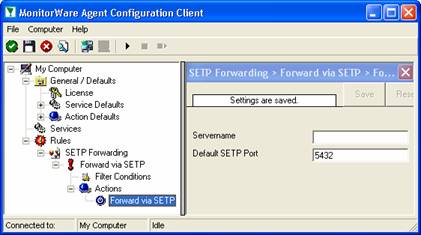
As you can see, some useful defaults are already there. It forwards SETP messages to the standard port of 5432. This value is specified by the SETP standard and an unmodified SETP server expects it. Only change it if you definitely know that the SETP server is configured to use another value. If in doubt, use the default value.
However, there are also some things that need to be completed and changed for this scenario.
The only thing that is missing in our property sheet is the server’s address. You can use either a system name or IP address. In our sample, we will use the IP address, because this is faster and more reliable as it does not depend on DNS name resolution. Our target SETP server is on address 10.0.0.1.
After the changes, the dialog looks as follows:
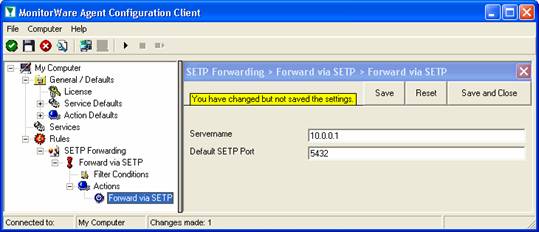
After doing so, you will notice the yellow text on top of the window. It tells you that the configuration changes have not yet been applied. To do so, press “save”.
Now you have a workable rule set for forwarding event monitor data to the SETP server.
Step 2 – Create an Event-Log Monitor Service
Now we need to define an “event log monitor” service. It is the process that monitors the Windows event log for new entries and creates information units as soon as a new entry is found. These information units are then passed to the rule set which in turn forwards them to the SETP server configured in step 1.
Please note that there are some differences in the setup of a SETP supporting event log monitor when compared to the syslog supporting. Of course, the same monitor can be used with both services, but in reality there are a number of format requirements in existing syslog implementations that require a specific format. With SETP, all event information can be transmitted unaltered, so there is no need for any legacy format information.
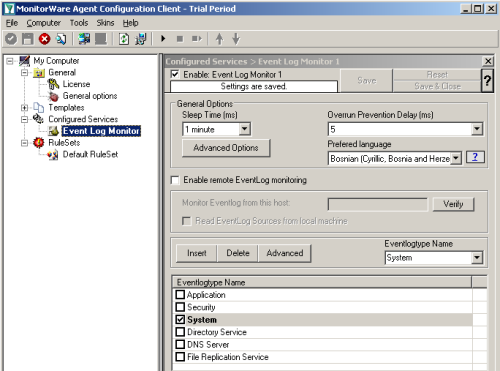
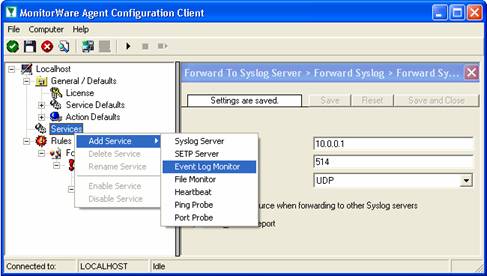
To define the event log monitor, right click on “Services”, then select “Add Service” and the “Event Log Monitor”:
Once you have done so, a new wizard starts:
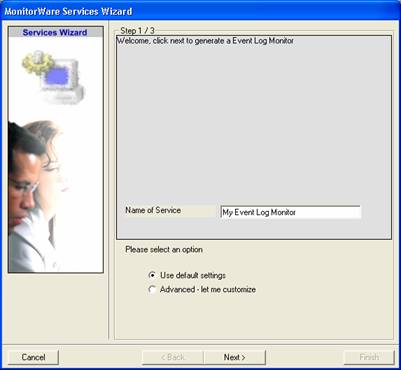
Again, you can use either the default name or any one you like. We will use “My Event Log Monitor” in this sample. Leave the “Use default settings” selected and press “Next”:
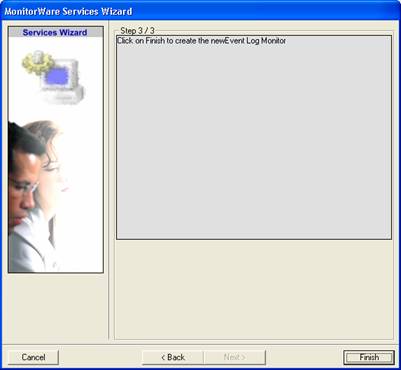
As we have used the default, the wizard will immediately proceed with step 3, the confirmation page. Press “Finish” to create the service. The wizard completes and returns to the configuration client. There, you will see the newly created service beneath the “Services” part of the tree view:
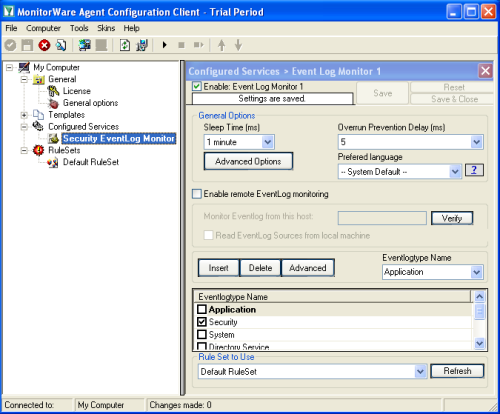
To check its parameters, select it:

As you can see, the service has been created with the default parameters. As such, it monitors all event logs that are present on the system. It also has some protection against overruns of the receiving system or intermediary routers. It monitors the event log in a 60 second interval (sleep time of 60.000 milliseconds), which is the recommended value for typical installations.
Please note that the “SETP Forwarding” rule set has been automatically assigned as the rule set to use. This is the case because we already created it and it is the only rule set. By default, the wizard will always assign the first rule set visible in the tree view to new services. If that is not the intended rule set, you need to change it to the correct one here in the service definition.
Also, please note that the wizard uses the default properties from the “Service Defaults”. Obviously, if these are changed, the default properties for new services will differ.
In contrast to the syslog sample, we do not need to change any settings. Specifically, the “Use Legacy Format” checkbox does not need to be checked, as SETP is capable of forwarding all events log-data in native format.
Finally, we review the log specific advanced properties. As a sample, we will go over the application log advanced properties. To do so, click the “Advanced” button:

For our sample, the “Syslog Facility” is not relevant and can be left at the default. Also leave the “Report Truncated Log” option checked. This option will generate a warning message if the respective Windows log is truncated, for example by operator request. If that happens during day-to-day operations in you environment, you might want to uncheck it.
Click OK to return to the main property sheet.
This procedure completes the configuration of the event log monitor.
Step 3 – (Re) Start the Agent Service
MonitorWare Agent/EventReporter cannot dynamically read changed configurations. As such, it needs to be restarted after such changes. In our sample, the service was not yet started, so we simply need to start it. If it already runs, you need to restart it.
Service control can be done with both the respective operating system capabilities (like service manager MMC) or with the configuration client. These are shown in the red surrounded area in the following screen shot:
The buttons resemble Windows service manager – start, stop and restart. In this sample, stop and restart are grayed out because the service is not running.
After service restart, the new definitions are active and MonitorWare Agent/EventReporter will forward all events from the Windows event log to the configured SETP server. Please note that on the first run, all already existing events will be forwarded. Therefore, this might take a little while. On all successive service start, only new events will be forwarded.