MonitorWare Agent 5.2 Released
Build-IDs: Service 5.2.348, Client 5.2.1196
New Additions |
|
Log Consolidator and Alerter
Build-IDs: Service 5.2.348, Client 5.2.1196
New Additions |
|
Article created 2008-03-06 by Andre Lorbach.
This article will guide you to use MonitorWare Agent to generate SNMP Traps from EventLog entries and send them to your SNMP management software. This article also requires at least MonitorWare Agent 5.2 or higher, and the custom ADISCON mibs which are included since MonitorWare Agent 5.2.
1. Configuring MonitorWare Agent
1.1 Download and Install MonitorWare Agent
1.2 Setup a EventLog Monitor in MonitorWare Agent
2. Configuring the SNMP Trap
2.1 Create SNMP Trap Action
2.2 Filtering for EventLog severity (Optional)
2.3 Start sending SNMP Trap
| So if you haven’t done so already, go to www.mwagent.com and download the latest MonitorWare Agent Version. It is always recommended to use the latest Version of MonitorWare Agent. Once the Download is done, go ahead and install it. You may have to restart after installation, this depends on your System. |
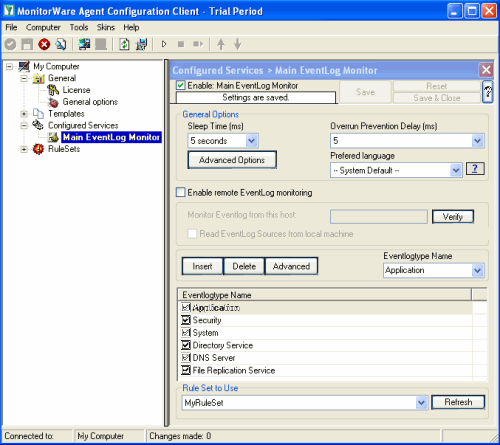 Start the MonitorWare Agent Client and skip the wizard on startup. Start the MonitorWare Agent Client and skip the wizard on startup.Then add a new EventLog Monitor called “Main EventLog Monitor”. I have set the Sleep time to 5 seconds, for testing purposes. But you can also set this value to 5 seconds in production, it won’t have much impact on the Servers performance. You also might unselect EventLog Types you do not want to monitor, for this article I will allow all EventLog Types. |
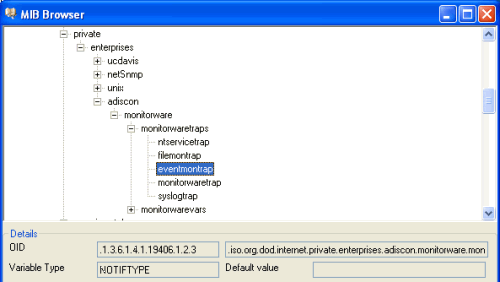 Now add a new Rule under your Default RuleSet called SendTrap. Then add a Send SNMPTrap Action. The default values will already generate a generic “monitorwaretrap”, which is fine for most cases. But we are going to configure our own trap properties. So you have noticed that the Trap OID and the variable OID’s are represented numeric. Once you click on the Browser Button, the Client will automatically load and display the installed mibs. You can configure the Configuration Client to automatically load the mibs during each startup in the Client Options. So as you can see you have a few trap OID’s available, in this article we will use the eventmontrap OID which is “.1.3.6.1.4.1.19406.1.2.3”, or in human readable form “ADISCON-MONITORWARE-MIB::eventmontrap”. You can actually define the one or the other form as OID, both will work but the textual representation only if you have the ADISCON Mibs installed. The the numeric representation is always the saver way to configure the OID’s. |
| Back to Top |
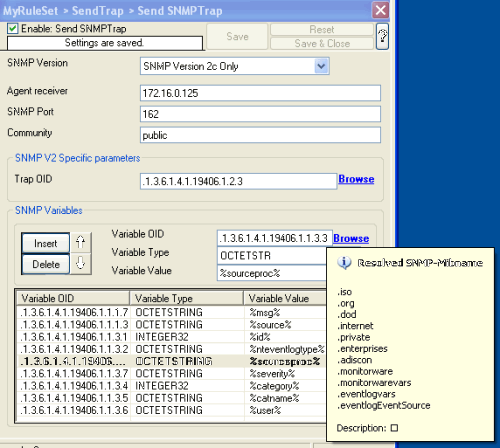 Now what you don’t see in the mib browser is the list of variables which are connected with the SNMP Trap. For the eventmontrap, we need a few snmp variables: Now what you don’t see in the mib browser is the list of variables which are connected with the SNMP Trap. For the eventmontrap, we need a few snmp variables:genMsg, Start removing the default configured variable, and add our own ones (as in the list above). Add one variable, and use the Mib Browser to select the suitable OID’s and also the correct variable values (See the screenshot for more). |
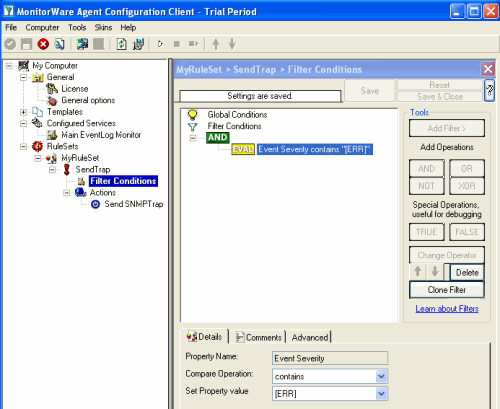 With our current setup, you would send one SNMP Trap for each incoming Syslog messages. But you may not want this, so you can optionally add some filters to reduce the number of outgoing SNMP Traps. With our current setup, you would send one SNMP Trap for each incoming Syslog messages. But you may not want this, so you can optionally add some filters to reduce the number of outgoing SNMP Traps.For example you can add a Syslog Severity (Priority) filter, so that only EventLog entries with error messages will be send as trap to your SNMP Manager. |
| Now you are ready to start the MonitorWare Agent, note that you properly will get a lot of SNMP Events during the first run. To show you how the result looks like, here is the output of snmptrapd on a linux machine. There are many SNMP Manager utilities out there, you can even receive SNMP Traps with MonitorWare Agent itself if you like. 2008-03-07 15:18:31 172.16.0.122 [UDP: [172.16.0.122]:1119]: When you receive the trap with MonitorWare Agent, the message output will look like this: MonitorWare: source=”172.16.0.122″ community=”public” version=”Ver2″ variables: snmp_var_1 = ‘DISMAN-EVENT-MIB::sysUpTimeInstance: ‘Timeticks: (741870389) 85 days, 20:45:03.89” , snmp_var_2 = ‘SNMPv2-MIB::snmpTrapOID.0: ‘OID: ADISCON-MONITORWARE-MIB::syslogtrap” , snmp_var_3 = ‘ADISCON-MONITORWARE-MIB::syslogMsg: ‘STRING: “MWAgent: This is a Test Error MEssage no. 1″” , snmp_var_4 = ‘ADISCON-MONITORWARE-MIB::syslogSeverity: ‘INTEGER: error(3)” , snmp_var_5 = ‘ADISCON-MONITORWARE-MIB::syslogFacility: ‘INTEGER: local0(16)” As you can see eventlogEventCategoryID and eventlogEventCategoryName are missing. Most EventLog entries do not have a Event Category assigned, so these variables are not added into the SNMP Trap. |
I hope this article will help you solving your tasks or shows you the potential of MonitorWare Agent, and what you can archive with it. Feel free to email me for recommendations or questions. Of course, the outlined actions are only samples and you may do other things with them.
Article created 2008-03-06 by Andre Lorbach.
This article will guide you to use MonitorWare Agent to generate generic SNMP Traps and send them to your SNMP management software. It is also possible to use WinSyslog instead of MonitorWare Agent in some cases, however this article will target the more powerful MonitorWare Agent. This article also requires at least MonitorWare Agent 5.2 or higher, and the custom ADISCON mibs which are included since MonitorWare Agent 5.2.
As you know MonitorWare Agent has many different input sources (services) from which we can generate useful traps. In this article, I will show you how to generate a SNMP Trap from a received Syslog message, so we are going to use the Syslog Service.
1. Configuring MonitorWare Agent
1.1 Download and Install MonitorWare Agent
1.2 Setup a Syslog Server in MonitorWare Agent
2. Configuring the SNMP Trap
2.1 Create SNMP Trap Action
2.2 Filtering Syslog messages (Optional)
2.3 Sending a test SNMP Trap
| So if you haven’t done so already, go to www.mwagent.com and download the latest MonitorWare Agent Version. It is always recommended to use the latest Version of MonitorWare Agent. Once the Download is done, go ahead and install it. You may have to restart after installation, this depends on your System. |
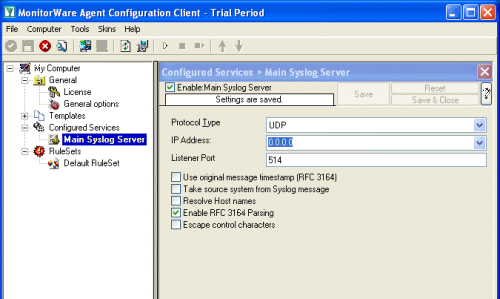 Start the MonitorWare Agent Client and skip the wizard on startup. Start the MonitorWare Agent Client and skip the wizard on startup.Then add a new Syslog Service called “Main Syslog Server”. We use default values here, Port 514 UDP. Leave the other Options as they are. |
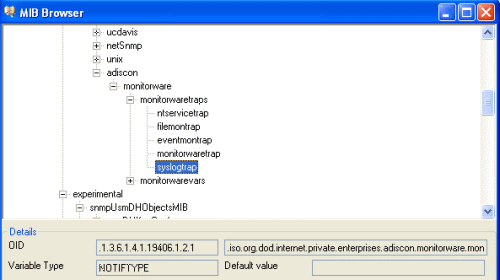 First add a new Rule under your Default RuleSet called SendTrap. Then add a Send SNMPTrap Action. The default values will already generate a generic “monitorwaretrap”, which is fine for most cases. But we are going to configure our own trap properties. So you have noticed that the Trap OID and the variable OID’s are represented numeric. Once you click on the Browser Button, the Client will automatically load and display the installed mibs. You can configure the Configuration Client to automatically load the mibs during each startup in the Client Options. So as you can see you have a few trap OID’s available, in this article we will use the syslogtrap OID which is “.1.3.6.1.4.1.19406.1.2.1”, or in human readable form “ADISCON-MONITORWARE-MIB::syslogtrap”. You can actually define the one or the other form as OID, both will work but the textual representation only if you have the ADISCON Mibs installed. |
| Back to Top |
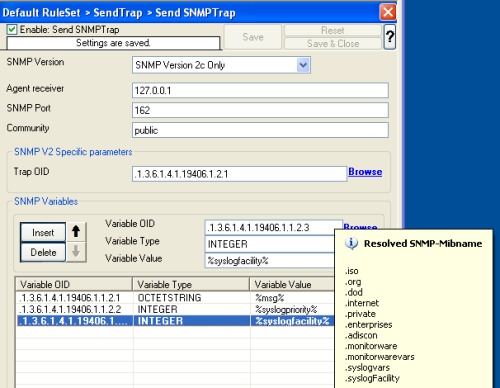 Now what you don’t see in the mib browser is the list of variables which are connected with the SNMP Trap. For the syslogtrap, we need syslogMsg, syslogSeverity and syslogFacility. Now what you don’t see in the mib browser is the list of variables which are connected with the SNMP Trap. For the syslogtrap, we need syslogMsg, syslogSeverity and syslogFacility.So we are going to remove the default configured variable, and add our own ones, for the message, syslog severity and syslog facility. Kindly add 3 new variables, you use the Mib Browser to select the suitable OID’s and also the correct variable values (See the screenshot for more). |
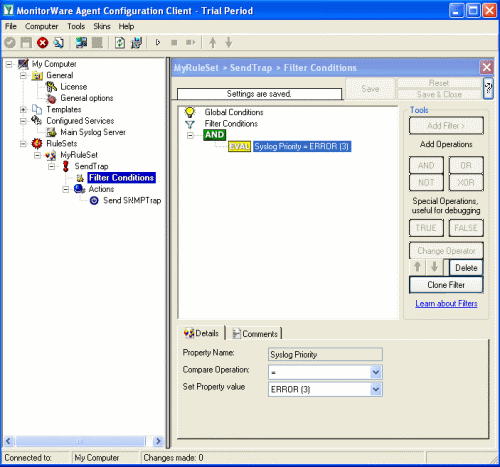 With our current setup, you would send one SNMP Trap for each incoming Syslog messages. But you may not want this, so you can optionally add some filters to reduce the number of outgoing SNMP Traps. With our current setup, you would send one SNMP Trap for each incoming Syslog messages. But you may not want this, so you can optionally add some filters to reduce the number of outgoing SNMP Traps.For example you can add a Syslog Severity (Priority) filter, so that only syslog error messages will be send as trap to your SNMP Manager. |
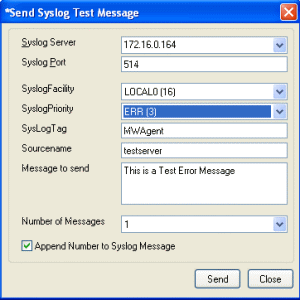 The easiest way to create a SNMP Trap for testing now is use the “Send Syslog Test Message” from the Configuration Client tools menu. If you configured filters, don’t forget to set the correct syslog facility and priority. |
| Back to Top |
To show you how the result looks like, here is the output of snmptrapd on a linux machine. There are many SNMP Manager utilities out there, you can even receive SNMP Traps with MonitorWare Agent itself if you like. 2008-03-07 15:18:31 172.16.0.122 [UDP: [172.16.0.122]:1119]: When you receive the trap with MonitorWare Agent, the message output will look like this: MonitorWare: source=”172.16.0.122″ community=”public” version=”Ver2″ variables: snmp_var_1 = ‘DISMAN-EVENT-MIB::sysUpTimeInstance: ‘Timeticks: (741870389) 85 days, 20:45:03.89” , snmp_var_2 = ‘SNMPv2-MIB::snmpTrapOID.0: ‘OID: ADISCON-MONITORWARE-MIB::syslogtrap” , snmp_var_3 = ‘ADISCON-MONITORWARE-MIB::syslogMsg: ‘STRING: “MWAgent: This is a Test Error MEssage no. 1″” , snmp_var_4 = ‘ADISCON-MONITORWARE-MIB::syslogSeverity: ‘INTEGER: error(3)” , snmp_var_5 = ‘ADISCON-MONITORWARE-MIB::syslogFacility: ‘INTEGER: local0(16)” |
I hope this article will help you solving your tasks or shows you the potential of MonitorWare Agent, and what you can archive with it. Feel free to email me for recommendations or questions. Of course, the outlined actions are only samples and you may do other things with them.
Created 2008-02-28 by Andre Lorbach
The last official version of MWAgent which is supported on Windows NT4 is version 3.1 Build 292.
Due to customer requests, we have created a special build of MonitorWare Agent version 4.4a which will also work on Windows NT4. However this will definitely be the last official build which will work on NT4. The newer versions of MWAgent are using features which are only available on Windows 2000 or higher. Please note that the installer used for MonitorWare Agent 4.4 can not be run under NT4. As such, the setup procedure is a bit clumpsy.
If any problems occur, feel free to send us an email to support@adiscon.com.
Article created 2008-02-26 by Andre Lorbach.
This article will help you to monitor SNMP capable devices using the new SNMP Monitor Service of MonitorWare Agent. There are many devices out there which support SNMP, and can also be queried for information’s using SNMP GET. We will use SNMP GET to monitor a device, if we get a respond, the device is most likely running. If we do not get a response, the device may be offline or is powered off. We will use the Send Email Action to generate Alert Emails in case of that a monitored device is not responding anymore.
As I said earlier there are many devices out there which do support SNMP like printers, routers, managed switches, linux / windows server and so on. In this article I will show you how to setup the SNMP Monitor Service to monitor a HP LaserJet 4000 laser printer.
1. SNMP Device (Printer) Setup
1.1 Configuring the Printer
2. Configuring MonitorWare Agent
2.1 Download and Install MonitorWare Agent
2.2 Setup Basics in MonitorWare Agent
2.3 Create a Forwarding Rule for the InterActive SyslogViewer (Optional!)
2.4 Create an Email alert
2.5 Configure Filters for the Email Alert
Final Thoughts
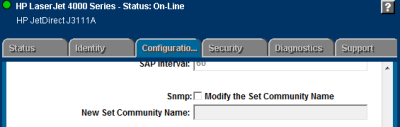 As far as I know this printer does not need any special setting to have SNMP support enabled. So by default SNMP is enabled, and it is possible to overwrite the used snmp community name. However for this article I will not modify this setting. The only thing we will need for this device is it’s IP Address which is 172.16.0.15. |
| Back to Top |
| So if you haven’t done so already, go to www.mwagent.com and download the latest MonitorWare Agent Version. It is always recommended to use the latest Version of MonitorWare Agent. Once the Download is done, go ahead and install it. You may have to restart after installation, this depends on your System. (This article will only work with MonitorWare Agent 5.2 or higher). |
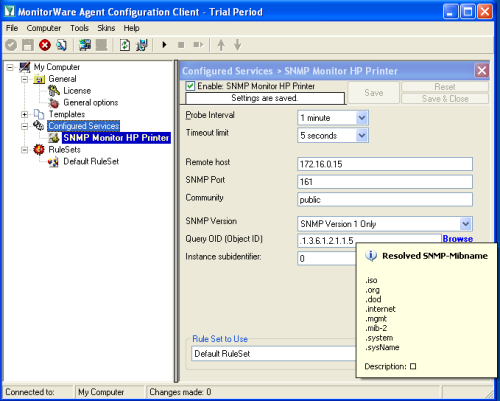 Start the MonitorWare Agent Client and skip the wizard on startup. First we create new “SNMP Monitor” Service by right clicking the Configured Services node and going to the Add Service menu. Insert the IP of the device you want to monitor in the remote host field. You can leave the default values for the other configuration options, they will work fine for most devices. The Query OID I use in this sample will query the system name of the device. However there are several other variables you pick for monitoring such as:
Other OID’s might also be available, it depends on device you are monitoring. There is also a Instance subidentifier option available. I recommend to leave this value to 0, it is only useful if you want to query a OID which contains multiple data. |
| Back to Top |
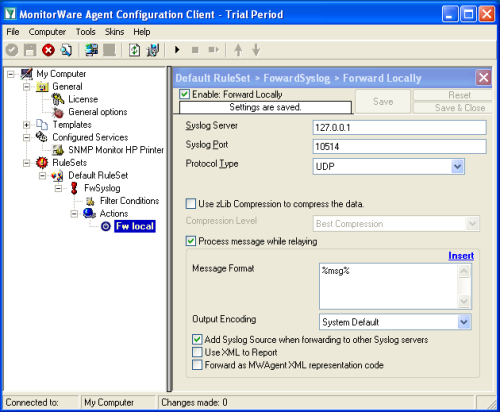 This is an optional step, only useful for testing and debugging the SNMP Monitor. You can disable the Action of this rule later if you want. As we are using the UDP protocol to forward syslog messages locally, it doesn’t really matter. So first of all create a new Rule called “FwSyslog” and add a new Forward Syslog Action. The Syslog Server is 127.0.0.1 and the syslog port is 10514. See the screenshot for more details. |
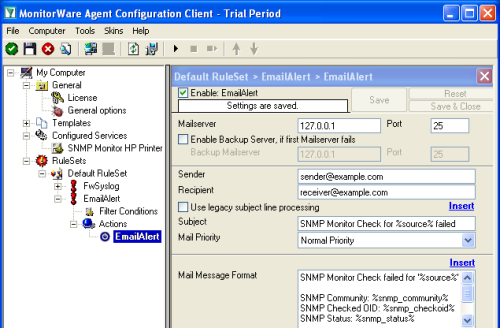 The best option to get alerted is by email. So we create another rule called EmailAlert and add a Forward Email Action. Please fill Sender, Recipient and Mailserver configuration yourself. Use the following text as mail subject: Use the following text as message format: |
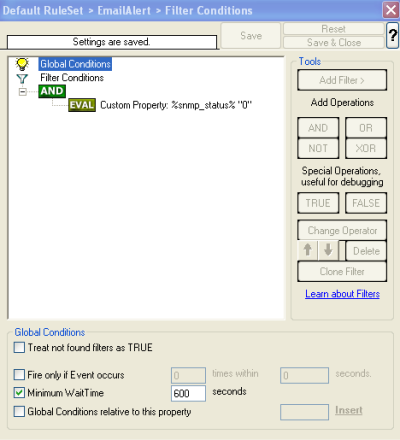 We were not finished yet ;). We need to configure some filters, otherwise you would get one Email for each SNMP Monitor check, even if successfully. So add a new Custom Property filter, with the property name “%snmp_status%”. Use the compare operation “not equal” and Property Valur of “0”. So this means the Actions in this rule will be fired whenever the status is not 0, and every status which is not 0 means there was an error. To avoid email flooding, set the Minimum WaitTime to 600 seconds. This means it doesn’t matter how failures are generated, in 10 minutes there will only be one email alert. |
I hope this article will help you solving your tasks or shows you the potential of MonitorWare Agent, and what you can archive with it. Feel free to email me for recommendations or questions. Of course, the outlined actions are only samples and you may do other things with them, for example store log records to a database table instead of storing them to file.
Created 2008-02-13 by Florian Riedl.
Every of our products (EventReporter, MonitorWare Agent and WinSyslog) contain a action which is able to send messages to the communications port of the PC. The question is, if it is possible, to use a GSM modem connected to this port for realtime SMS alerting.
The “Send to communication port”-action allows you to directly send data to the com-port of a PC. If you have a modem connected, the device will receive the message and interpret it’s content and acts as programmed. In most cases, you would possibly connect a serial audit printer or for example a separate display for showing recent log data. For this, in most cases, the pure message and a line feed will be sufficient.
For sending to a modem device, in this case a GSM modem, you would need to know, how the message must look like for the GSM modem to send a SMS with the message to a specific recipient. So in general, this is quite likely to work, but we have no information on stock how to setup a specific message.
The easiest way to achieve SMS alerting is by using a E-Mail2SMS service. There are several service providers on the web who provide the possibility to send a E-Mail to a gateway host, which will then send a SMS with the log message to a specified mobile phone number. This is a idea, which is most likely to work.
Anyway, both ideas are likely to get cost-intensive. Once a large number of errors occur, which should be forwarded, this could get out of control. We recommend to use filter settings in order to get only emergency alerts via sms. In any case, this kind of alerting is connected with extra costs.
Different providers are listed here:
Article created 2003-04-30 by Rainer Gerhards.
Last Updated 2008-02-04 by Florian Riedl.
In this scenario, an event log monitor is used to forward all events written to the NT Event Log to a SETP server. This is another instance of the MonitorWare Agent, typically running at a central hub system. This instance receives the event data generated by the sending MonitorWare Agent/EventReporter and can then act accordingly on it. Please note that by utilizing SETP instead of syslog, the MonitorWare Agent/EventReporter can guarantee reliable delivery. Also, the full event details are preserved: another thing not possible with syslog.
This is a scenario often used in a Windows MonitorWare based management system. The event log monitor is used here to forward events into a central repository, where it will be analyzed using pre-existing procedures. Of course, it could also be combined with other event sources like the file monitor or the ping probe. This has been left out to keep the step-by-step guide simple.
Please note that if you need to forward event log data to a syslog based monitoring system (for example on UNIX), you need to use the syslog forwarder. A step-by-step guide on how this can be done is found at “Forwarding NT Event Logs to a Syslog Server”.
In our example, we assume all events should be forwarded to a SETP server at address 10.0.0.1.
The rule set specifies what action to carry out. You might be tempted to define the service first, but starting with the rule set makes things easier as it already is present when the service will be defined later and needs to be bound to a rule set.
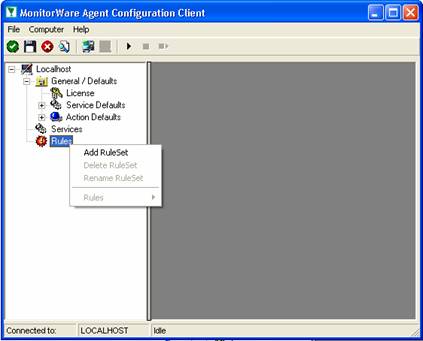
To define a new rule set, right click “Rules”. A pop up menu will appear. Select “Add Rule Set” from this menu. On screen, it looks as follows:
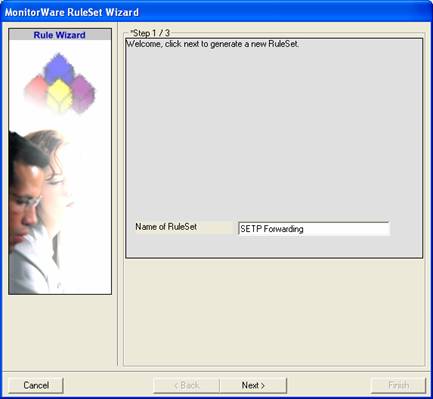
Then, a wizard starts. Change the name of the rule set to whatever name you like. We will use “SETP Forwarding” in this example. The screen looks as follows:
Click “Next”. A new wizard page appears:
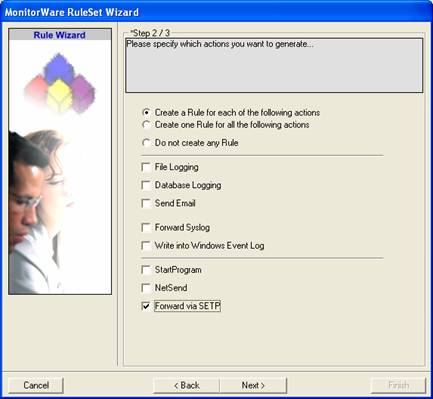
There, select only “Forward via SETP”. Do not select any other options for this sample. Also, leave the “Create a Rule for each of the following actions” setting selected. Click “Next”.
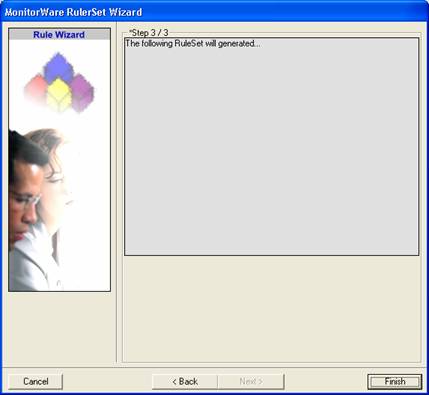
This is just a confirmation page. Click “Finish” to create the rule set.
The wizard closes and the client shows a newly created rule set.
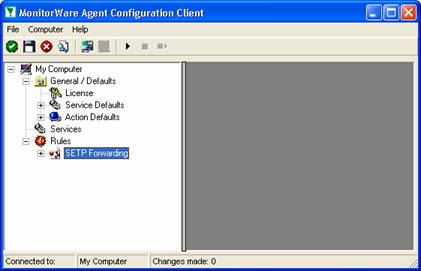
As you can see, the “SETP Forwarding” rule set is now present. Please expand it in the tree view until you have the following screen contents:
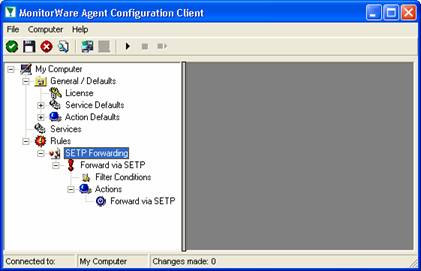
As you can see, we have a “Forward via SETP” action configured. We will review the settings just for your information. Click on “Filter Conditions”:
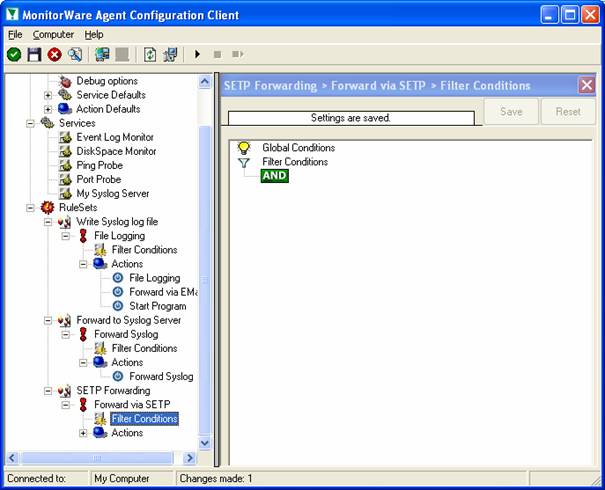
As you can see, none of the filter conditions are enabled. In addition, all weekdays are selected. This means that the all information units (the event log information) will be matched by these filter conditions. As such, the rules for the “Forward via SETP” action will always be carried out.
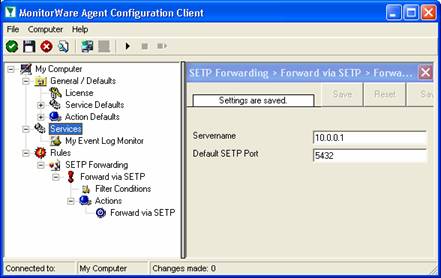
Now let us check the “Forward via SETP” action itself. Please select it in the tree view:
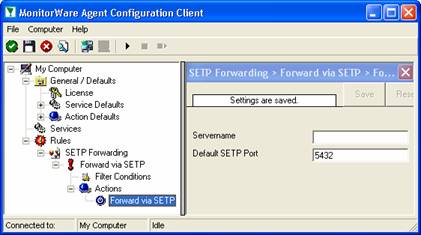
As you can see, some useful defaults are already there. It forwards SETP messages to the standard port of 5432. This value is specified by the SETP standard and an unmodified SETP server expects it. Only change it if you definitely know that the SETP server is configured to use another value. If in doubt, use the default value.
However, there are also some things that need to be completed and changed for this scenario.
The only thing that is missing in our property sheet is the server’s address. You can use either a system name or IP address. In our sample, we will use the IP address, because this is faster and more reliable as it does not depend on DNS name resolution. Our target SETP server is on address 10.0.0.1.
After the changes, the dialog looks as follows:
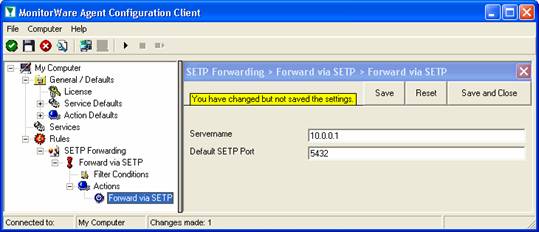
After doing so, you will notice the yellow text on top of the window. It tells you that the configuration changes have not yet been applied. To do so, press “save”.
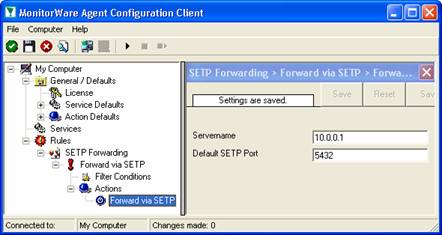
Now you have a workable rule set for forwarding event monitor data to the SETP server.
Now we need to define an “event log monitor” service. It is the process that monitors the Windows event log for new entries and creates information units as soon as a new entry is found. These information units are then passed to the rule set which in turn forwards them to the SETP server configured in step 1.
Please note that there are some differences in the setup of a SETP supporting event log monitor when compared to the syslog supporting. Of course, the same monitor can be used with both services, but in reality there are a number of format requirements in existing syslog implementations that require a specific format. With SETP, all event information can be transmitted unaltered, so there is no need for any legacy format information.
To define the event log monitor, right click on “Services”, then select “Add Service” and the “Event Log Monitor”:
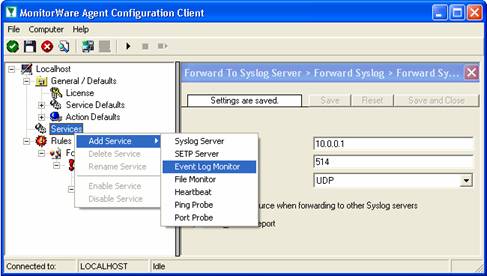
Once you have done so, a new wizard starts:
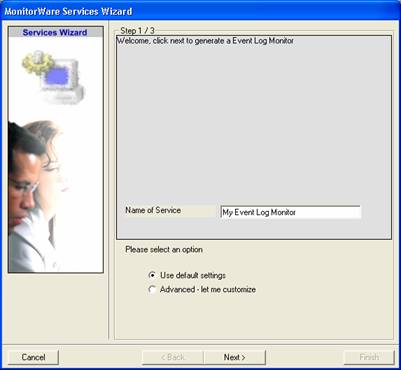
Again, you can use either the default name or any one you like. We will use “My Event Log Monitor” in this sample. Leave the “Use default settings” selected and press “Next”:
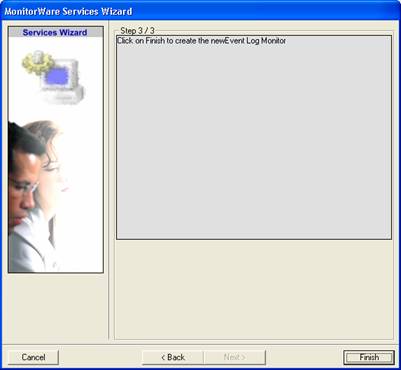
As we have used the default, the wizard will immediately proceed with step 3, the confirmation page. Press “Finish” to create the service. The wizard completes and returns to the configuration client. There, you will see the newly created service beneath the “Services” part of the tree view:
To check its parameters, select it:

As you can see, the service has been created with the default parameters. As such, it monitors all event logs that are present on the system. It also has some protection against overruns of the receiving system or intermediary routers. It monitors the event log in a 60 second interval (sleep time of 60.000 milliseconds), which is the recommended value for typical installations.
Please note that the “SETP Forwarding” rule set has been automatically assigned as the rule set to use. This is the case because we already created it and it is the only rule set. By default, the wizard will always assign the first rule set visible in the tree view to new services. If that is not the intended rule set, you need to change it to the correct one here in the service definition.
Also, please note that the wizard uses the default properties from the “Service Defaults”. Obviously, if these are changed, the default properties for new services will differ.
In contrast to the syslog sample, we do not need to change any settings. Specifically, the “Use Legacy Format” checkbox does not need to be checked, as SETP is capable of forwarding all events log-data in native format.
Finally, we review the log specific advanced properties. As a sample, we will go over the application log advanced properties. To do so, click the “Advanced” button:

For our sample, the “Syslog Facility” is not relevant and can be left at the default. Also leave the “Report Truncated Log” option checked. This option will generate a warning message if the respective Windows log is truncated, for example by operator request. If that happens during day-to-day operations in you environment, you might want to uncheck it.
Click OK to return to the main property sheet.
This procedure completes the configuration of the event log monitor.
MonitorWare Agent/EventReporter cannot dynamically read changed configurations. As such, it needs to be restarted after such changes. In our sample, the service was not yet started, so we simply need to start it. If it already runs, you need to restart it.
Service control can be done with both the respective operating system capabilities (like service manager MMC) or with the configuration client. These are shown in the red surrounded area in the following screen shot:
The buttons resemble Windows service manager – start, stop and restart. In this sample, stop and restart are grayed out because the service is not running.
After service restart, the new definitions are active and MonitorWare Agent/EventReporter will forward all events from the Windows event log to the configured SETP server. Please note that on the first run, all already existing events will be forwarded. Therefore, this might take a little while. On all successive service start, only new events will be forwarded.
Article created 2003-04-30 by Rainer Gerhards.
Last Updated 2008-02-04 by Florian Riedl.
In this scenario, an event log monitor is used to forward all events written to the NT Event Log to a SETP server. This is another instance of the MonitorWare Agent, typically running at a central hub system. This instance receives the event data generated by the sending MonitorWare Agent/EventReporter and can then act accordingly on it. Please note that by utilizing SETP instead of syslog, the MonitorWare Agent/EventReporter can guarantee reliable delivery. Also, the full event details are preserved: another thing not possible with syslog.
This is a scenario often used in a Windows MonitorWare based management system. The event log monitor is used here to forward events into a central repository, where it will be analyzed using pre-existing procedures. Of course, it could also be combined with other event sources like the file monitor or the ping probe. This has been left out to keep the step-by-step guide simple.
Please note that if you need to forward event log data to a syslog based monitoring system (for example on UNIX), you need to use the syslog forwarder. A step-by-step guide on how this can be done is found at “Forwarding NT Event Logs to a Syslog Server”.
In our example, we assume all events should be forwarded to a SETP server at address 10.0.0.1.
The rule set specifies what action to carry out. You might be tempted to define the service first, but starting with the rule set makes things easier as it already is present when the service will be defined later and needs to be bound to a rule set.
To define a new rule set, right click “Rules”. A pop up menu will appear. Select “Add Rule Set” from this menu. On screen, it looks as follows:
Then, a wizard starts. Change the name of the rule set to whatever name you like. We will use “SETP Forwarding” in this example. The screen looks as follows:
Click “Next”. A new wizard page appears:
There, select only “Forward via SETP”. Do not select any other options for this sample. Also, leave the “Create a Rule for each of the following actions” setting selected. Click “Next”.
This is just a confirmation page. Click “Finish” to create the rule set.
The wizard closes and the client shows a newly created rule set.
As you can see, the “SETP Forwarding” rule set is now present. Please expand it in the tree view until you have the following screen contents:
As you can see, we have a “Forward via SETP” action configured. We will review the settings just for your information. Click on “Filter Conditions”:
As you can see, none of the filter conditions are enabled. In addition, all weekdays are selected. This means that the all information units (the event log information) will be matched by these filter conditions. As such, the rules for the “Forward via SETP” action will always be carried out.
Now let us check the “Forward via SETP” action itself. Please select it in the tree view:
As you can see, some useful defaults are already there. It forwards SETP messages to the standard port of 5432. This value is specified by the SETP standard and an unmodified SETP server expects it. Only change it if you definitely know that the SETP server is configured to use another value. If in doubt, use the default value.
However, there are also some things that need to be completed and changed for this scenario.
The only thing that is missing in our property sheet is the server’s address. You can use either a system name or IP address. In our sample, we will use the IP address, because this is faster and more reliable as it does not depend on DNS name resolution. Our target SETP server is on address 10.0.0.1.
After the changes, the dialog looks as follows:
After doing so, you will notice the yellow text on top of the window. It tells you that the configuration changes have not yet been applied. To do so, press “save”.
Now you have a workable rule set for forwarding event monitor data to the SETP server.
Now we need to define an “event log monitor” service. It is the process that monitors the Windows event log for new entries and creates information units as soon as a new entry is found. These information units are then passed to the rule set which in turn forwards them to the SETP server configured in step 1.
Please note that there are some differences in the setup of a SETP supporting event log monitor when compared to the syslog supporting. Of course, the same monitor can be used with both services, but in reality there are a number of format requirements in existing syslog implementations that require a specific format. With SETP, all event information can be transmitted unaltered, so there is no need for any legacy format information.
To define the event log monitor, right click on “Services”, then select “Add Service” and the “Event Log Monitor”:
Once you have done so, a new wizard starts:
Again, you can use either the default name or any one you like. We will use “My Event Log Monitor” in this sample. Leave the “Use default settings” selected and press “Next”:
As we have used the default, the wizard will immediately proceed with step 3, the confirmation page. Press “Finish” to create the service. The wizard completes and returns to the configuration client. There, you will see the newly created service beneath the “Services” part of the tree view:
To check its parameters, select it:
As you can see, the service has been created with the default parameters. As such, it monitors all event logs that are present on the system. It also has some protection against overruns of the receiving system or intermediary routers. It monitors the event log in a 60 second interval (sleep time of 60.000 milliseconds), which is the recommended value for typical installations.
Please note that the “SETP Forwarding” rule set has been automatically assigned as the rule set to use. This is the case because we already created it and it is the only rule set. By default, the wizard will always assign the first rule set visible in the tree view to new services. If that is not the intended rule set, you need to change it to the correct one here in the service definition.
Also, please note that the wizard uses the default properties from the “Service Defaults”. Obviously, if these are changed, the default properties for new services will differ.
In contrast to the syslog sample, we do not need to change any settings. Specifically, the “Use Legacy Format” checkbox does not need to be checked, as SETP is capable of forwarding all events log-data in native format.
Finally, we review the log specific advanced properties. As a sample, we will go over the application log advanced properties. To do so, click the “Advanced” button:
For our sample, the “Syslog Facility” is not relevant and can be left at the default. Also leave the “Report Truncated Log” option checked. This option will generate a warning message if the respective Windows log is truncated, for example by operator request. If that happens during day-to-day operations in you environment, you might want to uncheck it.
Click OK to return to the main property sheet.
This procedure completes the configuration of the event log monitor.
MonitorWare Agent/EventReporter cannot dynamically read changed configurations. As such, it needs to be restarted after such changes. In our sample, the service was not yet started, so we simply need to start it. If it already runs, you need to restart it.
Service control can be done with both the respective operating system capabilities (like service manager MMC) or with the configuration client. These are shown in the red surrounded area in the following screen shot:
The buttons resemble Windows service manager – start, stop and restart. In this sample, stop and restart are grayed out because the service is not running.
After service restart, the new definitions are active and MonitorWare Agent/EventReporter will forward all events from the Windows event log to the configured SETP server. Please note that on the first run, all already existing events will be forwarded. Therefore, this might take a little while. On all successive service start, only new events will be forwarded.
Created 2008-01-24 by Andre Lorbach.
The general options of each product (EventReporter, MonitorWare Agent and WinSyslog) contain a setting for the “Default Timevalues”. This setting can be set to Localtime and UTC (Universal Coordinated Time) which is default.
Internally we need to calculate with UTC time. This is needed in order to maintain the time values if they are send via Syslog or SETP. If we wouldn’t do this, this could result to unexpected time differences.
We added two additional options into the property engine which can be applied on time based values for this purpose.
Property Option: localtime = converts the output of the timestamp into localtime
Sample: %variable:::localtime%
Property Option: uxLocalTimeStamp = same output as uxTimeStamp, but localtime is used
Sample: %variable:::uxLocalTimeStamp%
Article created 2008-01-17 by Andre Lorbach.
This article will guide you in how to monitor a software raid on Windows 2003 by filtering specific events by using the EventLog Monitor in MonitorWare Agent. This is also possible with EventReporter, however this article will target the more powerful MonitorWare Agent.
Raid Systems have a big advantage for failover support and prevent data loss. But what when a hard disk is failing, you don’t know it? Windows Server Systems often run for months without being monitored, and what if two hard disk fail in this time period? A nightmare for every system administrator. So we will setup a EventLog Monitor in MonitorWare Agent which alert you by email in case of a raid brakes, a hard disk fails or anything else bad happens.
1. Creating a Windows Software Raid (Skip if Raid exists!)
1.1 Convert Hard disks into dynamic disks
1.2 Adding a Mirror to the existing system partition
2. Installing and Configuring MonitorWare Agent
2.1 Download and Install MonitorWare Agent
2.2 Setup up basic MonitorWare Agent configuration
2.3 How to verify that the alert is working?
Final Thoughts
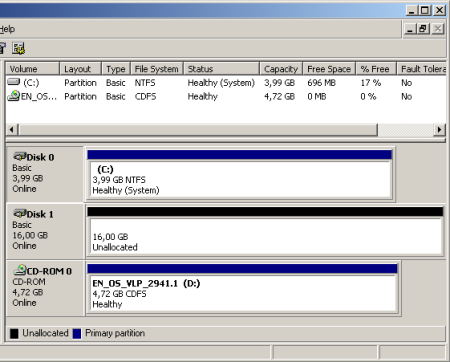 So in case you have no Software Raid configured yet, open the Computer Management und go to the Disk Management. You will see your System drive and you should have a second hard disk with enough free space available. For a sample see the screenshot. |
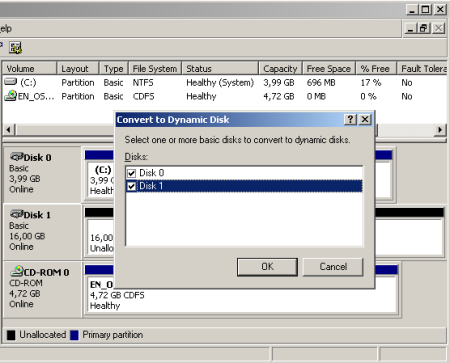 Right-Click one of the disks and click on “Convert to Dynamic Disk”. A wizard will appear, select both hard disks, the system one and the one you are going to use as raid mirror. Once you have accepted this, a couple of questions will follow which you need to accept and finally a reboot is required. This is because Windows can not convert a hard disk if the system is running on it. |
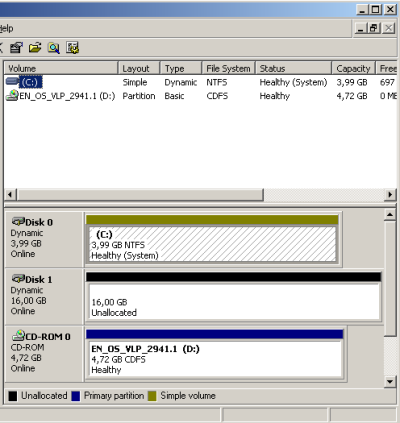 Once you have rebooted, logged in and open the Disk Management. You will notice the different partition color. This means your system partition runs on a dynamic disk now, the conversion went fine. If not review the System EventLog for possible errors. |
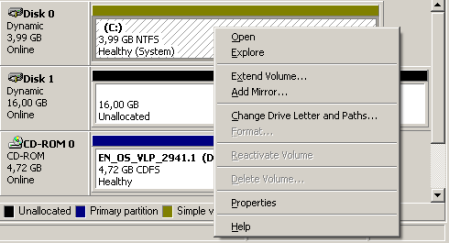 All requirements for a software raid (mirror) are now given, so kindly right click your system partition and click on “Add Mirror“. A requester will open which will ask you on which disk you want to add the mirror. In our sample, this would be disk 1. After the mirror has been added, Windows will start regenerating the mirror which means it will sync both hard disks. This may take some time depending on the size of your hard disk, maybe even hours. |
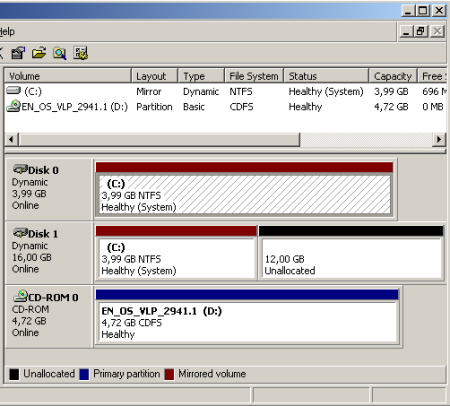 As you can see the partitions are now marked red which represents the color for mirrored partitions. After the synchronization has finished, the red partitions will be marked as healthy in the Disk Management view. |
| So if you haven’t done so already, go to www.mwagent.com and download the latest MonitorWare Agent Version. It is always recommended to use the latest Version of MonitorWare Agent. Once the Download is done, go ahead and install it. You may have to restart after installation, this depends on your System. |
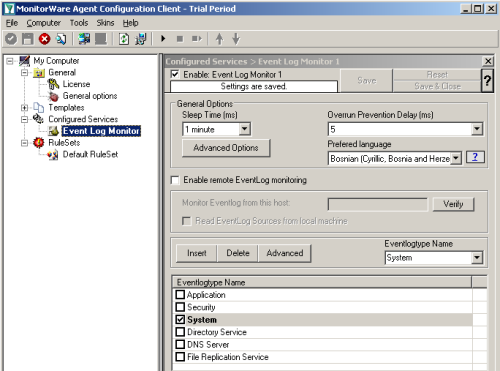 Start the MonitorWare Agent Client and skip the wizard on startup. First we create new “Event Log Monitor” Service. Uncheck all event log types except System, as this is the only event log needed to achieve our goal. If you like to monitor other Event Log Types too, you may select them. It will have no impact on our following configuration. |
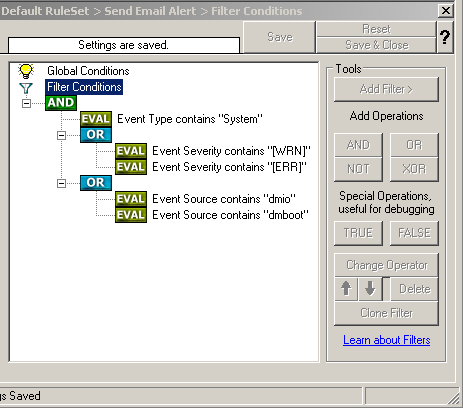 Now we can add another Rule called “Send Email Alert”. This rule will have a few filters to only allow events with warning or error severity. The Eventlogtype is System and the event sources which matter to us are dmio and dmboot. The filters should look like in this screenshot. For additional reference, here is a list of possible dmboot und dmio events: Event ID: 1, “dmio: Device %2,%3: Received spurious close”
The next step is to create a SendEmail Action and configure it like in the screenshot. Here is the Event message we suggest to use, but feel free to create and modify your own: You need to replace the mail server, sender and recipient with yourself. |
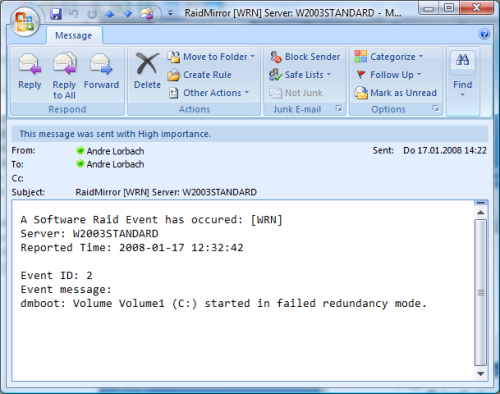 There is a simple way to test if our alerting is working, however it isn’t without risks. I only recommend you to do this step if your really want to test the alerting! I do NOT recommend to perform this test on a productive system! First of all shutdown the server and open the case. Then disconnect the second hard disk by removing the power or the data connector. Then boot the server, once windows is starting the services you should get an alert by email. It should look like the sample email in the screenshot. If the test was successful, you can shutdown your server again. Connect the power / data connector and boot your server. You may receive the same email message again, as the raid is now OUT OF SYNC. So you need to open the Disk Management and right click the disk with the exclamation mark. Then select “Reactivate Disk”, the raid will begin resynchronization immediately after this. |
I hope this article will help you solving your tasks and shows you the potential of MonitorWare Agent, and what you can archive with it. Feel free to email me for recommendations or questions.
