Parsing log messages

Parsing log messages

Created 2006-03-24 by Michael Meckelein.

This article describes how to parse log message via “Post-Process”. It illustrates the logic behind Post-Process action.

Get relevant information from logs

Log files contain a lot of information. In most cases only a small part of the log message is of actual interest. Extracting relevant information is often difficulty. Due to a variety of different log formats a generic parser covering all formats is not available.

Good examples are firewalls. Cisco PIX and Fortigate firewalls both use syslog for logging.. But the content of their respective log messages are very different. Therefore a method is needed to parse the logs in a generic way. Here Post-Process action of Adiscon’s MonitorWare comes into play.

Tool kit for parsing

Post-Process action provides an editor for creating a log format template. A template consists of as many rules as necessary to parse out the relevant information.

Determine necessary information

In order to parse out information it is vital to know the exact structure of the message. Identifying the position of each relevant item is essential. Assuming for auditing purposes the following items are needed:

Timestamp | Source IP-Address | SyslogTag | MessageID | Username | Status | Additional Information

A sample message looks like:

Mar 29 08:30:00 172.16.0.1 %Access-User: 12345: rule=monitor-user-login user=Bob status=denied msg=User does not exist

In order to extract the information let us examine each item within the message. Splitting the message makes it easier to explain. So here we go.

Pos = Position of the character.
*p  = Points to the position the parser stands after parsing the rule.
Log = Message subdivided into its characters.
Pro = Property. In the term of Adiscon a property is the name of the item which is parsed out.

Note that at beginning of the parse process the parser’s pointer points to the first character. Each parse type starts parsing at the current position of the pointer.

Parsing out a Timestamp

The first identified item is a so called Unix/Timestamp. It has always a length of 15 characters. ‘UNIX/LINUX-like Timestamp’ parse type exactly covers the requirement to parse this item. Therefore insert a rule and select ‘UNIX/LINUX-like Timestamp’ type. This rule parses out the timestamp and moves the pointer to the next character after the timestamp. Name the property ‘u-timestamp’ [1].


Post-Process Editor: Inserted a ‘UNIX/LINUX like timestamp’ rule

Get the IP-Address

Next item is the IP address. Note that after the timestamp follows a space and then the IP address. Therefore insert a ‘Character Match’ rule with a space as value. Select the ‘Filler’ [2] property for this rule. ‘Character Match’ requires a user defined value. This parse type compares the given value with the character at the current position of the message. The character has to be identical with the given value otherwise the parse process will fail. After applying this parse type the parse pointer is moved to the position immediately after the given value. In our sample this is the start position of the IP Address (Pos 17).

After that the address can be obtained. Place in a ‘IP V4 Address’ type. This type parses out a valid IP regardless of its length. No need to take care about the characters. Select ‘Source’ property or name it to whatever you prefer. The parser will automatically move the pointer to the position next to the address.


Note the value of ‘Character Match’ rule is a space.

Obtain the syslogtag

Behind the IP it is a blank followed by a percent sign. The percent indicates that the syslogtag is following. To move the pointer to the syslogtag position once again a ‘Character Match’ rule is necessary. It has to match the space (actual position of the pointer) and the percent sign. This content is not needed therefore assign it to the ‘Filler’ property.

A colon is immediately behind the syslogtag. So all characters between the percent sign and the colon are needed. The ‘UpTo’ type can do this job. Insert an ‘UpTo’ rule. As value enter ‘:’ (without the quotes) and select the syslogtag property. Note that after parsing the pointer stands on the first character of the ‘UpTo’ value.


Important: It points to the colon not to the blank.

Take the MessageID

The next interesting item is the MessageID. Move the pointer to start position of the MessageID part. Again, do this by using a ‘Character Match’ rule. Keep in mind that the pointer points to the colon. Behind the colon is a space and then the MessageID starts. Thus, the value of the rule has to be ‘: ‘.

MessageID consist of numbers only. For numeric parsing the ‘Integer’ parse type exist. This type captures all characters until a non-numeric character appears. The pointer is moved behind the number. Note that numeric values with decimal dots can not be parsed with this type (because they are not integers). This means trying to parse 1.1 results in 1, because the dot is a non-numeric value.

Find the username and status

Looking at the remainder of the message indicates that the username is not immediately after syslogtag. Thankfully though, the username always starts with ‘user=’. Consequently the ‘UpTo’ type can be used to identify the username. To get the start position of the username we have to use ‘UpTo’ together with ‘Character Match’. Remember that ‘UpTo’ points to the first character of the given value. For this reason the ‘Character Match’ rule is necessary.

After locating the start position of the username ‘Word’ parse type can be used. ‘Word’ parses as long as a space sign is found. Enter ‘u-username’ as property.


Notice: After parsing a word the pointer stands on the space behind the parsed word.

The steps to get the status are very similar to the previous one.

The last rule – Additional Information

One item of interest is left. The last part of the message contains additional information. It starts after ‘msg=’. So the combination of ‘UpTo’ and ‘Character Match’ is used to go to the right position. All characters after ‘msg=’ until the end of the message are interesting. For this purpose the ‘Rest of Message’ parse type is available. It stores all characters from the current position until the end of the message. This also means that this rule can only be used once in a template and is always the last rule.


Complete parse template.

What happens if the parser fails?

If a rule does not match processing stops at this point. This means all properties of rules which were processed successfully until the non-matching rule occurs are available.

Let’s assume the fourth rule of the following sample does not match.

The first three rules were processed successfully. Therefore u-timestamp and Source are available. But syslogtag and u-messageid are always empty due to the parser never process this rules.

The Post-Process template which was created in this article is available for download. If you have further question on Post-Process, please contact our support.

[1] Using the “u-” prefix is recommended to differentiate between MonitorWare-defined properties and user defined one. It is not required, but often of great aid. A common trap is that future versions of MonitorWare may use property names that a user has also used. MonitorWare will never use any name starting with “u-“, so the prefix also guards against such a scenario.

[2] Filler is a predefined property which acts as a bin for unwanted characters. Essentially, the data is simply discarded.

Please Note: There’s also a StepByStep Guide available which describes how the PostProcessAction works, you can find it here.

IIS Workflow Described

IIS Workflow Described

By Rainer Gerhards
Article Date: 2003-03-20

Abstract

This paper describes the IIS workflow (aka “order of operations”) as far as the author thinks it is. I have tried hard to make the information as complete and accurate as possible, but obviously it might be wrong as I haven’t coded IIS. All information in this paper is taken from official Microsoft documenation as well as working with IIS in lab.

This paper will become part of a larger IIS-logging focussed paper. In fact, I excerpted it from a later release, because I see increasing intereste in IIS workflow caused by some new malware on the web. So this paper is not fully proof-read and there will most probably be some typos, gramatical errors as well as inconsistencies. Especially if you spot an inconsistency, I would appreicate if you let me know at rgerhards@adiscon.com because I obviously would like to have it as easily understandable as possible.

The above mentioned IIS logging paper can be found at http://www.monitorware.com/common/en/SecurityReference/monitoring-iis-logs.pdf

Additional information and papers may also be available at http://www.monitorware.com/common/en/SecurityReference/.

Please note that this document is correct for IIS up to version 5.1. Microsoft has announced considerable change for IIS 6.0, and the information in this document might not be valid for that version.

IIS order of Operations

Conceptually, IIS has three processing stages:

  1. Decoding the target (web page) of the request
  2. Serving the request
  3. Finishing the request, which includes logging

Before we dig into the details, be sure to fully understand the implications of that overall order of processing: no data is logged by IIS before the request is finished. The reason for this is that IIS log files contain data like the total number bytes send or the processing time required. This data is only available when the request is finished. This also means that when an attacker either crashes IIS or exploits a vulnerability that does not allow it to reach step 3, no log data is written. As a side note, the same is true for Apache.

The problem of missing log data from web servers failing in stages one or two can only be addressed by writing two log lines – one at the begin of the request and one at the end. This is currently not supported by IIS (nor other web servers I know of). Adiscon is developing a tool that allows to do this. Please email info@adiscon.com if you are interested in this and would like to receive a copy as soon as it is available.

Now let us dig into the details of the IIS order of operations. A word of warning first: We have compiled this information from what is published in the Microsoft IIS SDK as well as our own testing. We made any attempt to do do it correctly. However, there is a slight chance that we are failing in one regard or another, so please be careful when basing your work on the information contained in here. Depending on what you try to do, it can be a good idea to re-confirm the information in question with somebody at Microsoft.

First of all, it is important to remember that http request come in via TCP. TCP is a stream-oriented protocol, not a packet-oriented one. This means that any TCP application (like IIS) needs to expect that multiple reads of the TCP stream can be necessary to read a piece of information – even if it is a small one. A practical sample: the URL of the requested page is contained in the very first bytes of the HTTP header. So typically, this information is readily available when IIS receives the first TCP packet and begins processing of it. However, it is possible that someone manually connects to IIS via telnet to port 80. As he then types the HTTP header on the keyboard, each character will be delivered in its own packet. As such, the initial packet will just hold one character and not the complete URL that is typically in there. We need to keep this in mind when talking about the IIS order of operations. Some of the stages described here will typically only be involved once, but there might be situations where multiple executions of these stages code base might be necessary. This is more an implementors issue, but it can be a challenge to log analysis and securing IIS as vulnerabilites, too might be caused by implementors not appropriately handling such situations (this especially applies to ISAPI filters, which require a deep understanding of what IIS does).

Stage 1: Decoding the Request

This initial phase is used to read the HTTP headers and identify the page (or script) to be called by the web server. This phase also involves authentication for non-anonymous access.

IIS reads the TCP stream until sufficiently information has been gathered. “Sufficiently” means at least the actual request type (line one of the HTTP header) as well as the host headers and such. I did not find a clear indication of what “sufficient” is. In my point of view, I think it is the complete HTTP header, but I can not prove this to be 100% exact.

Please note that when “NT Challenge / Response” authentication is used. IIS will even initiate the challenge / response process with the client. This involves sending the challenge and receiving the response, two network packets, as part of the initial phase.

As soon as IIS has read enough of the request, it begins to process the headers. At this point, the unprocessed headers are already in a memory buffer.

Though not documented by Microsoft, I think the first thing done is to extract the HTTP host header, which is then used to obtain configuration information from IIS’ metabase. The host header is vitally important, as all processing and analysis – even the further decoding – is depending on the virtual host being requested. The information from the host header will be used to obtain configuration information during all stages of IIS processing, not just decoding. If there is no (valid) host header, then the default web site is used. If there is no default web site and also no web site configured specifically for those requests without a (valid) host header, the request is simply discarded at this stage. Please note that this also means no log entry will be written as this is done in stage 3.

Then, the final URL is decoded. Depending on the ISAPI filters installed, this can be a length process. In its most basic form, the URL decoder looks into the supplied HTTP host header first and obtains the path mapping from the IIS metabase. Please note that not only the configured home directory plays a role in this calculation but also configured virtual directories, if any. Lastly, ISAPI filters have the ability to change the URL decoding in any way they like. As multiple ISAPI filters are loaded, multiple interim decodes may happen. In any case, at the end of this process the URL is fully decoded and pointing to an actual file system path of a file to execute (or deliver, in case of a static page).

Then, authentication is performed. The result of this operation is the user context into which the request should be served. That context is later on used for all permission checks. Please note that in IIS, other than in Apache, every request is executed in the security ycontext of a specific windows user account. This also applies to anonymous requests. In MMC, you can configure the account used for anonymous requests. By default, this is called IUSR_<Machinename>. There may be other default users, depending on the exact techonology and version used (for example, ASP.NET defines another anonymous user account).

Once the user is know, IIS checks the NTFS ACLs (if any) of the previously decoded actual file to be executed. If the authenticated user does not have proper privileges, IIS denies access to it. Please note that it looks like IIS does this check by itself. It is not relying on the operating system to check if the authenticated user has proper permissions. A possible way to do so would have been to impersonate as the authenticated user and try to access the file. However, IIS at this stage is not yet impersonated as the authenticated user. As such, this mode to check the file permissions seems not to be doable. On the bottom line this means that if there is a bug in IIS’ permission checking, the operating system itself is out of luck and can not detect that. Former vulnerabilities (especially the Unicode Path Mapping yulnerability) prove this observation and also show the damage potential this way of processing has.

As written above, authentication can be quite complex, especially if Microsoft proprietary methods are used. If the user can not properly be authenticated, a “Request denied” page is served back to the requestor. In this case, the request is simply not served, which means stage 2 below is not executed. However, stage three will be used in this case and as such logging of invalidly authenticated requests will happen.

Please note the fine difference: if the authentication fails, IIS continues to work and just does not execute the request. If, however, an vulnerability is exploited during this stage, IIS will probably not continue normally and the request will most probably never be logged.

Once this is done, IIS immediately seems to begin reading further incoming data (for example in a post stream). It looks like this is asynchronous to actual request execution (but I have not verified this).

Stage 2: Serving the Request

Serving the request is easy once the incoming parameters are set.

IIS is a multithreaded application. It has a pool of so-called worker threads. One of these threads is assigned the incoming web request for processing. If all worker threads are currently serving incoming (unfinished) requests, IIS typically just creates a new worker thread to serve the new request. In other cases, IIS does not create a new worker thread but suspends processing of the incoming request until a new worker thread is available. Which method IIS chooses is depending by the IIS configuration, machine utilization and machine resources (and maybe some other factors I don’t know about). I am also not sure if the worker thread is assigned beginning in stage 2 or right at the start of the processing sequence, at the start of stage 1 above. In any case, the actual processing will be carried out in the worker thread, and this is important for our description.

Before actually serving the request, IIS checks what kind of processing it must do. There are three potential cases:

  • Static files
  • Script files
  • Executable files

Static files are served by IIS itself. No other software is involved in serving static files. However, ISAPI filters are still involved while static files are being served, so there is a potential for failure here as well as in core IIS. I deem the potential in core IIS to be very minimalistic. Please note that no external process is started when serving static files.

Script and executable files are processed in more or less the same way, thus I describe them together. An executable file is a file that is executable by itself, like an (CGI) exe file. A script file needs the help of a script processor. Examples of the later are ASP or PHP scripts – and also perl.

A new process needs to be created for all files where the script processor is not available as an in-memory ISAPI DLL (ASP and ASP.NET ar such DLLs). Typical examples for non.resident script processors are PHP and perl. In their case, an external process needs to be created. From IIS’ point of view, it does not really make a difference if the new process is created for a script processor or for a “real” executable. A script processor is just an executable that needs to be passed in some parameters in a specific way.

To create a new process, IIS first creates a new process space. This is still done in the security context of IIS itself, most often the SYSTEM account. Then, IIS loads the image file to be executed into that still-empty process stage. Again, this is done by IIS itself. Consequently, file system audit events 560 of source “Security” in the Windows Security Event Log do show the account IIS is running under as the process initiator. This can be misleading when doing analysis of the event logs. When the image is loaded then IIS impersonates into the context of the authenticated user and changes the new processes access token to be that of the authenticated user. If you are analysing this in the Windows Security Event log, there should be a event id 600, source “Security” that holds this information. IIS then runs the newly created process.

The new process communicates via defined interfaces (e.g. CGI) with IIS and the web client. Depending on the actual interface used, IIS asynchronously reads and writes web client data.

There is at least one difference between scripts and “plain” executables: for scripts, there is a timeout in the IIS configuration. If scripts don’t finish within a configured amount of time, they are aborted (at least ASP scripts, not sure for all potential scripting processors). “Real” executables, do not have any runtime restriction. In lab, we have run ISAPI DLLs (a form of executable) for more than one day in a single IIS thread. IIS did neither abort that executable nor log any error or warning message.

This behaviour can be used in an attack: An attacker exploits a vulnerability that allows him to inject code into one of the worker threads. This code will do malicious things and run in a tight loop (much as SQL Slammer [5]did). As such, it will never finish, thus the worker thread will also never finish. What does this mean? Well, we are stuck at stage two and will never reach stage 3, so no logging will happen.

When the executable (or script processor) is done with the request, it terminates and control returns to the calling worker thread. Please note the process termination will be logged in the correct user context in Windows Security Event log. The event id logged is 593 from source “Security”.

Stage 3: Finishing the Request

Once the request has been served, IIS does some cleanup work. Part of that cleanup work is logging. Now IIS has available all information that it potentially needs to write to the log file. Things like the return status of the process executed, the number of bytes sent or the total execution time. It is for this reason that IIS does not log data at any further stage.

Please note that ISAPI filters can modify IIS’ logging behaviour. If requested by a filter, IIS will call the filter right before the log entry is written. The filter can then decide to modify or even drop the log data.

When the filter returns, IIS finally writes the line to the log entry. This also implies that sequence of events in the log file is based on the time they are finished, not initiated. An example: if request A starts at 9:15:01 and ends at 9:15:05 and request B starts at 9:15:02 and ends at 9:15:03, the sequence in the log file will be B first, then A. The reason for this is that A finished after B and the log file sequence is based on the time the request finished. This fact is worth noting, as the actual processing sequence can not accurately be guessed from web server logs when doing forensic analysis. This most probably applies to all web server logs, not just IIS logs.

Copyright

This document is copyrighted © 2003 by Adiscon GmbH and Rainer Gerhards. Anybody is free to distribute it without paying a fee as long as it is distributed unaltered and there is only a reasonable fee charged for it (e.g. a copying fee for a printout handed out). Please note that “unaltered” means as either the PDF file you (hopefully) acquired or a printout of the same on paper. Any other use requires previous written authorization by Adiscon GmbH and Rainer Gerhards.

If you place the document on a web site or otherwise distribute it to a broader audience, I would appreciate if you let me know. This serves two needs: Number one is I am able to notify you when there is an update available (that is no promise!) and number two is I am a creature of curiosity and simply interested in where the paper pops up.

Credits

Many thanks to Tina Bird of www.loganalysis.org, which had the idea to this paper and provided numerous feedback and tough questions. Without that, it wouldn’t exist at all.

Authors Address

Rainer Gerhards
rgerhards@adiscon.com

Adiscon GmbH
Mozartstrasse 21
97950 Grossrinderfeld
Germany

Disclaimer

The information within this paper may change without notice. Use of this information constitutes acceptance for use in an AS IS condition. There are NO warranties with regard to this information. In no event shall the authors be liable for any damages whatsoever arising out of or in connection with the use or spread of this information. Any use of this information is at the user’s own risk.

Other Formats

This paper is also available in PDF format for easy printing and offline reading.

How to process Syslog messages from Solaris 8/9 systems?

How to process Syslog messages from Solaris 8/9 systems?

Created 2006-03-15 by Andre Lorbach.

This article describes how to workaround problems which occur when you are receiving and processing Syslog messages from Solaris 8/9 systems.

  • The Problem: The problem exists in the way, the Syslog messages are formatted from Solaris 8/9. As an example, we take the following sample Syslog message:
<38>Aug  2 11:49:23 su: [ID 366847 auth.info] ‘su root’ succeeded for root on /dev/console

This message is missing the source, which has to be before the Syslogtag, as it is defined in RFC3164. So correctly, the Syslog would have to look like this:

<38>Aug  2 11:49:23 mymaschine su: [ID 366847 auth.info] ‘su root’ succeeded for root on /dev/console

In the first message, our Syslog Server treats the SyslogTag value as Source, and doesn’t continue to parse the SyslogTag Value. This will result in an empty SyslogTag, and wrong parsed source. The problem is that our Syslog Server does not expect such a message, and so it can’t be handled directly.

  • The Workaround: The best way to workaround this problem is to disable RFC3164 Parsing in the Syslog Server, and implement your own preprocessing of the Syslog message with the help of the Postprocess Action. The following steps explain and show how this can be done.

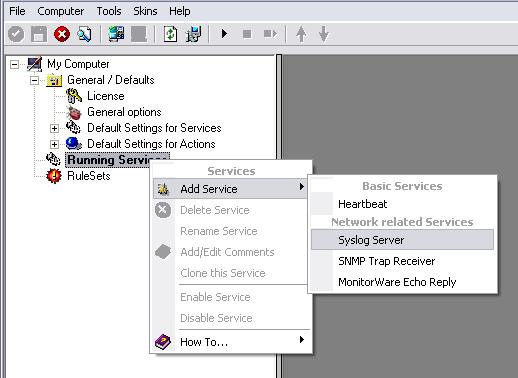
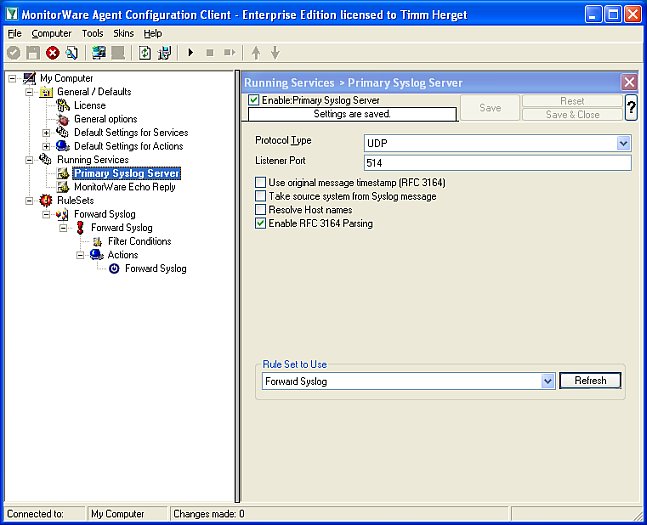
1. Reconfigure your Syslog Server configuration and disable the following options:

  • Use original message timestamp (RFC 3164)
  • Take source system from Syslog message
  • Enable RFC 3164 Parsing

2. Create a PostProcess Action for preprocessing the Solaris Syslog messages:

First create a new Rule in your Main RuleSet and move it on top of all Rules. This is important as these actions will do the job of the “Enable RFC 3164 parsing” option of the Syslog Server. In this Rule, create a new PostProcess Action with the following template definition like in screenshot below. You can download the predefined PostProcess template from here. Use the Import Template button to load the predefined PostProcess template into your configuration.

The SyslogTag will now be correctly set by the PostProcess Actions, and the source is taken from the network connection from where the Syslog message is received. Please note that only “wrong” formatted messages will now be correctly parsed. So if you have other Syslog devices, you should let them send their logs to another Syslog Server where normal processing is used.

Can Event Reporter work with custom event logs / evt-files?

Can Event Reporter work with custom event logs / evt-files?

Created 2006-02-15 by Timm Herget

There are 2 FAQ Articles available regarding this question because it is different if you want to monitor custom event logs or custom *.evt files. Please see the links below for further information about this:

How To setup a Failover Syslog Server

How To setup a Failover Syslog Server

Article created 2006-02-01 by Timm Herget.

You want to have an alternative syslog server for forwarding your e.g. PIX-syslog-messages, which automatically detects if the primary server is alive or not and if not he takes it’s roll until he is back? Here we go:

At first please make sure, that you have installed 2 MonitorWareAgent’s on 2 different machines and have configured the device which forwards syslog to them so, that it sends its data to both of them. Rainer Gerhards also wrote an Article about this, which you can read here.

Pre-Note: Make sure you press the “Save” button after every step – otherwise your changes will not be applied!

Configuring the Primary Server

Step 1:

Create a ruleset on the primary server (machine 1), which contains a “Forward Syslog” action and has no filter conditions configured. Type in the central-server-name to which the logs should be forwarded and leave all other settings default:


Figure1: creating the ruleset

Step 2:

Now create the primary syslog server service for which you have made the ruleset in step1 and bind it to the ruleset:


Figure2: creating the syslog server service Step 3:

At last we must create a “MonitorWare Echo Reply” service on the primary server, we will explain later for what:


Figure3: creating the monitorware echo reply

Configuring the Secondary Server

Step 1:

Create a ruleset on the secondary server (machine 2), with 1 rule named “Echo Request Successful”. Create a “Set Status” Action in it, set the property name to “ServerActive” and the property value to “1” (without the quotes). We need this to clarify later if the primary-server is active or not and if it is, we set the variable serveractive to 1 which means true.


Figure1: creating the first rule

Step 2:

Now set a message contains filter inside this first rule’s filter conditions. Check the Message to contain: “MWEchoRequest success target“:


Figure2: filter conditions for first rule

Step 3:

We have to create the second rule into the above created echo-request-ruleset now. Again we need to configure a “Set Status” Action and set the property name to “ServerActive” and the property value to “0” now, for the case that the primary server is no longer active:


Figure3: creating the second rule

Step 4:

Again we have to set the filter settings for this case: Check the Message to contain: “MWEchoRequest fail target“:


Figure4: filter conditions for second rule

Step 5:

Now we must create the “MonitorWare Echo Request” service for which we have configured the rule set with its two rules above. Set the check interval to 5 seconds, check “Also generate an event if echo reply was successful” and press “Insert” button to insert a new machine to be requested. In “IP / Hostname” field, type in the ip/hostname of the primary server and let the port default “10001”, assign the service to the “Echo Request Rule” ruleset we created for it:


Figure5: configuring the MonitorWare echo request service

Step 6:

Now let us create a new Rule Set, not a 3rd rule in the ruleset we created for the echo request! Create a forward syslog action in it, type in the name of your CENTRAL-SERVER where the logs should be sent to after this is finished (not the primary server) and leave all other settings default:


Figure6: create rule forward-syslog

Step 7:

Check the filter conditions for the forward syslog ruleset now. Create a “Status Name and Value” filter by right-clicking on the AND, then “Add Filter” -> “General” -> “Status Name and Value”:


Figure7: creating the filters. part 1

Step 8:

Now we have to configure the newly created “Status Name and Value” filter by setting the property name to our global status variable we named “ServerActive”, the compare operation to “is equal” and the property value to “0” (for the case that the primary server is NOT active, because only then this server should do its job):


Figure8: creating the filters. part 2

Step 9:

Create the secondary syslog server service now, let all settings at default values and just assign it to the “Forward Syslog” ruleset:


Figure9: creating the secondary syslog server

Step 10:

The last thing we have to do is to start both MWAgent’s, the one on machine 1 (primary server) and the one on machine 2 (secondary server):


Figure10: start the 2 MWAgent’s

Downloads:

Here are sample configs for the primary and secondary server in *.reg file’s:

Building a redundant Syslog Server

Building a redundant Syslog Server

Article created 2006-02-01 by Rainer Gerhards.

For many organizations, syslog data is of vital importance. Some may even be required by law or other regulations to make sure that no log data is lost. The question is now, how can this be accomplished?

Let’s first look at the easy part: once the data has been received by the syslog server and stored to files (or a database), you can use “just the normal tools” to ensure that you have a good backup of them. This is pretty straight-forward technology. If you need to archive the data unaltered, you will probably write it to a write-once media like CD or DVD and archive that. If you need to keep your archive for a long time, you will probably make sure that the media persists sufficiently long enough. If in doubt, I recommend copying the data to some new media every now and then (e.g. every five years). Of course, it is always a good idea to keep vital data at least two different locations and on two different media sets. But again, all of this is pretty easy manageable.

We get down to a somewhat slippery ground when it comes to short term failure. Your backup will not protect you from a hard disk failure. OK, we can use RAID 5 (or any other fault-tolerance level) to guard against that. You can eventually even write an audit trail (comes for free with database written data, but needs to be configured and needs resources).

But what about a server failure? By the nature of syslog, any data that is not received is probably lost. Especially with UDP based (standard) syslog, the sender does not even know the receiver has died. Even with TCP based syslog many senders prefer to drop messages than to stall processing (the only other option left – think about it).

There are several ways to guard against such failures. The common denominator is that they all have some pros and cons and none is absolutely trouble-free. So plan ahead.

A very straightforward option is to have two separate syslog servers and make every device send messages to both of them. It is quite unlikely that both of the servers will go down at the same instant. Of course, you should make sure they are connected via separate network links, different switches and use differently fused power connections. If your organization is large, placing them at physically different places (different buildings) can also be beneficial, if the network bandwidth allows. This configuration is probably the safest to use. It can even guard you against the notorious UDP packet losses that standard syslog is prone to (and which happen unnoticed for most of the time). The backdraw of this configuration is that you have almost all messages at both locations. Only if a server fails (or a message is discarded by the network), you only have a single copy. So if you combine both event repositories to a central one, you will have lots of duplicates. The art of handling this is to find a good merge process, which correctly (correctly is a key word!) identifies duplicate lines and drops them. Identifying duplicates can be much harder than it initially sounds, but in most cases there is a good solution. Sometimes a bit sender tweaking is required, but after all, that’s what makes an admin happy…

The next solution is to use some clustering technology. For example, you can use the Windows cluster service to define two machines which act as a virtual single syslog server. The OS (Windows in this sample case) itself keeps track of which machine is up and which one is not. For syslog, an active-passive clustering schema is probably best, that is one where one machine is always in hot standby (aka: not used ;)). This machine only takes processing over when the primary one (the one usually active) fails. The OS handles the task of virtualizing the IP address and the storage system. It also controls the takeover of control from one syslog server software to the next. So this is very little hassle from the application point of view. Senders also send messages only once, resulting in half the network traffic. You also do not have to think about how to consolidate messages into a single repository. Of course, this luxury comes at a price: most importantly, you will not be guarded against dropped UDP packets (because there is only one receiver at one time). Probably more importantly, every “failover” logic has a little delay. So there will be a few seconds (up to maybe a  minute or two) until the syslog server functionality has been carried over to the hot standby machine. During this period, messages will be lost. Finally, clustering is typically relatively expensive and hard to set up.

The third possible solution is to look at the syslog server application itself. My company offers WinSyslog and MonitorWare Agent which can be configured to work in a failover-like configuration. There, the syslog server detects failures and transfers control, just like in the clustering scenario. However, the operating system does not handle the failover itself and obviously the OS so does not need to be any special. This approach offers basically the same pros and cons as the OS clustering approach described above. However, it is somewhat less expensive and probably easier to configure. If the two syslog server machines need not to be dedicated, it can be greatly less expensive than clustering – because no additional hardware for the backup machine would be required. One drawback, however, is that the senders again need to be configured to send messages to both machine, thus doubling the network traffic compared to “real” clustering. However, syslog traffic bandwidth usage is typically no problem, so that should not be too much of a disadvantage.

Question now: how does it work? It’s quite easy! First of all, all senders are configured to send to both receivers simultaneously. The solution then depends on the receiver’s ability to see if its peer is still operational. If so, you define one active and one passive peer. The passive peer checks if the other one is alive (in short periods). If the passive detects that the primary one fails, it enabled message recording. Once it detects that the primary is up again, it disables message recording. With this approach, both syslog servers receive the message, but only one actually records them. The message files can than be merged for a nearly complete picture. Why nearly? Well, as with OS clustering, there is a time frame where the backup does not yet take over control, thus some messages may be lost. Furthermore, when the primary node comes up again, there is another small Window where both of the machines record messages, thus resulting in duplicates (this later problem is not seen with typical OS clustering). So this is not a perfect world, but pretty close to it – depending on your needs. If you are interested in how this is actually done, you can follow our step-by-step instructions for our product line. Similar methodologies might apply to other products, but for obvious reasons I have not researched that. Have a look yourself after you are inspired by the Adiscon sample.

What is the conclusion? There is no perfect way to handling syslog server failure. Probably the best solution is to run two syslog servers in parallel, the first solution I described. But depending on your needs, one of the others might be a better choice for what you try to accomplish. I have given pros and cons with each of them, hopefully this will help you judge what works best for you.

How To setup a Failover Syslog Server

How To setup a Failover Syslog Server

Article created 2006-02-01 by Timm Herget.

You want to have an alternative syslog server for forwarding your e.g. PIX-syslog-messages, which automatically detects if the primary server is alive or not and if not he takes it’s roll until he is back? Here we go:

At first please make sure, that you have installed 2 MonitorWareAgent’s on 2 different machines and have configured the device which forwards syslog to them so, that it sends its data to both of them. Rainer Gerhards also wrote an Article about this, which you can read here.

Pre-Note: Make sure you press the “Save” button after every step – otherwise your changes will not be applied!

Configuring the Primary Server

Step 1:

Create a ruleset on the primary server (machine 1), which contains a “Forward Syslog” action and has no filter conditions configured. Type in the central-server-name to which the logs should be forwarded and leave all other settings default:


Figure1: creating the ruleset

Step 2:

Now create the primary syslog server service for which you have made the ruleset in step1 and bind it to the ruleset:


Figure2: creating the syslog server service Step 3:

At last we must create a “MonitorWare Echo Reply” service on the primary server, we will explain later for what:


Figure3: creating the monitorware echo reply

Configuring the Secondary Server

Step 1:

Create a ruleset on the secondary server (machine 2), with 1 rule named “Echo Request Successful”. Create a “Set Status” Action in it, set the property name to “ServerActive” and the property value to “1” (without the quotes). We need this to clarify later if the primary-server is active or not and if it is, we set the variable serveractive to 1 which means true.


Figure1: creating the first rule

Step 2:

Now set a message contains filter inside this first rule’s filter conditions. Check the Message to contain: “MWEchoRequest success target“:


Figure2: filter conditions for first rule

Step 3:

We have to create the second rule into the above created echo-request-ruleset now. Again we need to configure a “Set Status” Action and set the property name to “ServerActive” and the property value to “0” now, for the case that the primary server is no longer active:


Figure3: creating the second rule

Step 4:

Again we have to set the filter settings for this case: Check the Message to contain: “MWEchoRequest fail target“:


Figure4: filter conditions for second rule

Step 5:

Now we must create the “MonitorWare Echo Request” service for which we have configured the rule set with its two rules above. Set the check interval to 5 seconds, check “Also generate an event if echo reply was successful” and press “Insert” button to insert a new machine to be requested. In “IP / Hostname” field, type in the ip/hostname of the primary server and let the port default “10001”, assign the service to the “Echo Request Rule” ruleset we created for it:


Figure5: configuring the MonitorWare echo request service

Step 6:

Now let us create a new Rule Set, not a 3rd rule in the ruleset we created for the echo request! Create a forward syslog action in it, type in the name of your CENTRAL-SERVER where the logs should be sent to after this is finished (not the primary server) and leave all other settings default:


Figure6: create rule forward-syslog

Step 7:

Check the filter conditions for the forward syslog ruleset now. Create a “Status Name and Value” filter by right-clicking on the AND, then “Add Filter” -> “General” -> “Status Name and Value”:


Figure7: creating the filters. part 1

Step 8:

Now we have to configure the newly created “Status Name and Value” filter by setting the property name to our global status variable we named “ServerActive”, the compare operation to “is equal” and the property value to “0” (for the case that the primary server is NOT active, because only then this server should do its job):


Figure8: creating the filters. part 2

Step 9:

Create the secondary syslog server service now, let all settings at default values and just assign it to the “Forward Syslog” ruleset:


Figure9: creating the secondary syslog server

Step 10:

The last thing we have to do is to start both MWAgent’s, the one on machine 1 (primary server) and the one on machine 2 (secondary server):


Figure10: start the 2 MWAgent’s

Downloads:

Here are sample configs for the primary and secondary server in *.reg file’s:

2006-01-14 MonitorWare Agent x64 Edition Rolling Beta released

MonitorWare Agent x64 Edition Rolling Beta released

Adiscon today announced the first x64 based Version of MonitorWare Agent Rolling Beta. This is an important step forward in the development of MonitorWare Agent. We can now benefit from the new possibilities the x64 platform gives us. Continue reading “2006-01-14 MonitorWare Agent x64 Edition Rolling Beta released”

Why does the Client remain at the older version after “successfully” upgrading to newer version?

Why does the Client remain at the older version after “successfully” upgrading to newer version?

Created 2005-11-09 by Timm Herget

Do you experience a problem similar to the following?
– After the upgrade, the client reported to have updated the service to 7.x but the client was still version 6.x.
Then you are right here.

This is cause the old setups where made with an installshield version, which was bugged at this time. To solve this problem try the following:

  • Try a repair-installation, and if this still not works:
  • Delete the whole Client and *.xml files from the installation folder and use the REPAIR function of the setup again.