How To setup Windows centralized Monitoring
Article created 2006-02-13 by Timm Herget
Article updated 2006-06-19 by Timm Herget.
Please Note: This article is valid for EventReporter 8.x and lower, WinSyslog 7.x and lower and MonitorWare Agent 4.x and lower in addition to MonitorWare Console 2.1 !
Windows NT/2000/XP/2003 systems monitoring is really important for all small to large sized environments. MonitorWare line of products helps to accomplish this important task. This article is to help you establish a small setup to monitor your Windows NT/2000/XP and 2003 systems.
This article is strictly task focused. It does not describe why the systems should be monitored nor does it provide any further background. Please see the respective backgrounders or each of the products documentation on this. This article is a step-by-step description of what you need to do in order to centrally monitor your Windows NT/2000/XP and 2003 systems.
Centralized Event Reports
In this step-by-step guide, we want to monitor the windows eventlog on all of our client machines (which can be done either with EventReporter or MonitorWare Agent) and then forward the logfiles to a central logserver which writes the data into a database (can be done with WinSyslog or MonitorWare Agent). After this, MonitorWare Console should read the data from this database to automatically generate event summaries for the monitored servers and other devices.
This guide focuses on a typical small to medium business topography with a single geographical location and five windows clients and a central hub server. All systems are well connected via a local ethernet. Event reports from all machines should be stored in a database. The administrator shall receive daily consolidated event reports.
What you need
In this guide, I am focusing on building a solution with Adiscon’s EventReporter, WinSyslog and MonitorWare Console. (Please note that you can use and configure MonitorWare Agent in the same way like either WinSyslog or EventReporter because it is our main product which has all the features of the other two products too. Please also see our article on which product to choose when in doubt which one is right.)
This combination allows you to centralize all your event logs and reports on them. Free 30 day trial versions are available at the respective product sites (links below), so you can try the system without the need to buy anything. You need to run the following products:
- One EventReporter (alternative: MWAgent) for each system that is to be monitored. In our scenario, this means 6 copies, one for each client and one for the central hub server, if you want to monitor the hub server as well.
- One WinSyslog (alternative: MWAgent) to receive and store event reports from the EventReporter (alternative: MWAgent) monitoring agents.
- One MonitorWare Console to automatically generate consolidated reports based on the gathered log data. MonitorWare Console is a very comprehensive tool that helps you to carry out sophisticated analysis of your system. For more information about MonitorWare Console, please refer to its manual.
Notes:
- To deliver MonitorWare Console reports, you need a local web server (for example Microsoft’s IIS or Apache) and a mail server capable of talking SMTP (most modern servers support this)
- You need administrative privileges on each of the machines. This is required both for installation and configuration. Make sure you log on with a sufficiently privileged user account.
Step 1 – Download Software
You should check the web sites for new versions if you downloaded your copies a while ago as security and monitoring is a short lived business, and new product versions can appear quickly. Please visit www.eventreporter.com/en/download, eventually www.mwagent.com/download, www.winsyslog.com/en/download and www.mwconsole.com/en/download/ to download the latest versions of EventReporter, MWAgent, WinSyslog and MonitorWare Console.
Step 2 – Installing WinSyslog/MWAgent
Identify the system; WinSyslog or MWAgent (and probably MonitorWare Console) should run on. Take a note of its IP address or host name. You’ll need this value when configuring the EventReporter clients. For our example, I assume this system has an IP address of 192.168.0.1.
Run the WinSyslog/MWAgent setup with default parameters. When setup has finished, it automatically is configured to operate as a simple Syslog server. However, it does not yet use a database as we need it to. We’ll later set it up to write data into the database.
Step 3 – Install EventReporter/MWAgent
Run the EventReporter/MWAgent setup program on all systems that should be monitored. This means you need to run it on all five clients and the central hub server (as mentioned above that it is also to be monitored).
For larger installations (with many more servers) there are ways to set it up in a simpler fashion, but in a scenario like ours, it is faster to install it on each machine manually. You can install it with the default settings. When setup has finished, the program automatically is configured to operate as a simple event reporter. However, it does not yet create the log in our database we need. So we will go ahead and change this on each of the machines or by launching it on one machine and remotely connecting to the others. It is our choice. In this sample, I use the EventReporter/MWAgent on each machine (it is easier to follow).
Step 4 – Create a RuleSet for sending via SETP
The steps to configure the EventReporter/MWAgent on each machine are as follows (repeat this on each of the 5 client machines). This step needs not to be done on the central hub server!:
1. Start EventReporter/MWAgent.
2. Select your language – in this example, I use English, so it might be a good idea to choose English even if that is not your preference. You can change it any time later, but using English makes it much easier to follow this guide here.
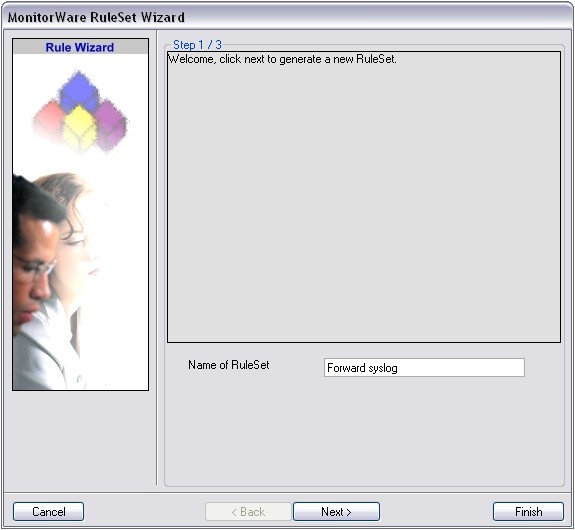
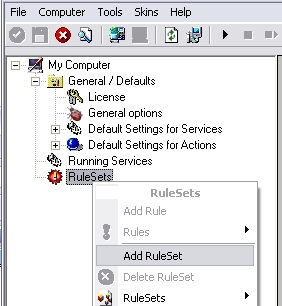
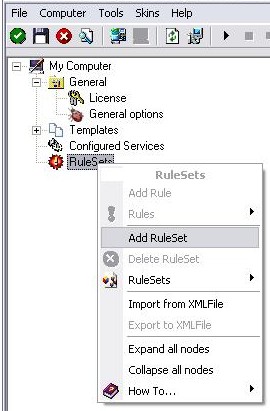
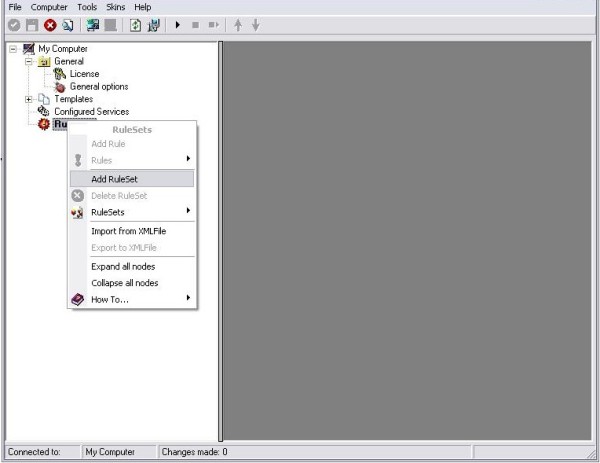
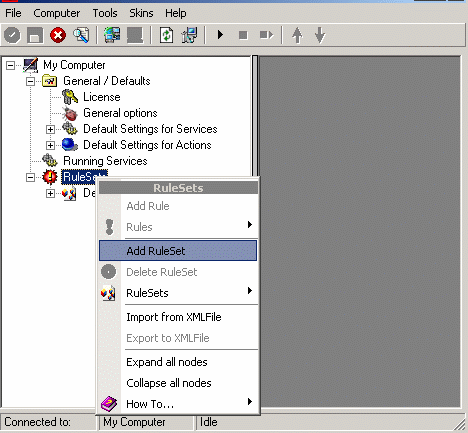
3. Then define a new rule set, right click “Rules”. A pop up menu will appear. Select “Add Rule Set” from this menu. On screen, it looks as follows:
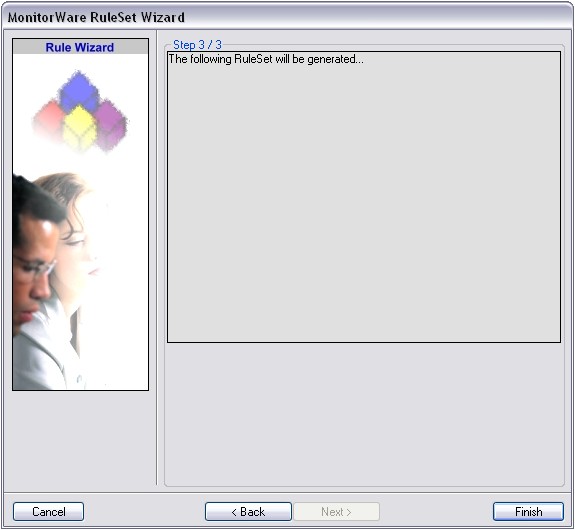
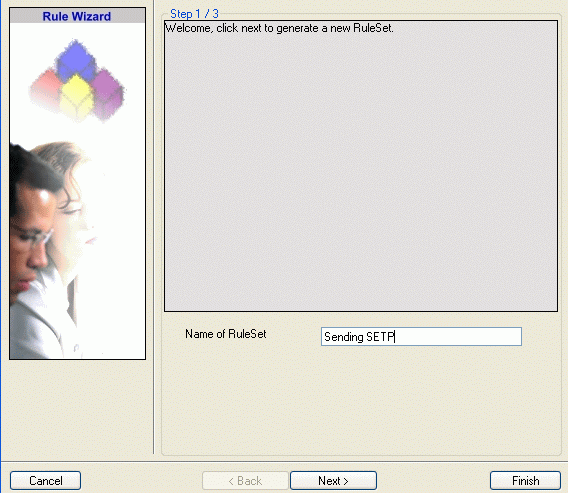
4. Then, a wizard starts. Change the name of the rule to whatever name you like. We will use “Sending SETP” in this example and click on Finish. The screen looks as follows:
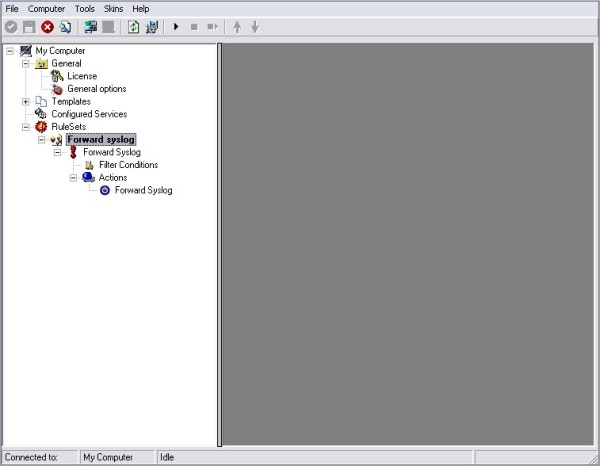
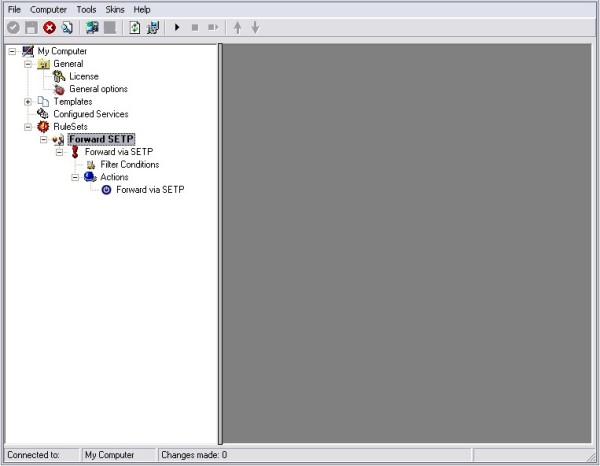
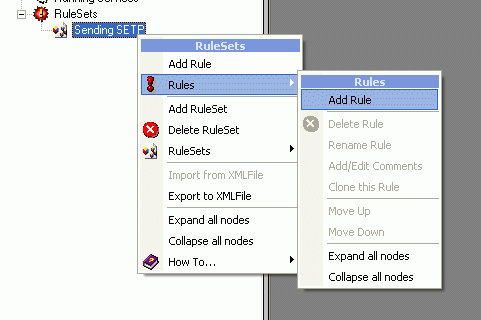
Now rightclick on the newly created RuleSet and select “Rules”, then “Add Rule” in the upcoming DropDownMenu. The Screen should look as follows:
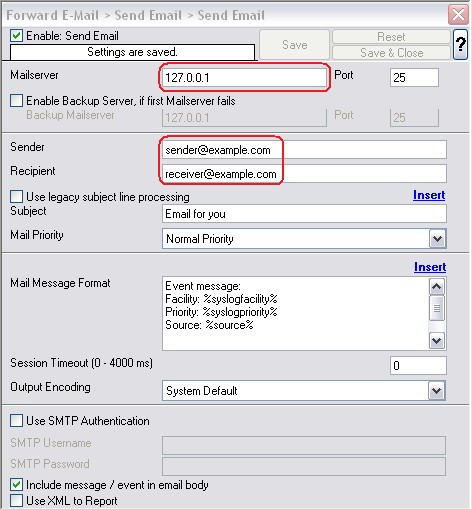
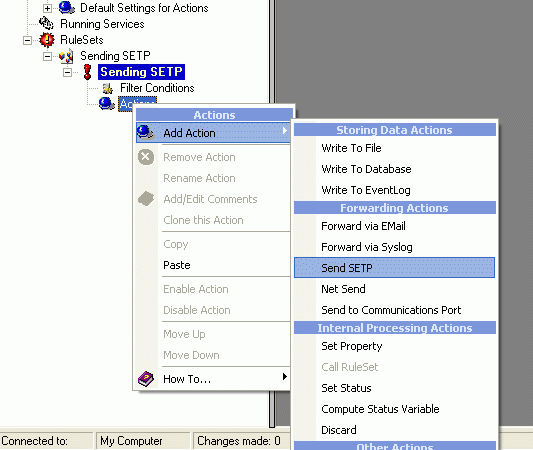
Expand the new Rule and rightclick on “Actions”, then select “Add Action” and “Send SETP”:
5. After above steps the Action Wizard will come up. Change the name of the rule to whatever name you like. In our case we will name the Action “Send SETP 1”. Click on Finish.
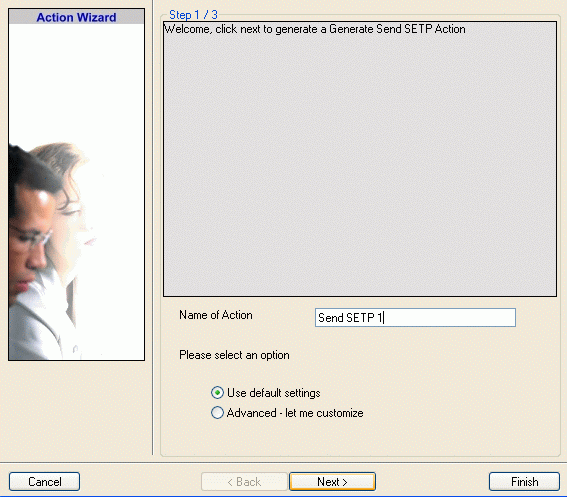
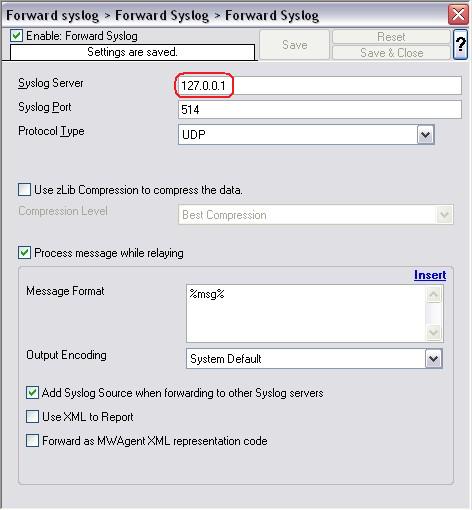
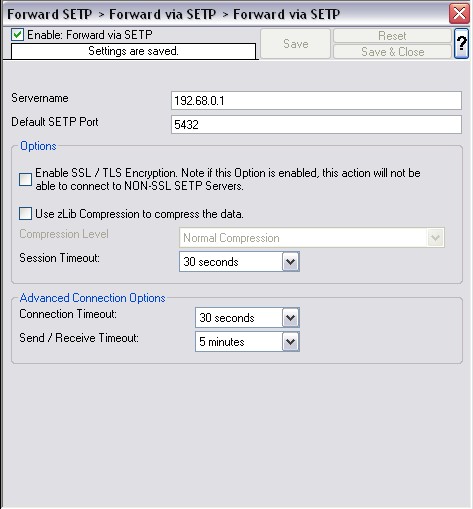
6. Now, type the IP address or host name of our central hub server in the “Servername” field of the newly created Send SETP Action configuration:
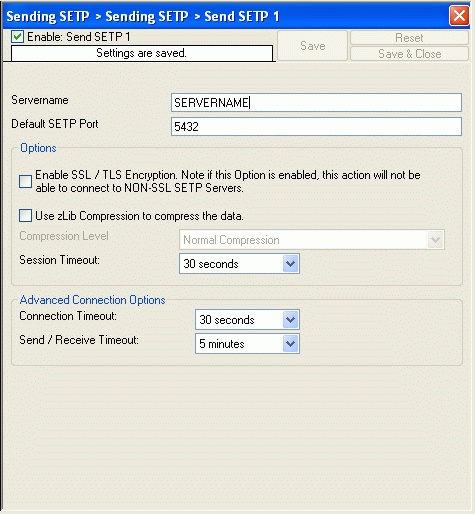
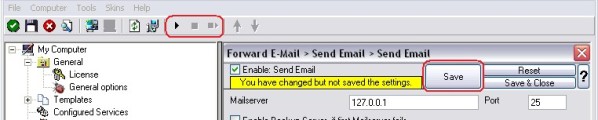
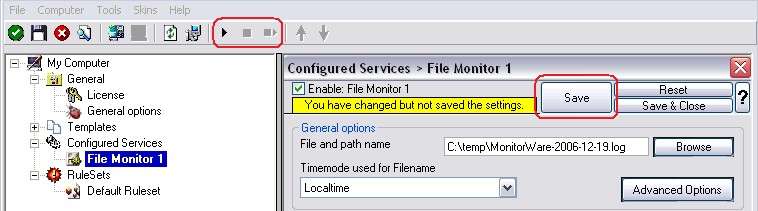
7. Make sure you press the “Save” button – otherwise your changes will not be applied.
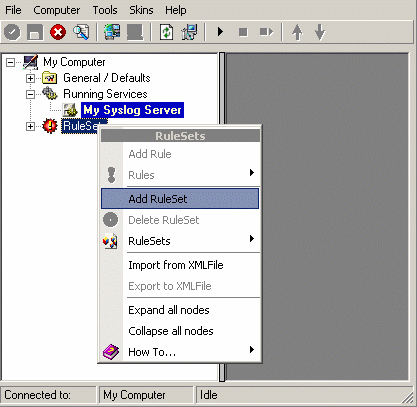
Step 5 – Create a RuleSet for database logging
This step needs only to be done on the central hub server!
1. Start WinSyslog/MWAgent
2. Again, you can select the language to use. And again, I suggest using english, as this makes the guide easier to follow.
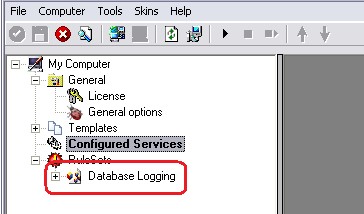
3. Then define a new rule set, right click “Rules”. A pop up menu will appear. Select “Add Rule Set” from this menu. On screen, it looks as follows:
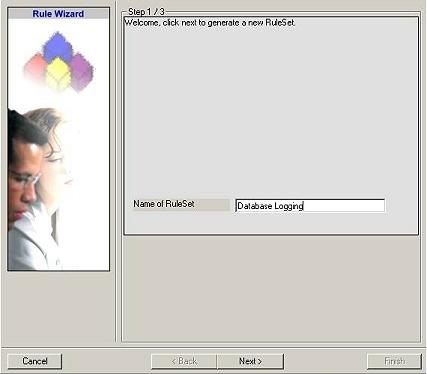
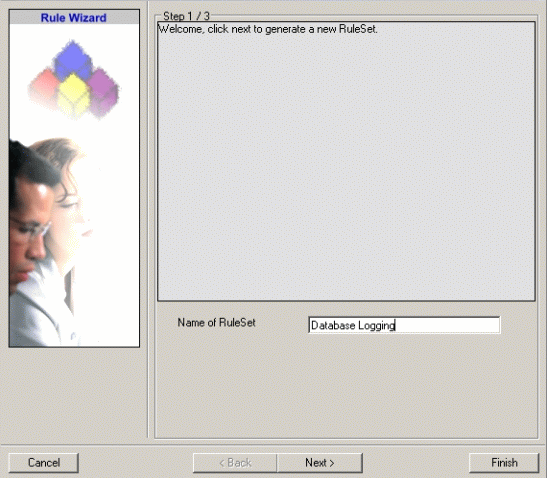
4. Then, a wizard starts. Change the name of the rule to whatever name you like. We will use “Database Logging” in this example. The screen looks as follow:
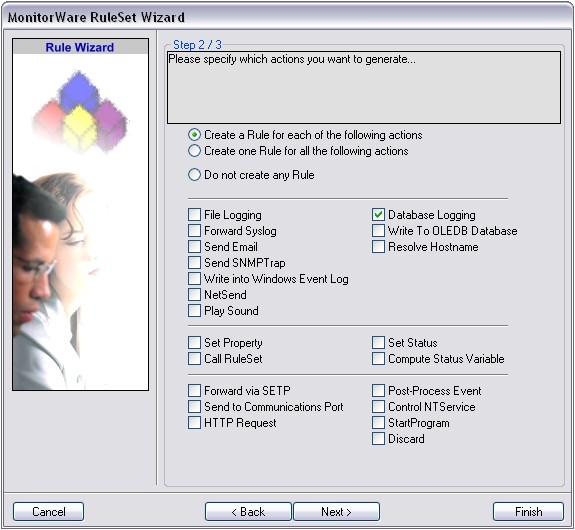
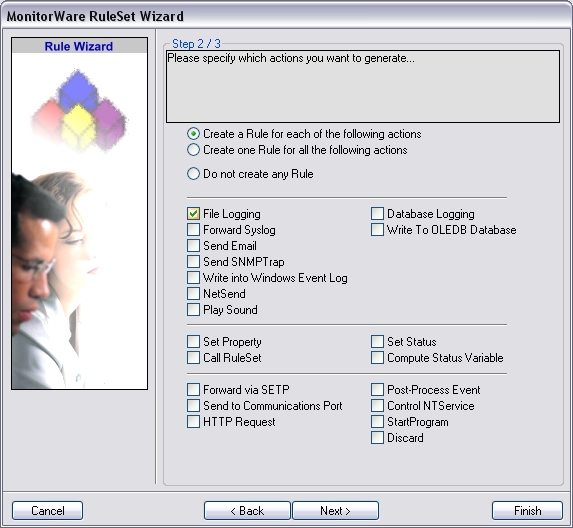
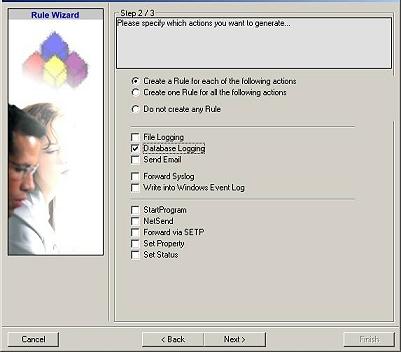
Click “Next”. A new wizard page appears as appeared in the case of EventReporter/MWAgent. Select only Database Logging here. Do not select any other options for this example. Also, leave the “Create a Rule for each of the following actions” setting selected. Click “Next”. You will see a confirmation page as showned in the case of EventReporter/MWAgent and there you have to click Finish.
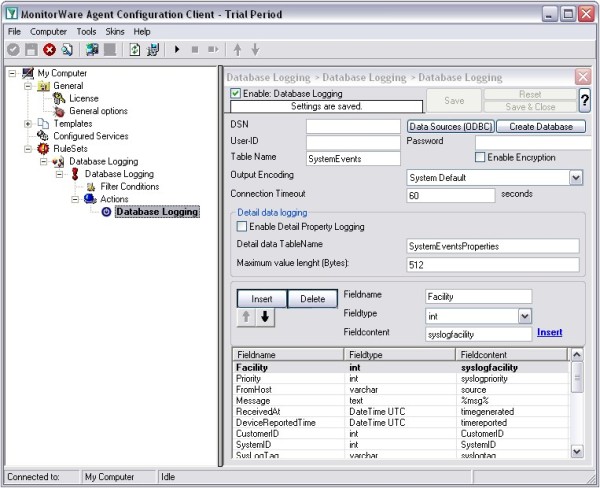
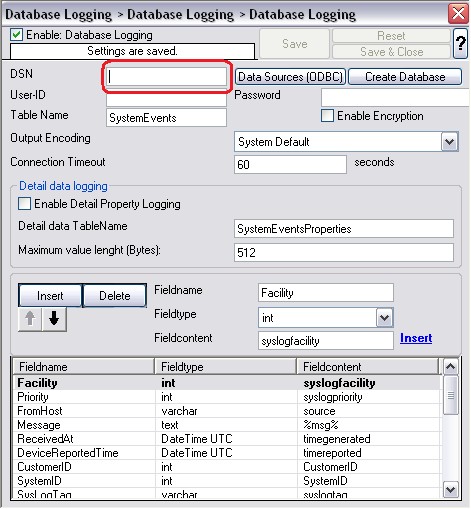
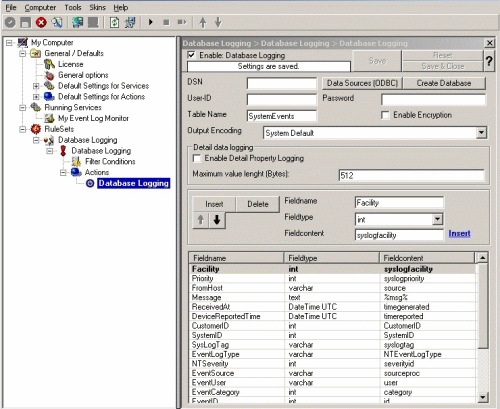
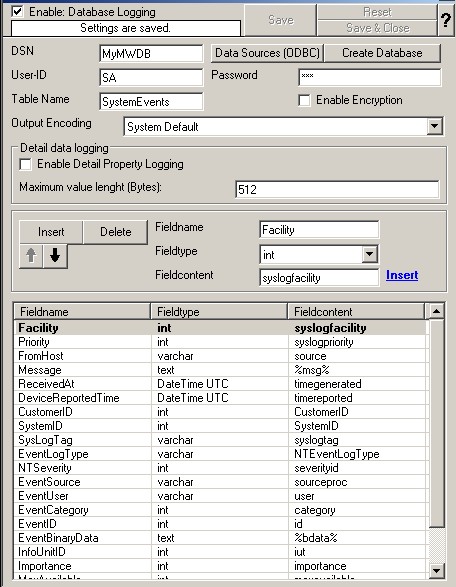
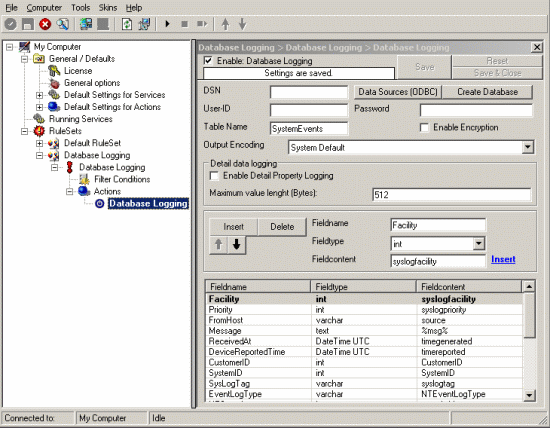
5. After above steps you will see that the new Rule Set “Database Logging” is present. Please expand it in the tree view until the action level of the “Database Logging” Rule and select the “Database Logging” action to configure.
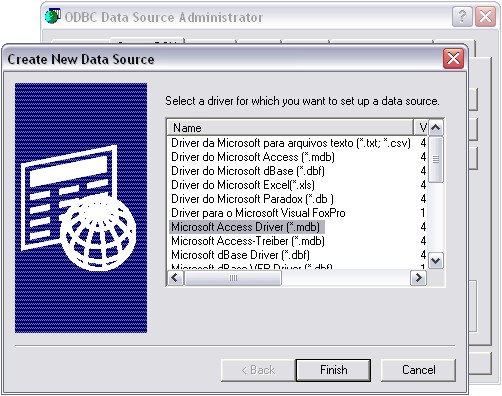
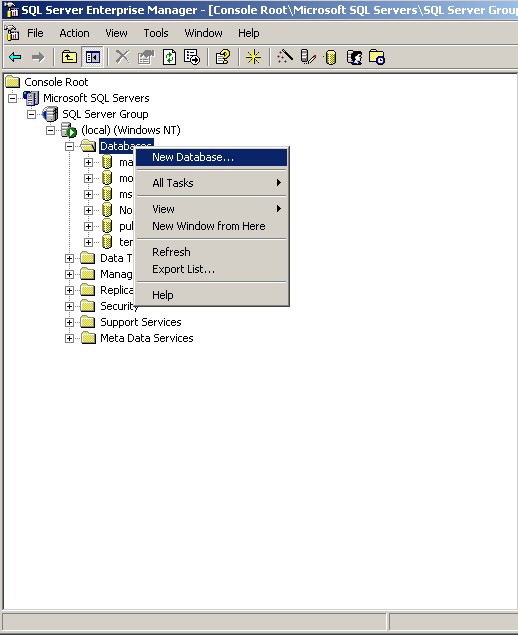
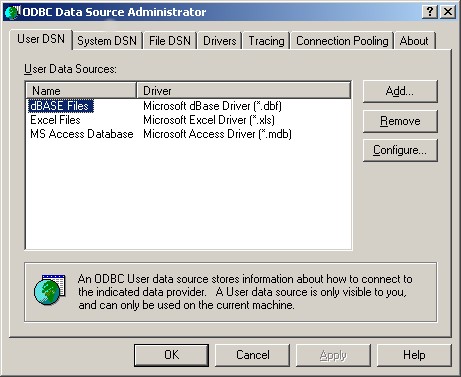
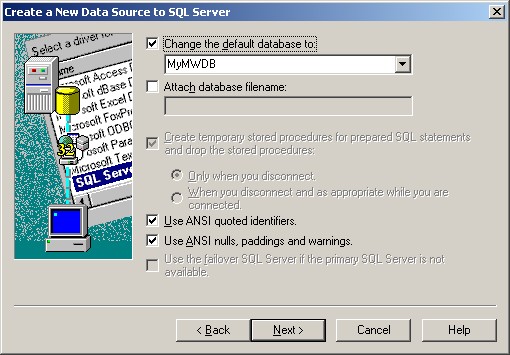
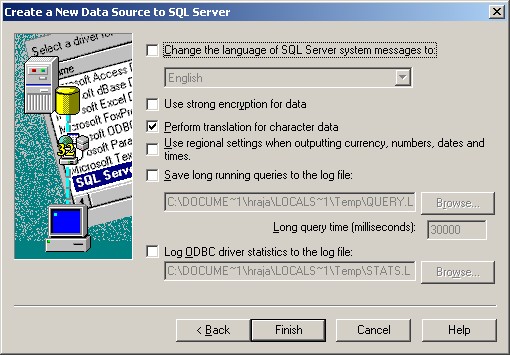
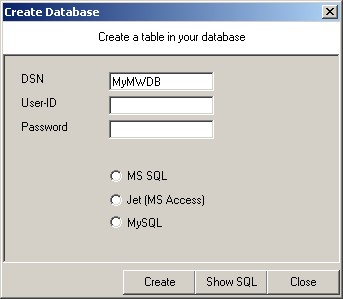
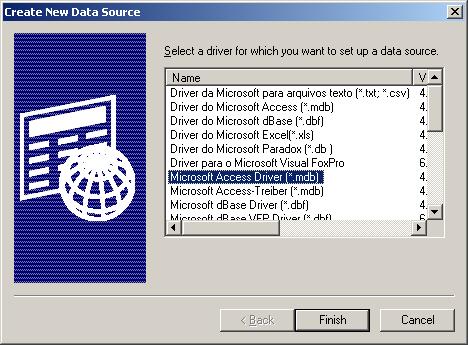
6. Now click on the Data Sources (ODBC) button to open the ODBC Data Source Administrator. Then choose the “System DSN” tab and click the “Add” button to add a new System-DSN (Select the Microsoft Access driver like in the screenshot below).
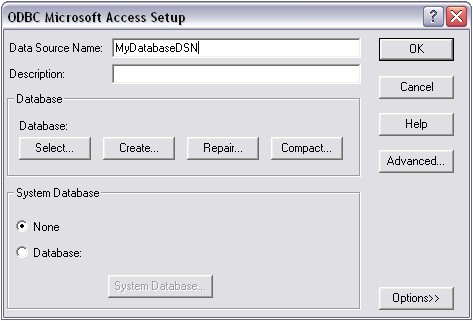
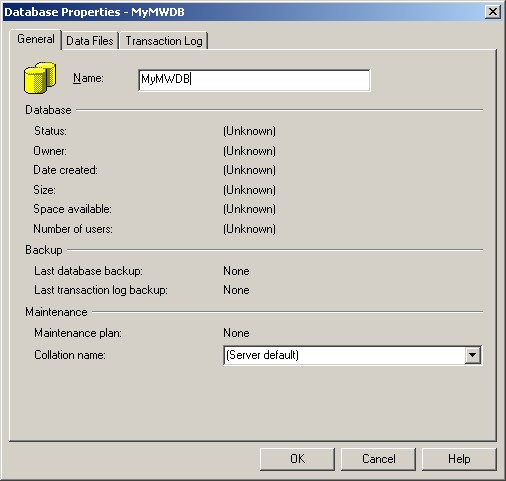
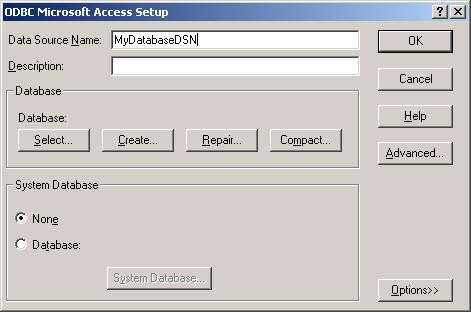
8. In the next step, click the “Select button” and go to the WinSyslog/MWAgent installation directory (Usually C:\program files\*productname*\) and choose the sample database called sample97.mdb. After that name the new DSN with “MyDatabaseDSN” like in the following screenshot and press OK.
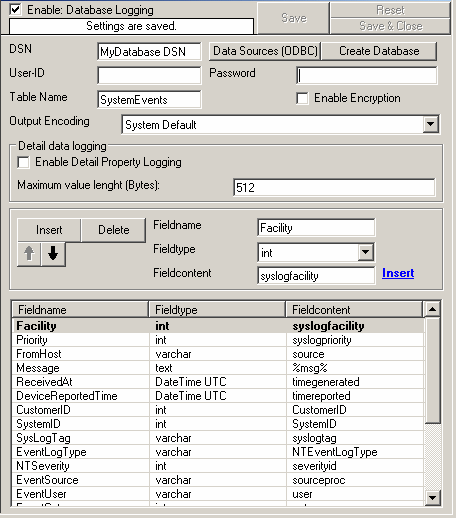
9. Now close the ODBC Data Source Administrator and switch back to the WinSyslog/MWAgent Client and insert “MyDatabaseDSN” in the DSN field. Leave all other settings in their default and save the changes.
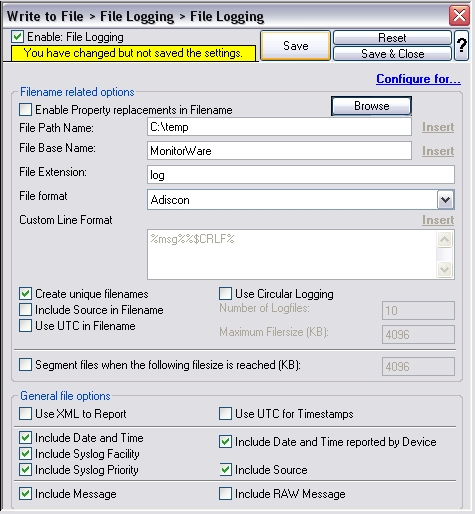
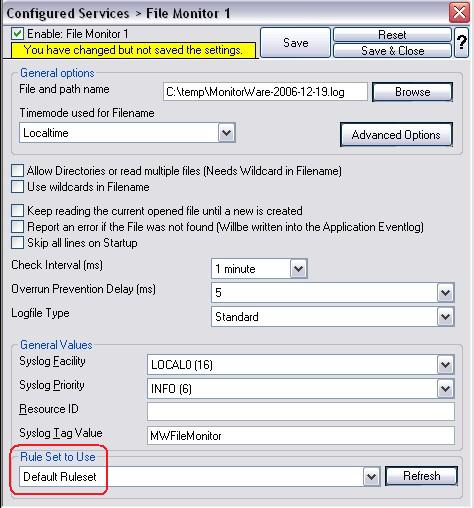
Step 6 – Create an Event Log Monitor Service
The steps to configure the EventReporter’s/MWAgent’s are as follows. Repeat this step on each of the 5 client machines and the central hub server, if you want to log events from there as well.
Also make sure that there is only one Event Log monitor at a time activated. EventReporter 7.1/MWAgent 3.1 is installed with a default Event Log monitor service. You can use that or create a new one by following these instructions:
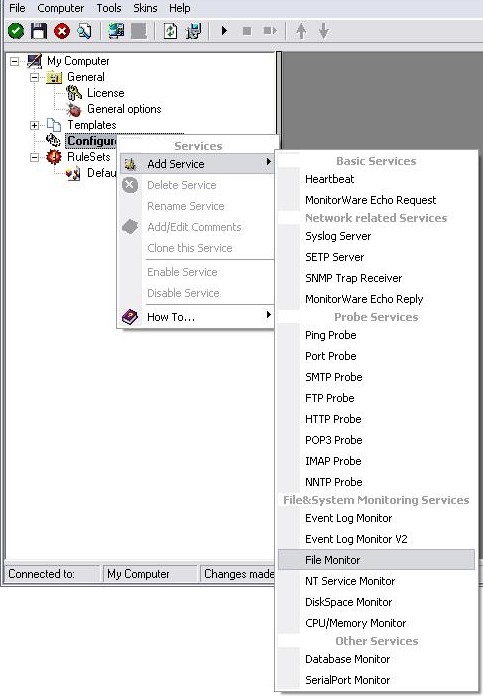
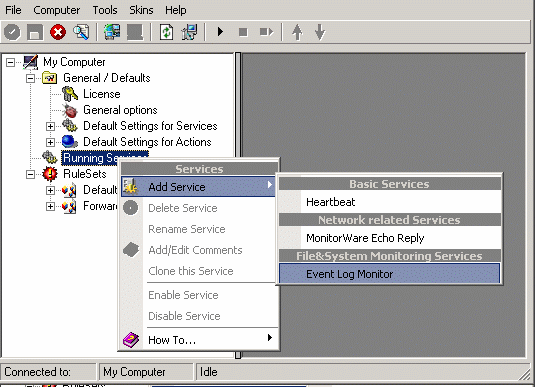
1. First, right-click on “Running Services”, then select “Add Service” and the “Event Log Monitor”.
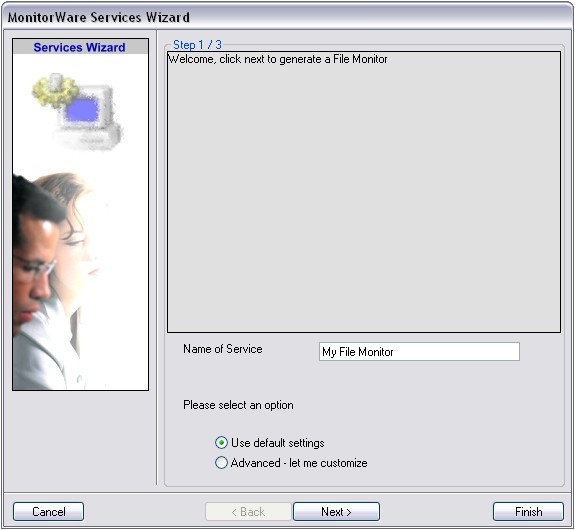
Once you have done so, a new wizard starts.
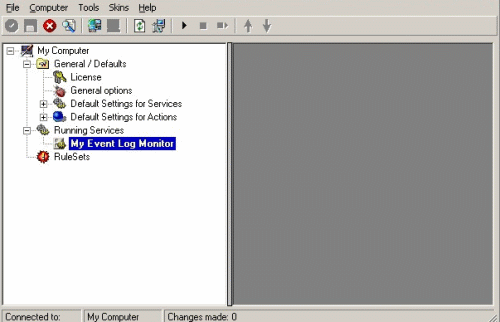
2. Again, you can use either the default name or any one you like. We will use “My Event Log Monitor” in this sample. Leave the “Use default settings” selected and press “Next”.
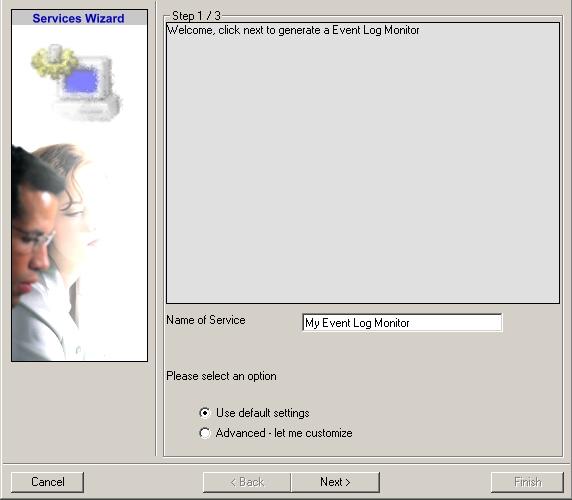
3. As we have used the default, the wizard will immediately proceed with step 3, the confirmation page. Press “Finish” to create the service. The wizard completes and returns to the configuration client.
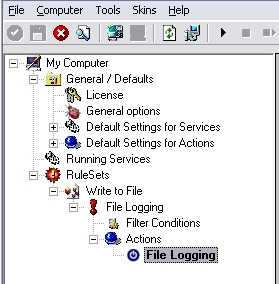
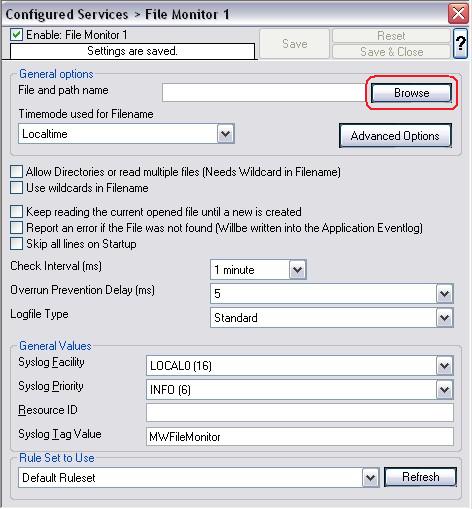
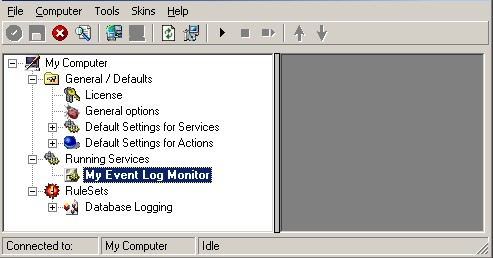
4. Now, you will see the newly created service beneath the “Services” part of the tree view. To check its parameters, select it:
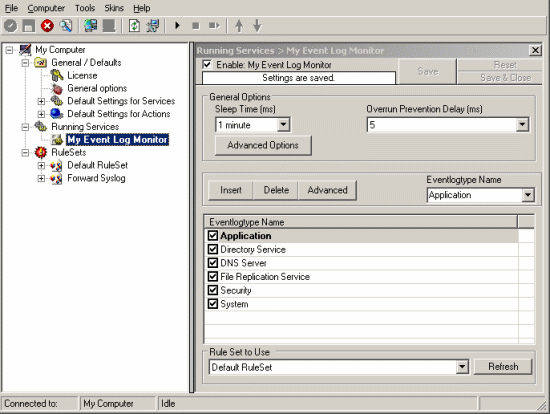
As you can see, the service has been created with the default parameters.
Please note that the “Default RuleSet” has been automatically assigned as the rule set to use. By default, the wizard will always assign the first rule set visible in the tree view to new services. In our case, this is not correct and will be corrected later.
5. Click Advanced Options button in General Options group box. You will be shown a pop up as shown below:
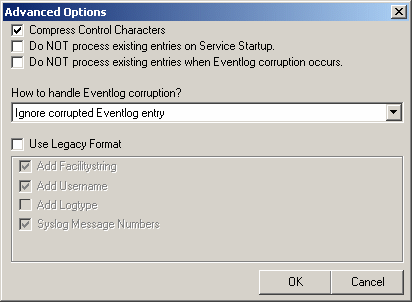
Here check Use Legacy Format and as soon as you check this box, check boxes disabled right now will be enabled and you have to uncheck; Add Username and Syslog Message Numbers.
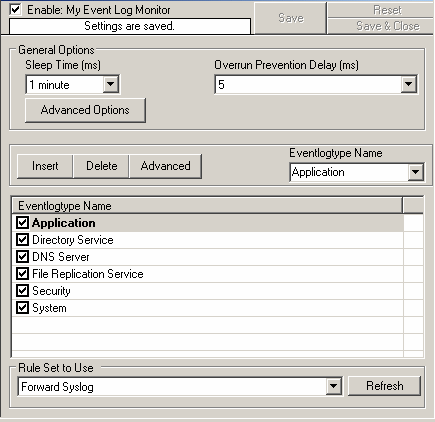
6. Now we have to make sure that the EventReporter’s/MWAgent’s use the configured “Forward Syslog” Ruleset we created in Step 3. Select that as the rule set to use.
7. Finally, save the changes and start the EventReporter/MWAgent service. This procedure completes the configuration of the event log forwarder.

EventReporter/MWAgent is not able to dynamically read changed configurations. As such, it needs to be restarted after such changes. In our sample, the service was not yet started, so we simply need to start it. If it already runs, you need to restart it.
With step 5 the client machines configuration has finished. All the next steps are only concerned with the central hub server.
Step 7 – Create a SETP Server Service
The steps to configure the central WinSyslog/MWAgent are as follows (only on central hub server!):
1. First, right click on “Services”, then select “Add Service” and the “SETP Server”.
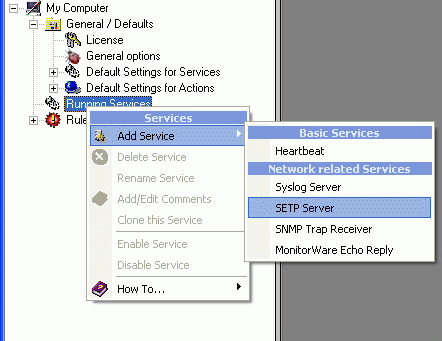
Once you have done so, a new wizard starts.
2. Again, you can use either the default name or any one you like. We will use “My SETP Server” in this sample. Leave the “Use default settings” selected and press “Next”.
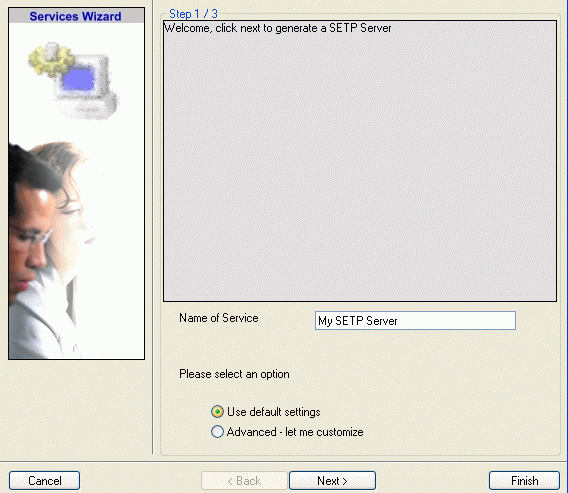
3. As we have used the default, the wizard will immediately proceed with step 3, the confirmation page. Press “Finish” to create the service. The wizard completes and returns to the configuration client.
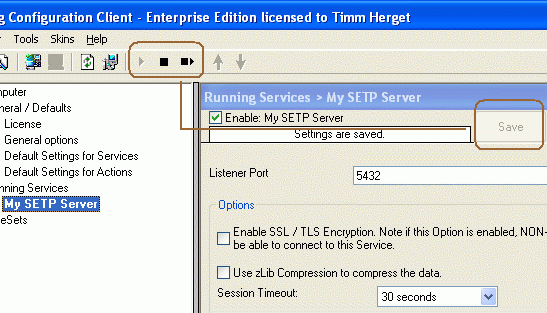
4. Now, you will see the newly created service beneath the “Services” part of the tree view. To check its parameters, select it:
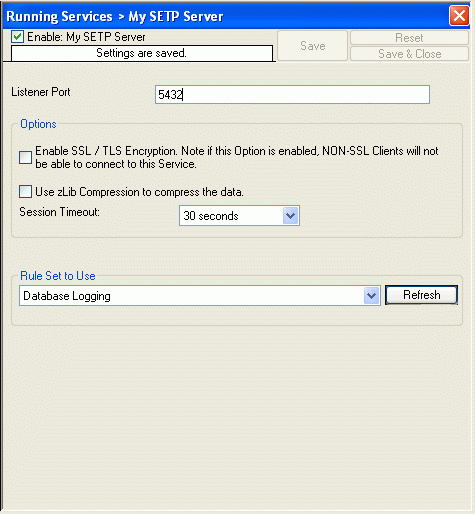
As you can see, the service has been created with the default parameters.
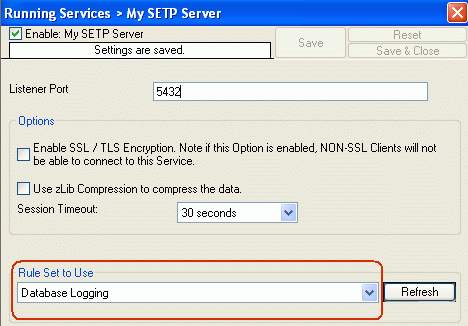
5. To use the “Database Logging” RuleSet we have created in Step 4, select it as rule set to use.
6. Last, save the change and then restart the WinSyslog/MWAgent service. This procedure completes the configuration of the SETP server.
WinSyslog/MWAgent cannot dynamically read changed configurations. As such, it needs to be restarted after such changes.
Step 8 – Preparing Web Server for MonitorWare Console
MonitorWare Console publishes its reports through the local web server (central hub server). To avoid confusion, we recommend creating a separate directory on the web server for MonitorWare Console. Let us assume that you use Microsoft Internet Information Server and run it with the default configuration. Then, your web pages are stored in the c:\inetpub\wwwroot directory. Create a subdirectory “MonitorWare Console” directly under this directory.
Step 9 – Installing and Configuring MonitorWare Console
Step 10 – Generating Reports with MonitorWare Console Manually
This section explains how the reports can be generated with MonitorWare Console manually. Since “System Status” Report is most comprehensive report that tells a detailed description about the network, in this section I will explain this report only. Please note, that the procedure for generating any report is almost the same.
Step 11 – Scheduling the Generation of Reports with MonitorWare Console
This section explains how the reports can be generated with MonitorWare Console automatically using Job Manager. With Job Manager, you can generate all the reports based on a pre-defined schedule and ask it to either store it in some location on the hard disk or send it to specified recipient via email. Once again, I will explain the scheduling of System Status Report in this section. Please note that, the procedure for scheduling any report is the same.
You are done!
Well, this is all you need to do to configure the basic operations. Once you are comfortable with the basic setup, you can enhance the system with local pre-filtering of event, enhanced logging and alerting (with MonitorWare Agent) and changing report options (with MonitorWare Console).
I hope this article is helpful. If you have any questions or remarks, please do not hesitate to contact me at therget@hq.adiscon.com.