How To setup PIX centralized Monitoring

How To setup PIX centralized Monitoring

Article created 2005-05-17 by Hamid Ali Raja
Last Updated 2006-06-19 by Timm Herget.

Adiscon Products can be used to efficiently analyze PIX traffic as well. This article is strictly task focused. It does not describe why the systems should be monitored nor does it provide any further background. Please see the respective backgrounders or product documentation on this. This article is a step-by-step description of what you need to do in order to centrally monitor your PIX Logs.

Centralized Event Reports

In this step-by-step guide, MonitorWare Agent / WinSyslog is configured to work together with Adiscon’s MonitorWare Console to generate summaries for the traffic passing to and from PIX.

What you need

In this guide, I am focusing on building a solution with Adiscon’s MonitorWare Agent / WinSyslog and MonitorWare Console. This guide will be equally good for you if you want to configure MonitorWare Console with MonitorWare Agent or to configure MonitorWare Console with WinSyslog. The reason is that in this configuration we need to have a Syslog Daemon that will be listening for Syslog messages. Since both MonitorWare Agent and WinSyslog can act as  Syslog Daemons and since the setup procedure for both of them as a Syslog Daemon is exactly the same, this guide can be used for both the cases.

This combination allows you to centralize all your logs and generate reports on them. Free 30 day trial versions are available at the respective product sites (links below), so you can try the system without the need to buy anything.

You need to run the following products:

  • 1 MonitorWare Agent / WinSyslog for the system that will act as the Syslog Daemon.
  • 1 MonitorWare Console to generate consolidated reports based on the gathered log data. This will also be installed on the same machine where you have installed MonitorWare Agent / WinSyslog
  • To deliver MonitorWare Console’s reports, you need a local web server (for example Microsoft’s IIS or Apache) and a mail server capable of talking SMTP (most modern servers support this)

You need administrative privileges on each of the machines. This is required both for installation and configuration. Make sure you log on with a sufficiently privileged user account.

Step 1 – Download Software

You need to download the following software to follow this step by step guide:

1. www.mwagent.com/download or www.winsyslog.com/en/download
2. www.mwconsole.com/en/download

Step 2 – Install MonitorWare Agent / WinSyslog

Run the MonitorWare Agent / Winsyslog setup program on the system that is to act as the central server. Take a note of this server’s IP address or host name. You’ll need this value when configuring PIX to forward the messages to it.

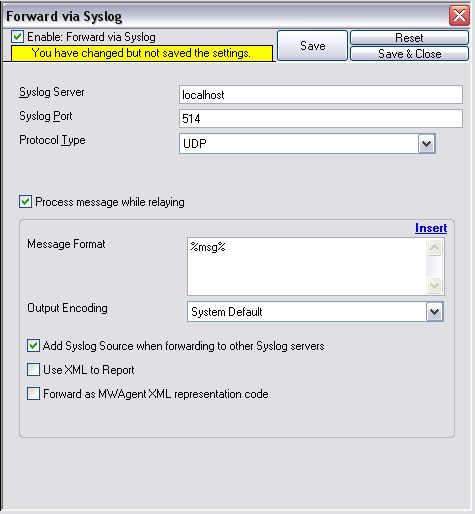
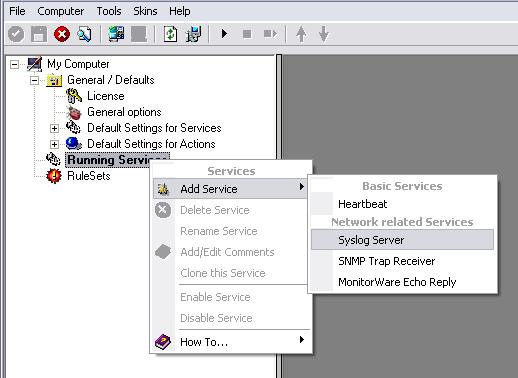
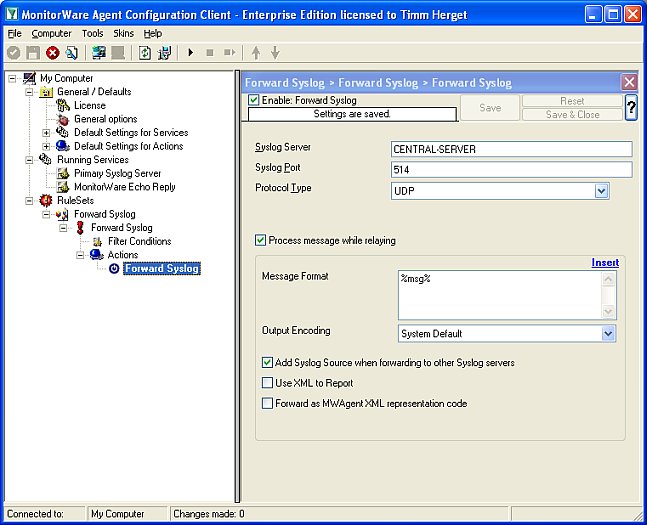
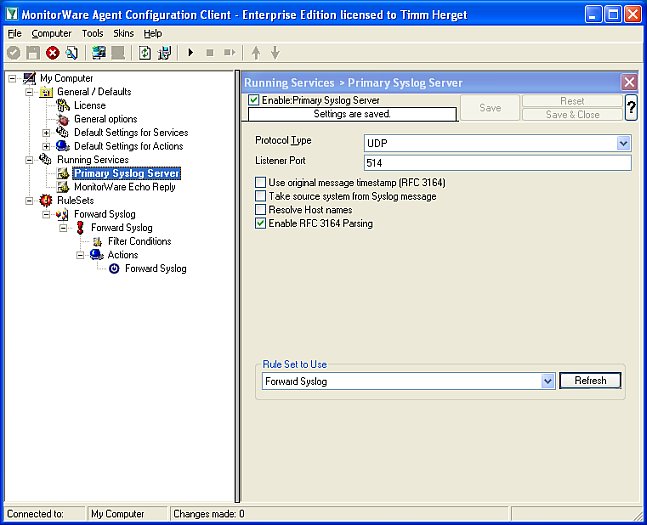
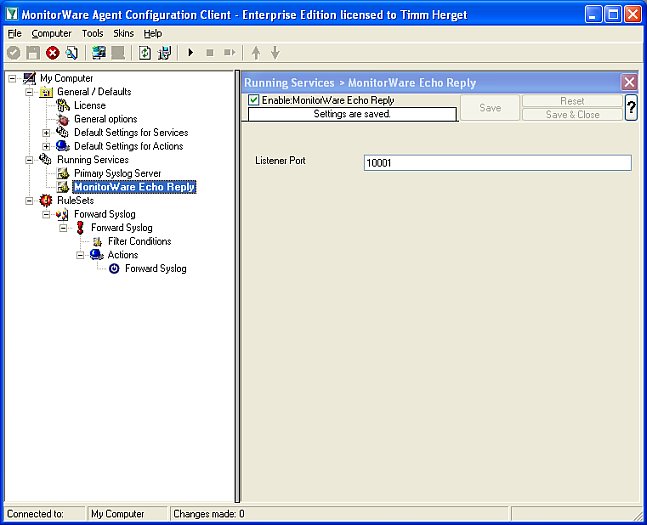
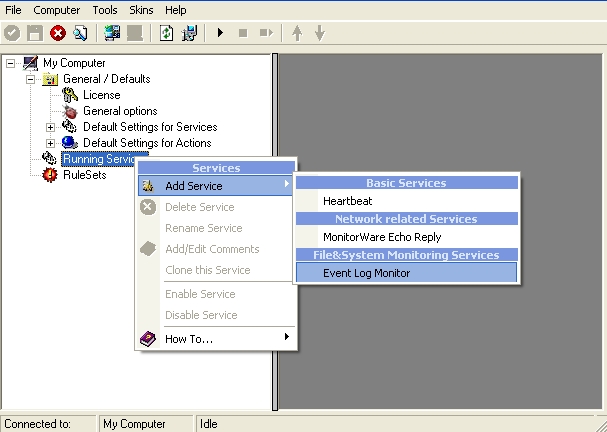
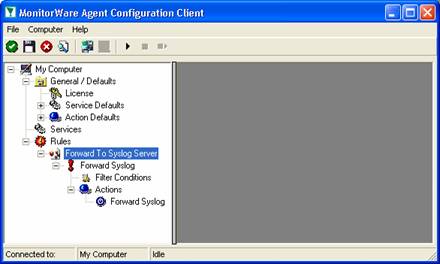
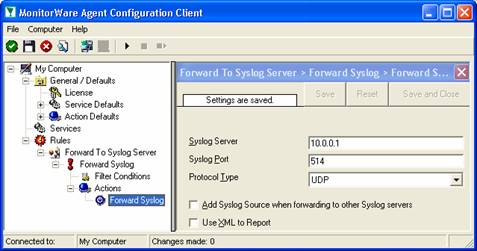
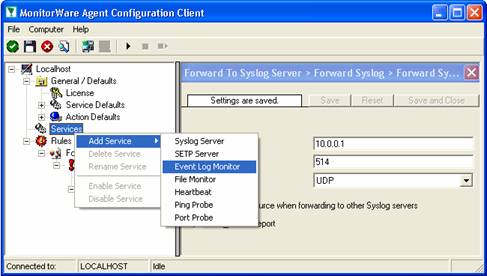
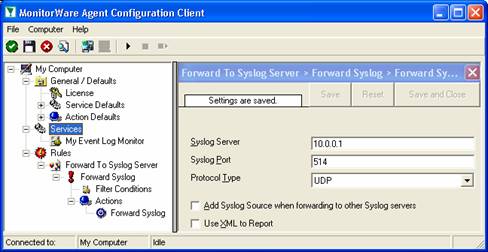
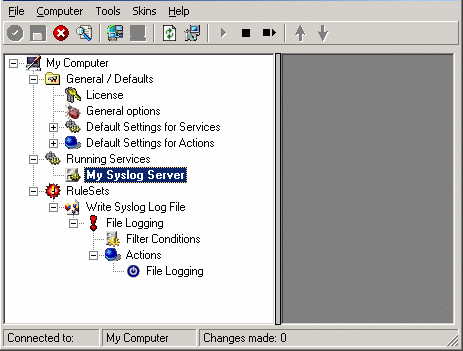
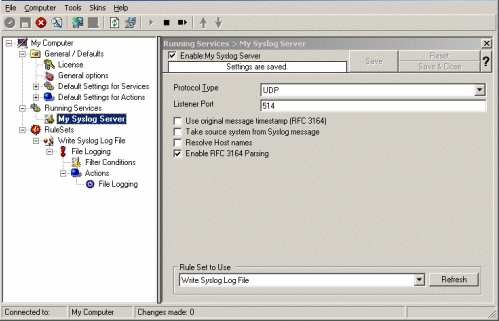
Step 3 – Configure a Syslog Server

The steps to configure the MonitorWare Agent / WinSyslog as a Syslog Server are as follows:

Configuring a Syslog Server

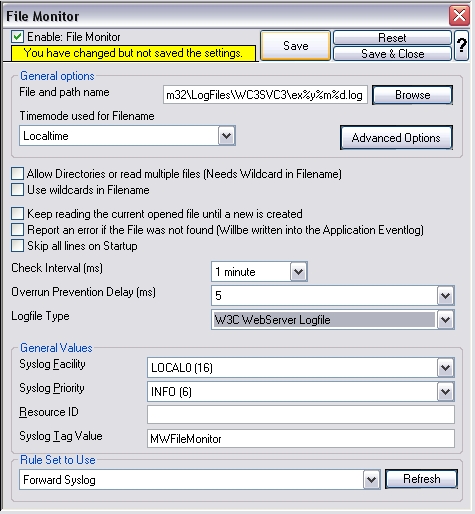
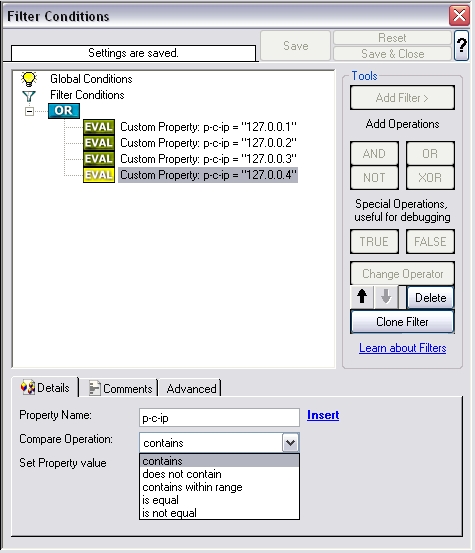
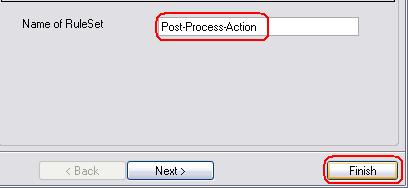
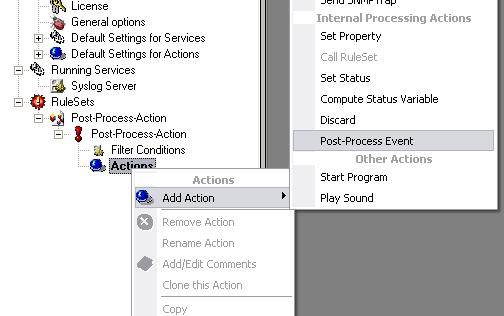
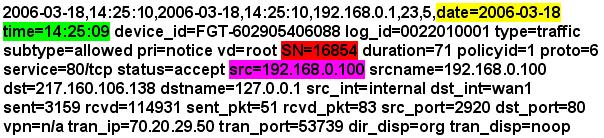
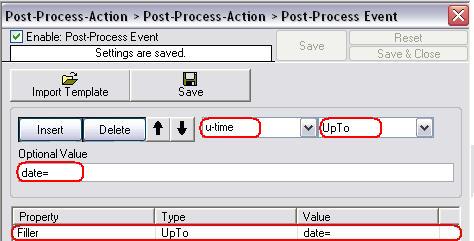
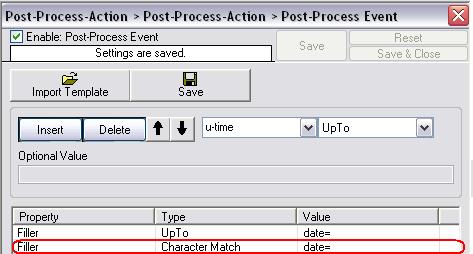
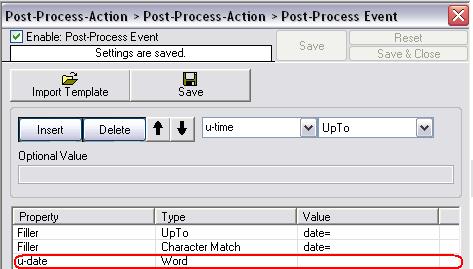
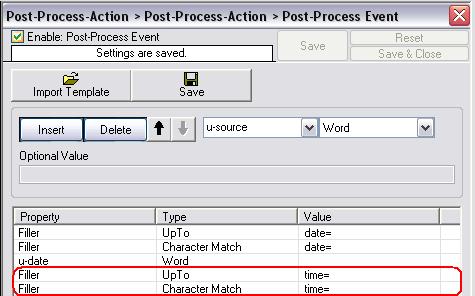
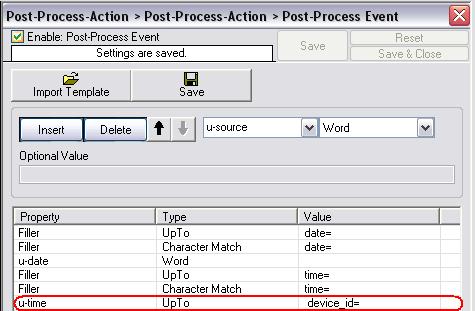
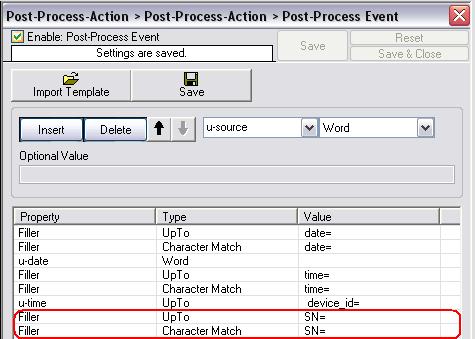
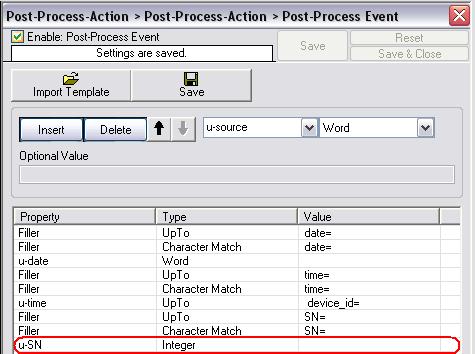
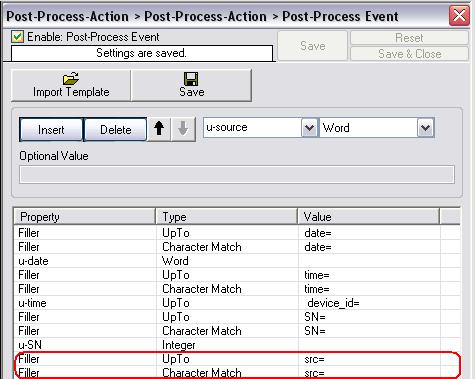
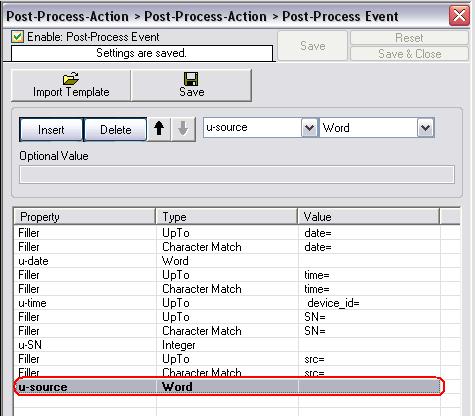
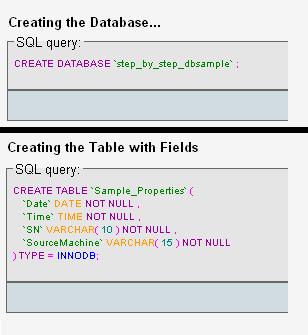
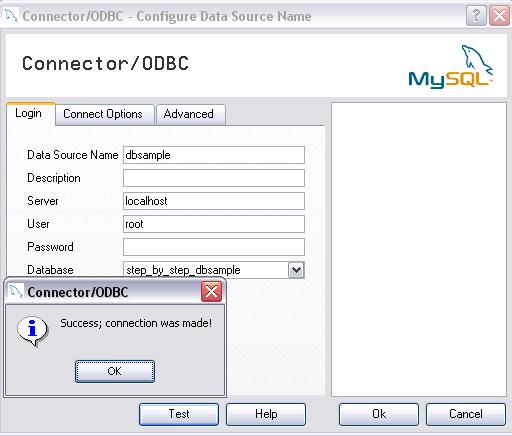
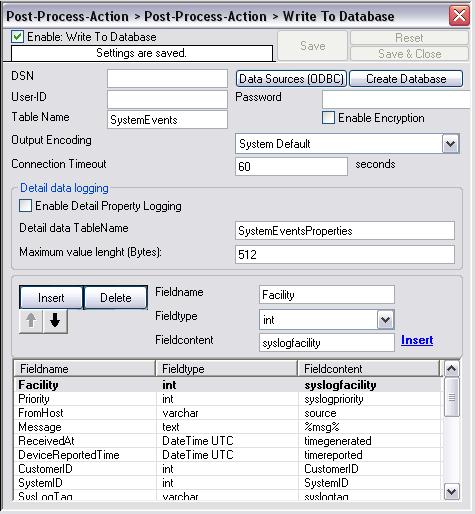
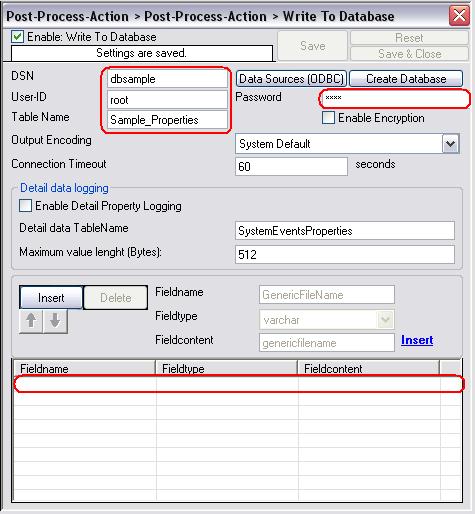
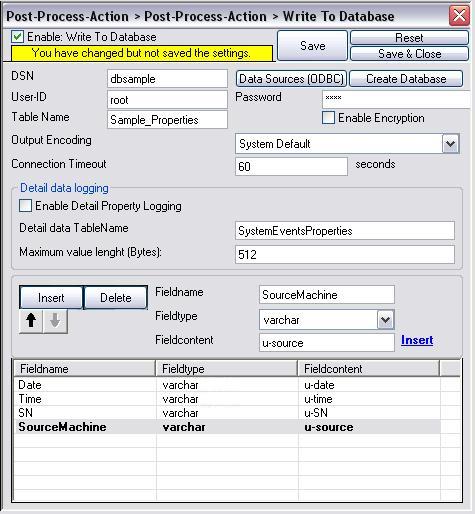
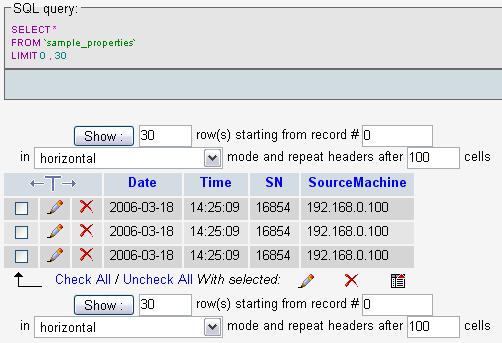
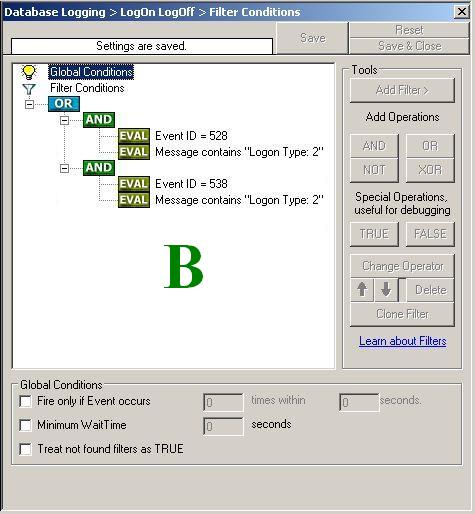
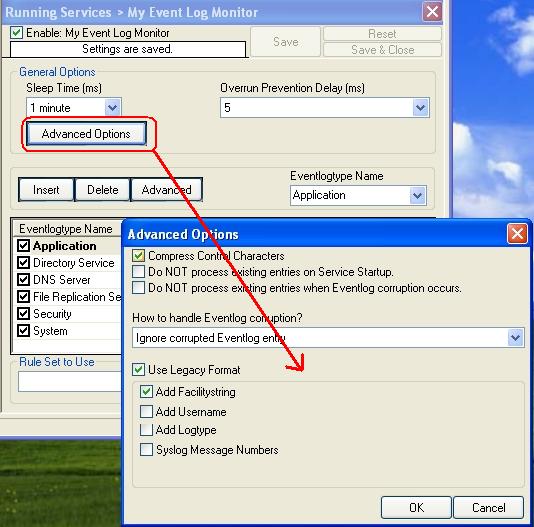
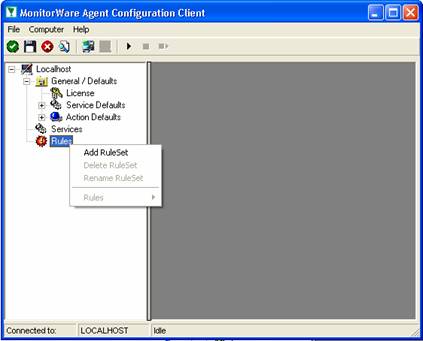
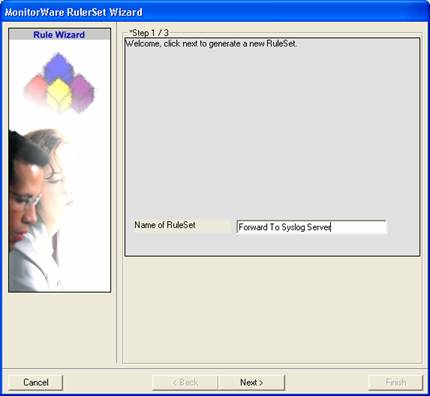
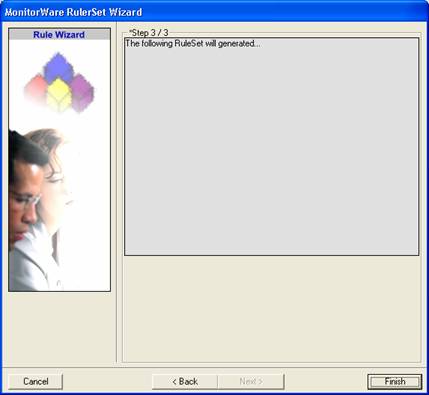
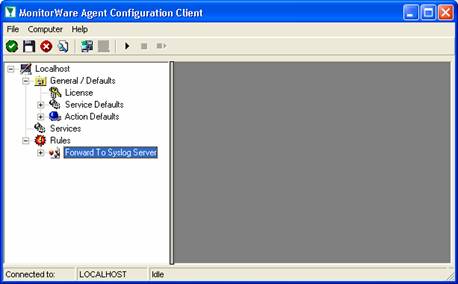
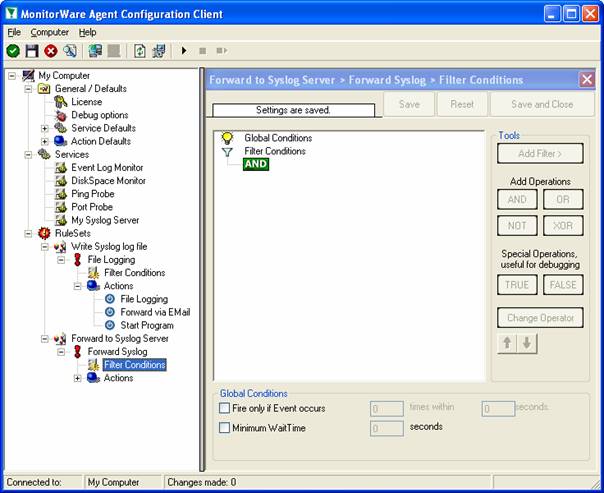
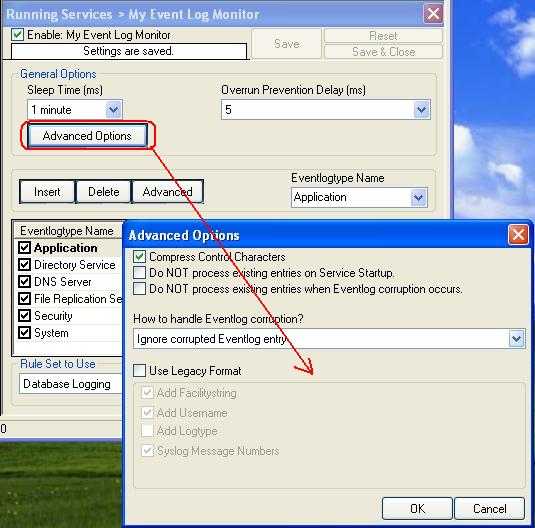
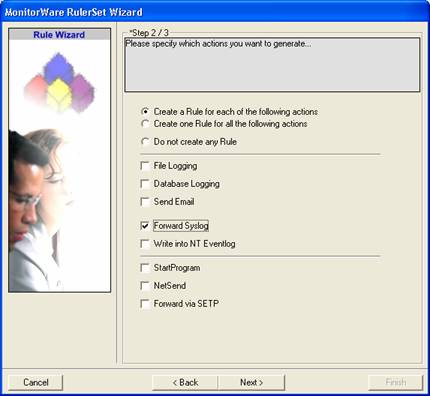
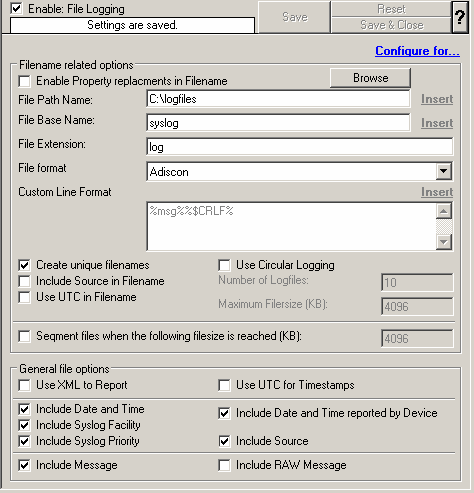
Step 4 – Create a RuleSet for Database Logging

In this section, you will create an action to write the messages that are coming from PIX to a database. Please note that these steps would be exactly the same for both MonitorWare Agent and WinSyslog.

Database Logging Steps

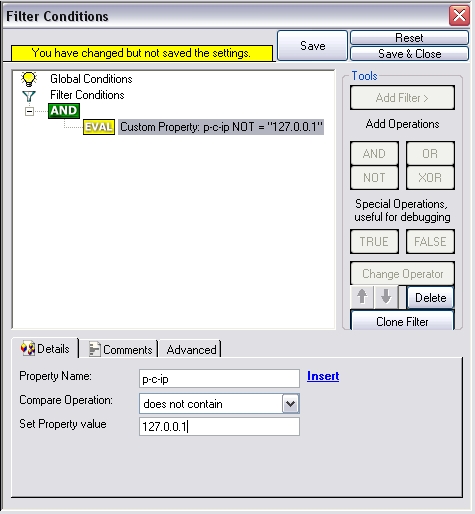
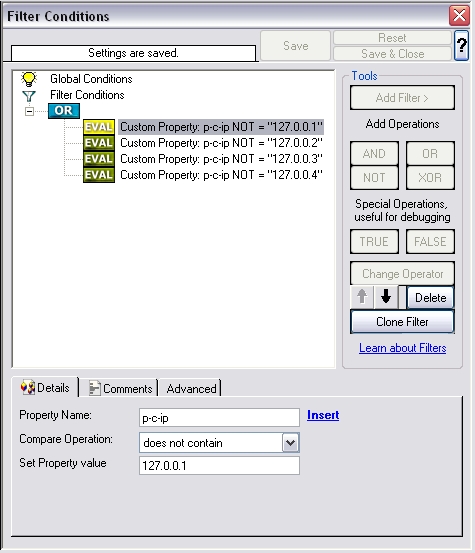
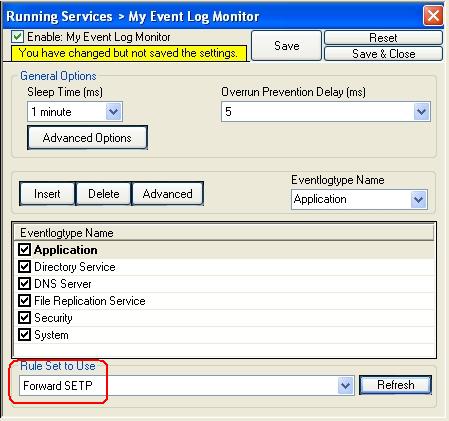
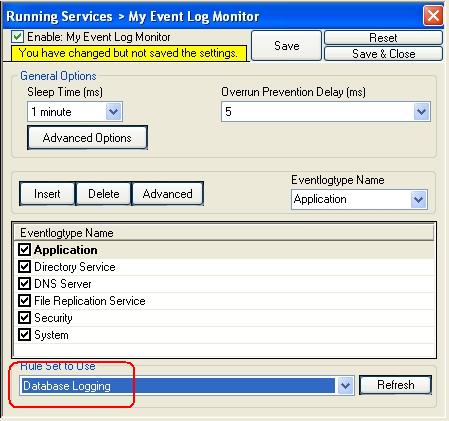
After configuring this RuleSet, make sure that

  • This rule set is associated with the Syslog Server Service that you created in Step 3. You can do this by clicking on the Syslog Server Service that you created in Step 3 on the left hand side and by selecting the name of the rule set that you created in Step 4 in “Rule Set to Use” combo box on the right hand side.
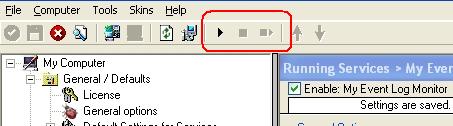
  • The service is running. You can do this by clicking on the Play button at the top of the Client.

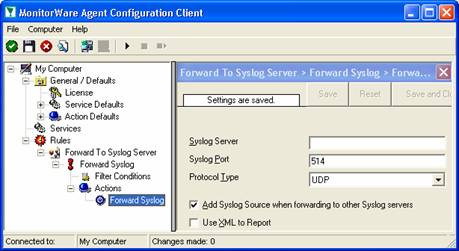
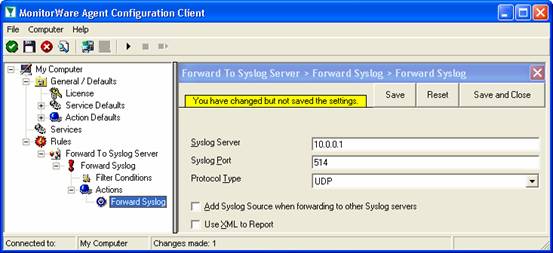
Step 5 – Configure PIX

In this step, you will need to configure PIX in such a way so that it sends the messages to the Syslog Server that you created in the above step. You would need to give the IP address or the hostname in PIX

PIX Configuration Steps

Step 6 – Preparing Web Server for MonitorWare Console

MonitorWare Console publishes its reports through the local web server (central hub server).

To avoid confusion, we recommend creating a separate directory on the web server for MonitorWare Console. Let us assume you use Microsoft Internet Information Server and run it in the default configuration. Then, you web pages are stored in the c:\inetpub\wwwroot directory. Create a subdirectory “MonitorWareConsole” directly beneath this directory.

Step 7 – Installing and Configuring MonitorWare Console

MWConsole- Installation and Configuration Steps

Step 8 – Generating PIX Reports with MonitorWare Console Manually

Following are the reports in MonitorWare Console that can be generated for PIX logs.

  • Accessed Web Sites Report
  • Blocked Ports Activity Report
  • Possible Attacks Report
  • Traffic By Hour Report
  • Traffic By Port Report
  • Outbound Traffic By IP
  • Traffic by Target IP
  • Who is Attacking Me Report

This section explains how the PIX reports can be generated with MonitorWare Console manually. In this section I will explain the generation of “Who is Attacking Me” report only. Please note that, the procedure for generating any report is almost the same.
Generating PIX Reports with Console 2.1 Manually

Step 9 – Scheduling the Generation of Reports with MonitorWare Console

This section explains how the reports can be generated with MonitorWare Console automatically using Job Manager. With Job Manager, you can generate all the reports based on a pre-defined schedule and ask it to either store it in some location on the hard disk or send it to specified recipient via email. The following section explains the scheduling of System Status Report. You can use exactly the same method to generate any of the PIX reports that are mentioned above.

Scheduling Reports with Console 2.1

You are done!

Well, this is all you need to do to configure the basic operations. We hope this article is helpful. If you have any questions or remarks, please do not hesitate to contact us at support@adiscon.com

Forwarding filtered IIS Logfiles

Forwarding filtered IIS Logfiles

Created 2006-04-19 by Timm Herget

Please note: In order to forward the IIS logs you need MWAgent.

Step 1

First, create a new RuleSet, in our sample we named it ForwardSyslog, and bind an ForwardSyslog ,or any other action you want to use for forwarding (e.g. SendEmail), to it. In our sample we now must define the syslog server where we want to forward it to:


Figure 1: Creating the ruleset and its action

Step 2

Then create your Filemonitor and point it to the location of your IIS Logfile which you want to monitor.
(Note: Daily Internet Information Server log files are named “exyymmdd.log”, with yy being the 2 digit year, mm the month and dd the day of month. To generate the same name with file monitor, use the following name “ex%y%m%d.log”.)
Set the Logfile Type to “W3C WebServer Logfile” and assign it to your newly created RuleSet (in our case its ForwardSyslog).


Figure 2: Creating and configuring the filemonitor

Step 3.1

Click on the FilterConditions Tab of your newly created RuleSet, which contains your forwarding action (in our case the ForwardSyslog ruleset). Set the filters as shown on the screen below. In our sample we want to forward every log entry, excepting accesses from client ip (c-ip) 127.0.0.1 so we set the operator to AND and use a Custom Property. Set the Property Name to “p-c-ip”, the compare operation to “does not contain” and the Property Value to “127.0.0.1”. In pseudo code this looks like this:

  • if (IP != “127.0.0.1”)
    {
    forward the logentry
    }
    else
    {
    discard the logentry
    }


Figure 3: Setting up the filterconditions

Step 3.2

Of course you can add as many ip’s to filter out as you want to. Simply change the introducing AND to OR and set those filters.
To do so simply click on the AND and then on “Change Operator”.
This means “If ip-x OR ip-y OR ip-z are not found, do x”:


Figure 4: Advancing filterconditions part one

Step 3.3

If you would specify the filters in that way, that you only want to forward some specific IP’s and not, as we mentioned above,
all excepting some specific then set the initial operator to OR and the filteroption from “does not contain” to “must contain”
and configure your IP filters:


Figure 5: Advancing filterconditions part two

(Note: There are some more special IIS filter options, read more in the online manual.)

How to store custom properties of a log message in a database

How to store custom properties of a log message in a database

Created 2006-03-27 by Timm Herget

This step-by-step guide describes a scenario where WinSyslog receives syslog data from a Fortigate firewall, parses the messages via post processing action and writes the custom parsed properties into a database.

Step 1 – Creating the Syslog Server

First, please create the syslog server service by right clicking on “Running Services” and selecting “Add Service” and “Syslog Server” from the upcoming dropdpwn menu. After creating it, leave the settings default at this time:


Figure1: creating the syslog server service

Step 2 – Creating the RuleSet

Now, right click on “RuleSets” and select “Add RuleSet”, type in a name for the ruleset and click on “Finish”:


Figure2: creating the ruleset

Step 3 – Creating the Rule and its Action

Right click on the newly created RuleSet and select “Add Rule”, again type in a name and click on “Add Rule”. Now right click on “Actions”, select “Add Action” and then “Post-Process Event”:


Figure3: creating the rule and action

Step 4 – The Syslog Data from the Fortigate Firewall

Below you can see a sample logfile of a Fortigate firewall. All properties are seperated by a space. The highlited properties we want to parse and log them to a databse in our step-by-step guide:


Figure4: the sample logfile

Step 5 – Configuring the PostProcess Action

Now we can start configuring the post process action. At first, please click on “Insert” to create the first property we want to configure for parsing. Change the property to “Filler” and the type to “UpTo” from the dropdownlists above. Also insert “date=” as value for this rule. In short this says: Take all the characters up to the begin of “date=” and drop them away, the cursor now stands at the first character of “date=” which is the “d”:


Figure5: first parsing rule

Again, click on “Insert”. Set the property to “Filler”, the type to “Character Match” and the value to “date=”. This will tell the parser to set the cursor to the first character after the string “date=” (Note: Character Match begins “searching to the end of string” from the begin of the current cursor position ONLY, so we need to jump to “date=” first via a UpTo rule (already done one step above)):


Figure6: second parsing rule

As I told above, the cursor of the parser now stands at the first character after “date=” which means we are now able to parse the first value from the logfile to a custom property: The date. To tell the parser to do so, please again click on “Insert”, name the property “u-date” or anything you want and set the type to “Word”. This will parse all characters from where the curser currently is up to the next space he will find. The date from the firewall syslog data is now stored into the property “u-date”.


Figure7: third parsing rule

Insert the next rule, set the property to “Filler”, the type to “UpTo” and the value to “time=”. Again click “Insert”, set the property to “Filler”, the type to “Character Match” and the value to “time=”. These two new rules will take all characters from the current cursor position to the last one of the string “time=” and drop them away. The cursor now stands on the first character after “time=”.


Figure8: fourth parsing rule

Again we have to insert a new rule, name it “u-time”, set the property to “UpTo” and the value to ” device_id=” (Note the space before device_id). This will write all the characters after “time=” until ” device_id=” into the property u-time. We now have the time too.


Figure9: fifth parsing rule

Insert the next two rules, for the first please set the property to “Filler”, the type to “UpTo” and the value to “SN=”. For the second please set the property to “Filler”, the type to “Character Match” and the value to “SN=” too. The cursor now stands on the first character after “SN=”.


Figure10: sixth parsing rule

Now create the new rule named “u-SN” which indicades the SerialNumber property of the syslog message from the firewall, set the type to “Integer” and click on Save. This will parse all Integer characters from the current cursor position, until no more Integer character is found, into “u-SN”.


Figure11: seventh parsing rule

We got 3 out of 4 properties now from the syslog data, so one is still remaining. Here we go. Again create two rules, both as “Filler” and with value “src=”, the first of them of type “UpTo” and the other “Character Match”. The cursor now stands on the first character after “src=”.


Figure12: eighth parsing rule

Now we only have to parse out the Source-IP which we will do via a Word type rule. Name the next Rule “u-source” and set the type to “Word”. This will parse all from the current cursor position until the next space into “u-source”. Now we got all four properties we wanted.


Figure13: last parsing rule

Step 6 – Creating the Database

Create a new Database via i.e. MySQL or MSSQL. In our sample we create it within MySQL and use PHPMyAdmin as DatabaseTool. First create the Database, we named it “step-by-step-dbsample” and then create a new table (“sample_properties”) with the following fieldnames:

  • Date
  • Time
  • SN
  • SourceMachine

The SQL Statements for this two steps should look like these:


Figure14: creating the database

Step 7 – Creating the System DSN

Now we must create a system dsn for our newly created table, so that we can access it via our database logging action later. To do so, please go to “Start” -> “Control Panel” -> “Administrative Tools” -> “Data Sources (ODBC)”. Go to the tab “System DSN” and click “Add”. Select the Driver you need from the shown list, in our sample this is “MySQL ODBC 3.51 Driver”, and click “Finish”. Please then fill in the shown configuration form in that way, that it suits your database and click on “Test”. If the test succeeds you are done, click OK then. If it failed, please re-check your configuration data. Remember the configured “Source Name”.


Figure15: testing system dsn

Step 8 – Configuring the Database Logging Action #1

Now please add a “Write to Database” action to your rule created at the beginning. To do so, expand the treeview of your “Post-Process-Action” rule in our ruleset, right click on “Actions” -> “Add Action” -> “Write to Database”. You will see the newly created Action like shown below:


Figure16: database logging action #1

Step 9 – Configuring the Database Logging Action #2

First, type in your new system dsn name in the “DSN” field, then the suiting username and password. Change the “Table Name” to the name of the table we created in step 6. After this, delete all the configured fields in the data-grid-view. Select them and then click on the “Delete” Button. After these steps are done, it should look like the following screenshot:


Figure17: database logging action #2

Step 10 – Configuring the Database Logging Action #3

Now we have to configure the database logging action in that way, that it writes our custom parsed properties into the fields of the new database/table. Please click on “Insert” first to create a new “row”. Type in the fieldname of our first field in the database/table. In our sample this is “Date”. Set the fieldname to “Date”, the fieldtype to “varchar” and the fieldcontent to “u-date” (where we parsed in the userdefined date before). Do the same now for the “Time” Field. Again click on “Insert”, set the fieldname to “Time”, the fieldtype to “varchar” and the fieldcontent to “u-time”. Repeat these steps for the two remaining fields with fieldtype “varchar” too. Click on “Save”:


Figure18: database logging action #3

Step 11 – You are done

If you now take a look into your Database (in our sample MySQL via PHPMyAdmin) you will see that it worked fine and the message properties were correctly parsed and stored (in our sample i sent 3 of those messages).


Figure19: The Result Please Note: There’s also an Article available which describes how the parsing of logfiles works, you can find it here.

Attachments:

How To setup a Failover Syslog Server

How To setup a Failover Syslog Server

Article created 2006-02-01 by Timm Herget.

You want to have an alternative syslog server for forwarding your e.g. PIX-syslog-messages, which automatically detects if the primary server is alive or not and if not he takes it’s roll until he is back? Here we go:

At first please make sure, that you have installed 2 MonitorWareAgent’s on 2 different machines and have configured the device which forwards syslog to them so, that it sends its data to both of them. Rainer Gerhards also wrote an Article about this, which you can read here.

Pre-Note: Make sure you press the “Save” button after every step – otherwise your changes will not be applied!

Configuring the Primary Server

Step 1:

Create a ruleset on the primary server (machine 1), which contains a “Forward Syslog” action and has no filter conditions configured. Type in the central-server-name to which the logs should be forwarded and leave all other settings default:


Figure1: creating the ruleset

Step 2:

Now create the primary syslog server service for which you have made the ruleset in step1 and bind it to the ruleset:


Figure2: creating the syslog server service Step 3:

At last we must create a “MonitorWare Echo Reply” service on the primary server, we will explain later for what:


Figure3: creating the monitorware echo reply

Configuring the Secondary Server

Step 1:

Create a ruleset on the secondary server (machine 2), with 1 rule named “Echo Request Successful”. Create a “Set Status” Action in it, set the property name to “ServerActive” and the property value to “1” (without the quotes). We need this to clarify later if the primary-server is active or not and if it is, we set the variable serveractive to 1 which means true.


Figure1: creating the first rule

Step 2:

Now set a message contains filter inside this first rule’s filter conditions. Check the Message to contain: “MWEchoRequest success target“:


Figure2: filter conditions for first rule

Step 3:

We have to create the second rule into the above created echo-request-ruleset now. Again we need to configure a “Set Status” Action and set the property name to “ServerActive” and the property value to “0” now, for the case that the primary server is no longer active:


Figure3: creating the second rule

Step 4:

Again we have to set the filter settings for this case: Check the Message to contain: “MWEchoRequest fail target“:


Figure4: filter conditions for second rule

Step 5:

Now we must create the “MonitorWare Echo Request” service for which we have configured the rule set with its two rules above. Set the check interval to 5 seconds, check “Also generate an event if echo reply was successful” and press “Insert” button to insert a new machine to be requested. In “IP / Hostname” field, type in the ip/hostname of the primary server and let the port default “10001”, assign the service to the “Echo Request Rule” ruleset we created for it:


Figure5: configuring the MonitorWare echo request service

Step 6:

Now let us create a new Rule Set, not a 3rd rule in the ruleset we created for the echo request! Create a forward syslog action in it, type in the name of your CENTRAL-SERVER where the logs should be sent to after this is finished (not the primary server) and leave all other settings default:


Figure6: create rule forward-syslog

Step 7:

Check the filter conditions for the forward syslog ruleset now. Create a “Status Name and Value” filter by right-clicking on the AND, then “Add Filter” -> “General” -> “Status Name and Value”:


Figure7: creating the filters. part 1

Step 8:

Now we have to configure the newly created “Status Name and Value” filter by setting the property name to our global status variable we named “ServerActive”, the compare operation to “is equal” and the property value to “0” (for the case that the primary server is NOT active, because only then this server should do its job):


Figure8: creating the filters. part 2

Step 9:

Create the secondary syslog server service now, let all settings at default values and just assign it to the “Forward Syslog” ruleset:


Figure9: creating the secondary syslog server

Step 10:

The last thing we have to do is to start both MWAgent’s, the one on machine 1 (primary server) and the one on machine 2 (secondary server):


Figure10: start the 2 MWAgent’s

Downloads:

Here are sample configs for the primary and secondary server in *.reg file’s:

How To setup a Failover Syslog Server

How To setup a Failover Syslog Server

Article created 2006-02-01 by Timm Herget.

You want to have an alternative syslog server for forwarding your e.g. PIX-syslog-messages, which automatically detects if the primary server is alive or not and if not he takes it’s roll until he is back? Here we go:

At first please make sure, that you have installed 2 MonitorWareAgent’s on 2 different machines and have configured the device which forwards syslog to them so, that it sends its data to both of them. Rainer Gerhards also wrote an Article about this, which you can read here.

Pre-Note: Make sure you press the “Save” button after every step – otherwise your changes will not be applied!

Configuring the Primary Server

Step 1:

Create a ruleset on the primary server (machine 1), which contains a “Forward Syslog” action and has no filter conditions configured. Type in the central-server-name to which the logs should be forwarded and leave all other settings default:


Figure1: creating the ruleset

Step 2:

Now create the primary syslog server service for which you have made the ruleset in step1 and bind it to the ruleset:


Figure2: creating the syslog server service Step 3:

At last we must create a “MonitorWare Echo Reply” service on the primary server, we will explain later for what:


Figure3: creating the monitorware echo reply

Configuring the Secondary Server

Step 1:

Create a ruleset on the secondary server (machine 2), with 1 rule named “Echo Request Successful”. Create a “Set Status” Action in it, set the property name to “ServerActive” and the property value to “1” (without the quotes). We need this to clarify later if the primary-server is active or not and if it is, we set the variable serveractive to 1 which means true.


Figure1: creating the first rule

Step 2:

Now set a message contains filter inside this first rule’s filter conditions. Check the Message to contain: “MWEchoRequest success target“:


Figure2: filter conditions for first rule

Step 3:

We have to create the second rule into the above created echo-request-ruleset now. Again we need to configure a “Set Status” Action and set the property name to “ServerActive” and the property value to “0” now, for the case that the primary server is no longer active:


Figure3: creating the second rule

Step 4:

Again we have to set the filter settings for this case: Check the Message to contain: “MWEchoRequest fail target“:


Figure4: filter conditions for second rule

Step 5:

Now we must create the “MonitorWare Echo Request” service for which we have configured the rule set with its two rules above. Set the check interval to 5 seconds, check “Also generate an event if echo reply was successful” and press “Insert” button to insert a new machine to be requested. In “IP / Hostname” field, type in the ip/hostname of the primary server and let the port default “10001”, assign the service to the “Echo Request Rule” ruleset we created for it:


Figure5: configuring the MonitorWare echo request service

Step 6:

Now let us create a new Rule Set, not a 3rd rule in the ruleset we created for the echo request! Create a forward syslog action in it, type in the name of your CENTRAL-SERVER where the logs should be sent to after this is finished (not the primary server) and leave all other settings default:


Figure6: create rule forward-syslog

Step 7:

Check the filter conditions for the forward syslog ruleset now. Create a “Status Name and Value” filter by right-clicking on the AND, then “Add Filter” -> “General” -> “Status Name and Value”:


Figure7: creating the filters. part 1

Step 8:

Now we have to configure the newly created “Status Name and Value” filter by setting the property name to our global status variable we named “ServerActive”, the compare operation to “is equal” and the property value to “0” (for the case that the primary server is NOT active, because only then this server should do its job):


Figure8: creating the filters. part 2

Step 9:

Create the secondary syslog server service now, let all settings at default values and just assign it to the “Forward Syslog” ruleset:


Figure9: creating the secondary syslog server

Step 10:

The last thing we have to do is to start both MWAgent’s, the one on machine 1 (primary server) and the one on machine 2 (secondary server):


Figure10: start the 2 MWAgent’s

Downloads:

Here are sample configs for the primary and secondary server in *.reg file’s:

Interactive Logon/Logoff Filter

Interactive Logon/Logoff Filter

Created 2005-10-05 by Timm Herget

Please Note: This article is valid for EventReporter 8.x / MWAgent 4.x and lower and describes, how to set the filters to get only interactive logon’s/logoff’s.

Click on your “Filter Conditions”. Here we have a little problem, because it depends on your operating system. If you work with Windows XP/2003 you should set the filters as shown on “Screenshot A” of our screenshots below. If you are using an older operating system, you should choose “Screenshot B”. This is because of a bug in Windows.

If a user logs on to windows interactive, event 528 with logon type 2 is logged.
Ostensibly, event 538 is logged whenever a user logs off, whether from a network connection, interactive logon, or other logon type. However, this event is not dependably logged, for a variety of reasons. In a nutshell, there is no way to reliably track user logoff events in the Windows environment. An interactive logoff is marked by logon type 2, too.

For further information about the issue with event 538 see this page.

Note: Beginning with Windows Server 2003, logoffs of logon type 2 sessions are logged with event 551.


Screenshot A: Set the Filters for WinXP/2003


Screenshot B: Set the Filters for older Windows
Click here to download a ZIP-Package with the samples as registry files. The ZIP-Package contains 4 files. Two files are version A and B for EventReporter and the other two files are version A and B for MonitorWare Agent.

How To setup EventLogMonitor Service

How To setup EventLogMonitor Service

Article created 2003-02-24 by Rainer Gerhards.
Last Updated 2011-05-25 by Tom Bergfeld.

Please note:

Starting with EventReporter 8.3 and MonitorWare Agent 4.3 two different event log monitor services are provided. They are called “Event Log Monitor” (V1) and “Event Log Monitor V2”. In short, the V2 version is recommended for Windows Vista (and above, e.g. Longhorn Server) while the other version is for previous releases of Windows (NT, 2000, 2003, XP). Please find more information about the different EventLogMonitors at Which Event Log Monitor to use.
There is also a guide How To setup EventLogMonitor V2 Service.

1. First, right click on “Services”, then select “Add Service” and then “Event Log Monitor”:

2. Once you have done so, a new wizard starts.
If the following Popup appears, please select “Create Service”:

Again, you can use either the default name or any one you like. We will use “My Event Log Monitor” in this sample. Leave the “Use default settings” selected and press “Next”.

3. As we have used the default, the wizard will immediately proceed with step 3, the confirmation page. Press “Finish” to create the service. The wizard completes and returns to the configuration client.

4. Now, you will see the newly created service beneath the “Services” part of the tree view. To check its parameters, select it:


As you can see, the service has been created with the default parameters.

Note 1: The “Default RuleSet” has been automatically assigned as the rule set to use. By default, the wizard will always assign the first rule set visible in the tree view to new services. In our case, this is not correct and will be corrected soon.

Note 2: If you want to generate reports (using Monilog) on the data via this service i.e. EventLogMonitor, then you have to press the “Configure for Monilog” button and make the settings as shown in the screen-shot.

Note 3: If you want to generate reports (using MonitorWare Console) on the data via this service i.e. EventLogMonitor, then you have to uncheck the “Use Legacy Format” option. This is recommended. If you don’t uncheck this option then meaningful reports aren’t generated (i.e. reports are not properly consolidated by MonitorWare Console).

5. Now you must differentiate between clients and central hub server. In clients use the “Forward ” RuleSet we have created in Step 2, select it as rule set to use. In central hub server select the “Database Logging” RuleSet we have created in Step 3. Leave all other settings in their default.

Clients:

Central hub server:

6. Finally, save the change and start MonitorWareAgent. This procedure completes the configuration of the syslog server.

MonitorWare Agent cannot dynamically read changed configurations. As such, it needs to be restarted after such changes. In our sample, the service was not yet started, so we simply need to start it. If it already runs, you need to restart it.

With step 5 the client machines configuration has finished. All the next steps are only concerned with the central hub server.

Forwarding NT Event Logs to a Syslog Server

Step-By-Step Guides

Article created 2003-04-30 by Rainer Gerhards.
Last Updated 2005-08-16 by Timm Herget.

Forwarding NT Event Logs to a Syslog Server

In this scenario, an event log monitor is used to forward all events written to the NT Event Log to a syslog server. This can either be another instance of MonitorWare or any standard syslog server, for example on a UNIX platform. The data will be forwarded in the EventReporter compatible format, as the processes running on the syslog server require that format (this is just an assumption).

This is a scenario often used together with UNIX based management solutions. The event log monitor is used here to forward events into a central repository, where it will be analyzed using pre-existing procedures.

Please note that if the data is to be forwarded to another instance of a MonitorWare Agent, we highly recommend using the SETP protocol instead of syslog – but this is beyond the scope of this scenario here.

Step 1 – Defining a Rule Set for Syslog Forwarding

The rule set specifies what action to carry out. You might be tempted to define the service first, but starting with the rule set makes things easier as it already is present when the service will be defined later and needs to be bound to a rule set.

To define a new rule set, right click “Rules”. A pop up menu will appear. Select “Add Rule Set” from this menu. On screen, it looks as follows:

Then, a wizard starts. Change the name of the rule set to whatever name you like. We will use “Forward To Syslog Server” in this example. The screen looks as follows:

Click “Next”. A new wizard page appears:

There, select “Forward Syslog”. Do not select any other options for this sample. Also, leave the “Create a Rule for each of the following actions” setting selected. Click “Next”.

This is just a confirmation page. Click “Finish” to create the rule set.

The wizard closes and the client shows a newly created rule set.

As you can see, the “Forward To Syslog Server” rule set is now present. Please expand it in the tree view until you have the following screen contents:

As you can see, we have a “Forward Syslog” action configured. We will review the settings just for your information. Click on “Filter Conditions”:

As you can see, no filter conditions are selected. This means that the all information units (the event log information) will be matched by these filter conditions. As such, the rules for the “Forward Syslog” action will always be carried out.

Now let us check the “Forward Syslog” action itself. Please select it in the tree view:

As you can see, some useful defaults are already there. It forwards syslog messages via the standard UDP protocol to the standard port of 514. These values are specified by the syslog standard and most syslog servers will expect them. Only change them if you definitely know that the syslog server is configured to use other values. If in doubt, use the default ones.

However, there are also some things that need to be completed and changed for this scenario.

Obviously, the syslog server to receive the message needs to be specified. You can use either a system name or IP address. In our sample, we will use the IP address, because this is faster and more reliable as it does not depend on DNS name resolution. Our target syslog server is on address 10.0.0.1.

Next, we will uncheck the “Add Syslog Source when forwarding…” options. This option is useful when messages are to be forwarded to the WinSyslog Interactive Syslog Server for instant review. If forwarded to a “real” syslog server, it typically is not useful and might influence the receiving syslog server’s capability to correctly check the message contents.

The “Use XML to Report” option is left unchecked because in this scenario there are pre-existing scripts on the syslog server that expect EventReporter legacy format. The XML option is not compatible with that format.

After the changes, the dialog looks as follows:

After doing so, you will notice the yellow text on top of the window. It tells you that the configuration changes have not yet been applied. To do so, press “save”.

Now you have a workable rule set for forwarding event monitor data to the syslog server.

Step 2 – Create an Event Log Monitor Service

Now we need to define an “event log monitor” service. It is the process that monitors the Windows event log for new entries and creates information units as soon as a new entry is found. These information units are then passed to the rule set which in turn forwards them to the syslog server configured in step 1.

To define the event log monitor, right click on “Services”, then select “Add Service” and the “Event Log Monitor”:

Once you have done so, a new wizard starts:

Again, you can use either the default name or any one you like. We will use “My Event Log Monitor” in this sample. Leave the “Use default settings” selected and press “Next”:

As we have used the default, the wizard will immediately proceed with step 3, the confirmation page. Press “Finish” to create the service. The wizard completes and returns to the configuration client. There, you will see the newly created service beneath the “Services” part of the tree view:

To check its parameters, select it:

As you can see, the service has been created with the default parameters. As such, it monitors all event logs that are present on the system. It also has some protection against overruns of the receiving system or intermediary routers. It monitors the event log in a 60 second interval (sleep time of 60.000 milliseconds), which is the recommended value for typical installations.

Please note that the “Forward To Syslog Server” rule set has been automatically assigned as the rule set to use. This is the case because we already created it and it is the only rule set. By default, the wizard will always assign the first rule set visible in the tree view to new services. If that is not the intended rule set, you need to change it to the correct one here in the service definition.

Also, please note that the wizard uses the default properties from the “Service Defaults”. Obviously, if these are changed, the default properties for new services will differ.

There is one change we need to make to the service properties: that is the “Use Legacy Format” option. As specified in the scenario, some pre-existing scripts at the syslog server expect the EventReporter legacy format. As such, we need to check that option:

Finally, we review the log specific advanced properties. As a sample, we will go over the application log advanced properties. To do so, click the “Advanced” button:

Most importantly, we can select the syslog facility that is to be used for the generated information units here. In our sample, we leave it as local. We also leave the “Report Truncated Log” option checked. This option will generate a warning message if the respective Windows log is truncated, for example by operator request. If that happens during day-to-day operations in you environment, you might want to uncheck it.

Click OK to return to the main property sheet.

This procedure completes the configuration of the event log monitor.

Step 3 – (Re-)Start the MonitorWare Agent Service

MonitorWare Agent cannot dynamically read changed configurations. As such, it needs to be restarted after such changes. In our sample, the service was not yet started, so we simply need to start it. If it already runs, you need to restart it.

Service control can be done with both the respective operating system capabilities (like service manager MMC) or with the configuration client. These are shown in the red surrounded area in the following screen shot:

The buttons resemble Windows service manager – start, stop and restart. In this sample, stop and restart are grayed out because the service is not running.

After service restarts, the new definitions are active and MonitorWare Agent will forward all events from the Windows event log to the configured syslog server. Please note that on the first run, all already existing events will be forwarded. Therefore, this might take a little while. On all successive service start, only new events will be forwarded.

Forwarding NT Event Logs to a Syslog Server

Step-By-Step Guides

Article created 2003-04-30 by Rainer Gerhards.
Last Updated 2005-08-16 by Timm Herget.

Forwarding NT Event Logs to a Syslog Server

In this scenario, an event log monitor is used to forward all events written to the NT Event Log to a syslog server. This can either be another instance of MonitorWare or any standard syslog server, for example on a UNIX platform. The data will be forwarded in the EventReporter compatible format, as the processes running on the syslog server require that format (this is just an assumption).

This is a scenario often used together with UNIX based management solutions. The event log monitor is used here to forward events into a central repository, where it will be analyzed using pre-existing procedures.

Please note that if the data is to be forwarded to another instance of a MonitorWare Agent, we highly recommend using the SETP protocol instead of syslog – but this is beyond the scope of this scenario here.

Step 1 – Defining a Rule Set for Syslog Forwarding

The rule set specifies what action to carry out. You might be tempted to define the service first, but starting with the rule set makes things easier as it already is present when the service will be defined later and needs to be bound to a rule set.

To define a new rule set, right click “Rules”. A pop up menu will appear. Select “Add Rule Set” from this menu. On screen, it looks as follows:

Then, a wizard starts. Change the name of the rule set to whatever name you like. We will use “Forward To Syslog Server” in this example. The screen looks as follows:

Click “Next”. A new wizard page appears:

There, select “Forward Syslog”. Do not select any other options for this sample. Also, leave the “Create a Rule for each of the following actions” setting selected. Click “Next”.

This is just a confirmation page. Click “Finish” to create the rule set.

The wizard closes and the client shows a newly created rule set.

As you can see, the “Forward To Syslog Server” rule set is now present. Please expand it in the tree view until you have the following screen contents:

As you can see, we have a “Forward Syslog” action configured. We will review the settings just for your information. Click on “Filter Conditions”:

As you can see, no filter conditions are selected. This means that the all information units (the event log information) will be matched by these filter conditions. As such, the rules for the “Forward Syslog” action will always be carried out.

Now let us check the “Forward Syslog” action itself. Please select it in the tree view:

As you can see, some useful defaults are already there. It forwards syslog messages via the standard UDP protocol to the standard port of 514. These values are specified by the syslog standard and most syslog servers will expect them. Only change them if you definitely know that the syslog server is configured to use other values. If in doubt, use the default ones.

However, there are also some things that need to be completed and changed for this scenario.

Obviously, the syslog server to receive the message needs to be specified. You can use either a system name or IP address. In our sample, we will use the IP address, because this is faster and more reliable as it does not depend on DNS name resolution. Our target syslog server is on address 10.0.0.1.

Next, we will uncheck the “Add Syslog Source when forwarding…” options. This option is useful when messages are to be forwarded to the WinSyslog Interactive Syslog Server for instant review. If forwarded to a “real” syslog server, it typically is not useful and might influence the receiving syslog server’s capability to correctly check the message contents.

The “Use XML to Report” option is left unchecked because in this scenario there are pre-existing scripts on the syslog server that expect EventReporter legacy format. The XML option is not compatible with that format.

After the changes, the dialog looks as follows:

After doing so, you will notice the yellow text on top of the window. It tells you that the configuration changes have not yet been applied. To do so, press “save”.

Now you have a workable rule set for forwarding event monitor data to the syslog server.

Step 2 – Create an Event Log Monitor Service

Now we need to define an “event log monitor” service. It is the process that monitors the Windows event log for new entries and creates information units as soon as a new entry is found. These information units are then passed to the rule set which in turn forwards them to the syslog server configured in step 1.

To define the event log monitor, right click on “Services”, then select “Add Service” and the “Event Log Monitor”:

Once you have done so, a new wizard starts:

Again, you can use either the default name or any one you like. We will use “My Event Log Monitor” in this sample. Leave the “Use default settings” selected and press “Next”:

As we have used the default, the wizard will immediately proceed with step 3, the confirmation page. Press “Finish” to create the service. The wizard completes and returns to the configuration client. There, you will see the newly created service beneath the “Services” part of the tree view:

To check its parameters, select it:

As you can see, the service has been created with the default parameters. As such, it monitors all event logs that are present on the system. It also has some protection against overruns of the receiving system or intermediary routers. It monitors the event log in a 60 second interval (sleep time of 60.000 milliseconds), which is the recommended value for typical installations.

Please note that the “Forward To Syslog Server” rule set has been automatically assigned as the rule set to use. This is the case because we already created it and it is the only rule set. By default, the wizard will always assign the first rule set visible in the tree view to new services. If that is not the intended rule set, you need to change it to the correct one here in the service definition.

Also, please note that the wizard uses the default properties from the “Service Defaults”. Obviously, if these are changed, the default properties for new services will differ.

There is one change we need to make to the service properties: that is the “Use Legacy Format” option. As specified in the scenario, some pre-existing scripts at the syslog server expect the EventReporter legacy format. As such, we need to check that option:

Finally, we review the log specific advanced properties. As a sample, we will go over the application log advanced properties. To do so, click the “Advanced” button:

Most importantly, we can select the syslog facility that is to be used for the generated information units here. In our sample, we leave it as local. We also leave the “Report Truncated Log” option checked. This option will generate a warning message if the respective Windows log is truncated, for example by operator request. If that happens during day-to-day operations in you environment, you might want to uncheck it.

Click OK to return to the main property sheet.

This procedure completes the configuration of the event log monitor.

Step 3 – (Re-)Start the MonitorWare Agent Service

MonitorWare Agent cannot dynamically read changed configurations. As such, it needs to be restarted after such changes. In our sample, the service was not yet started, so we simply need to start it. If it already runs, you need to restart it.

Service control can be done with both the respective operating system capabilities (like service manager MMC) or with the configuration client. These are shown in the red surrounded area in the following screen shot:

The buttons resemble Windows service manager – start, stop and restart. In this sample, stop and restart are grayed out because the service is not running.

After service restarts, the new definitions are active and MonitorWare Agent will forward all events from the Windows event log to the configured syslog server. Please note that on the first run, all already existing events will be forwarded. Therefore, this might take a little while. On all successive service start, only new events will be forwarded.

Creating a simple Syslog Server

Step-By-Step Guides

Article created 2005-05-17 by Hamid Ali Raja.

Creating a simple Syslog Server

In this scenario, a simple Syslog server will be created. No other services are configured. The Syslog server will operate as a standard Syslog server on the default port of 514/UDP. All incoming data will be written to a single text file.

Step 1 – Defining a Rule Set for File Logging

The rule set specifies what action to carry out. You might be tempted to define the service first, but starting with the rule set makes things easier as it will be already present when the service is defined later and needs to be bound to a rule set.

To define a new rule set, right click “Rules”. A pop up menu will appear. Select “Add Rule Set” from this menu. On screen, it looks as follows:

Then,a wizard starts. Change the name of the rule set to whatever name you like. We will use “Write Syslog Log File” in this example. The screen looks as follows:

Click”Next”. A new wizard page appears:

There,select file logging. Do not select any other options for this example. Also, leave the “Create a Rule for each of the following actions” setting selected. Click “Next”.

This is just a confirmation page. Click “Finish” to create the rule set.

The wizard closes and the client shows a newly created rule set.

As you can see, the “Write Syslog Log File” rule set is now present. Please expand it in the tree view until you have the following screen contents:

As you can see, we have a “File Logging” action configured. We will review the settings just for your information. Click on “Filter Conditions”:

As you can see, none of the filter conditions are enabled. This means that the all information units (incoming messages) will be matched by these filter conditions. As such, the rules for the “File Logging” action will always be carried out.

Please note that this also means that all Syslog priorities and facilities will be written to the same file.

Now let us check the “File Logging” action itself. Please select it in the tree view:

As you can see, it has been created with the default parameters. Each day, a file will be created in the C:\temp directory and its base name will be MonitorWare. It will include all information items in the file.

If you would like to store it into a separate directory or change the file name, here is the place to do it. Important: please make sure the directory you specify exists! If it does not yet exist, please create it before you start the service. If the directory does not exist, the service is not able to store any files.

In our example, we would like to save it to “c:\logfiles” with a base name of “Syslog”. Therefore, we change these properties:

After doing so, you will notice the yellow text on top of the window. It tells you that the configuration changes have not yet been applied. To do so, press “save”.

Now you have a workable rule set for logging incoming messages to a text file.

Step 2 – Create a Syslog Server Service

Now we need to define a Syslog server service. A Syslog server is also sometimes called a “Syslog daemon”, “Syslogd” or “Syslog listener”. It is the process that receives incoming messages.

To define it, right click on “Services”, then select “Add Service” and the “Syslog Server”:

Once you have done so, a new wizard starts:

Again, you can use either the default name or any one you like. We will use “My Syslog Server” in this example. Leave the “Use default settings” selected and press “Next”:

As we have used the default, the wizard will immediately proceed with step 3, the confirmation page. Press “Finish” to create the service. The wizard completes and returns to the configuration client. There, you will see the newly created service beneath the “Services” part of the tree view:

To check its parameters, select it:

As you can see, the service has been created with the default parameters. As such, it operates as a RFC compliant standard Syslog server.

Please note that the “Write Syslog Log File” has been automatically assigned as the rule set to use. This is the case because we already created it and it is the only rule set. By default, the wizard will always assign the first rule set visible in the tree view to new services. If another one is to be used, you need to change it to the correct one here in the service definition.

Also, note that the wizard uses the default properties from the “Service Defaults”. Obviously, if these are changed, the default properties for new services will differ.

This procedure completes the configuration of the Syslog server.

Step 3 – (Re-) Start the Service

Application cannot dynamically read changed configurations. As such, it needs to be restarted after such changes. In our example, the service was not yet started, so we simply need to start it. If it’s already running, you need to restart it.

Service control can be done with both the respective operating system capabilities (like service manager MMC) or with the configuration client. These are shown in the red surrounded area in the following screen shot:

The buttons resemble Windows service manager – start, stop and restart. In this example, stop and restart are grayed out because the service is not running.

After service restart, the new definitions are active and application is ready to accept and store incoming messages.

Step 4 – Configure your Syslog-Enabled Devices

Even though application is now ready, it can only receive messages if some devices send them. Remember, Syslog is a protocol where the server is passively waiting for incoming messages. As long as no device sends message, the Syslog server will not log anything.

Since there are a large variety of devices, we unfortunately cannot provide device specific instructions. However, almost all devices need to be configured with their specific configuration tool. Typically, only two settings need to be made: one to activate Syslog messages at all and one with the Syslog server IP address or name.

For some devices, we have step-by-step guides. Please read “Sample Syslog Device Configurations” for further details.

Remember: the computer running application now acts as a Syslog server. As such, you need to find out its IP address or name and supply it to the device as the Syslog server. Please note that not all devices can operate with computer names. Use the IP address, if in doubt.