Step 1 – Setting up the central log server:
The central log server is the most important part of our central log storage and thus will be configured as the first part. And due to all the things it needs to do, it has the most work of course. When selecting your machine to install the central log server on, please keep in mind, that you need quite a good machine for larger networks. If you have a very large environment, it might be a good idea to use multiple servers for this scenario with a load balancer and a separate database server. But in this guide, we will have it all on one machine.
Prerequisites:
The following should be installed and working:
- Windows Server operating system (Windows Server 2008)
- Database Server (MSSQL)
- IIS Webservice
- MonitorWare Agent Professional Server (V7.2)
The list holds the things necessarily needed. In the brackets is schon which we will use in this example. Please note, that this will work with other versions as well, especially with MonitorWare Agent.
As mentioned before, MonitorWare Agent will have multiple purposes. It should receive syslog via TCP and UDP, monitor the local EventLog and textbased logfiles as well as writing everything into a database and sending email messages in case of error and critical messages occuring.
Step 1.1
First of all, we will set up the processing rules and actions. We will start this way due to the design of MonitorWare Agent. Since the Services need to be bound to a ruleset upon creation, we will start this way, so the ruleset is there already when creating the service.
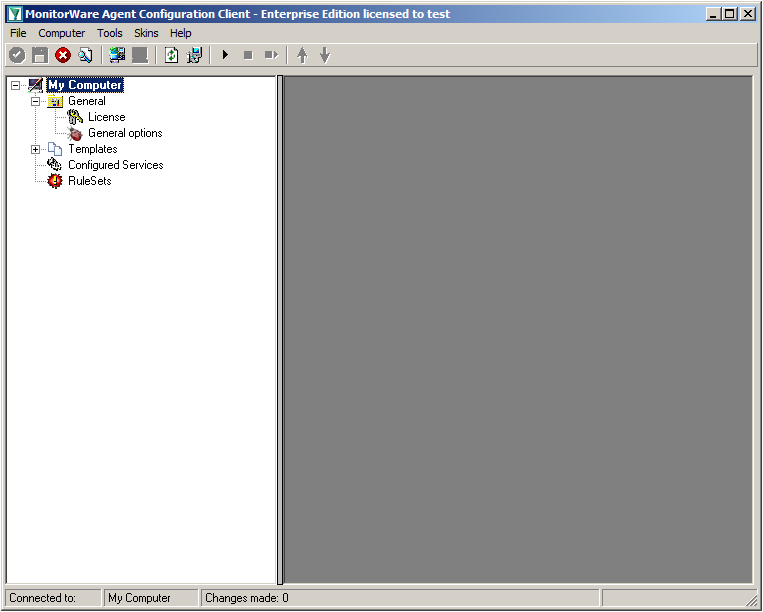
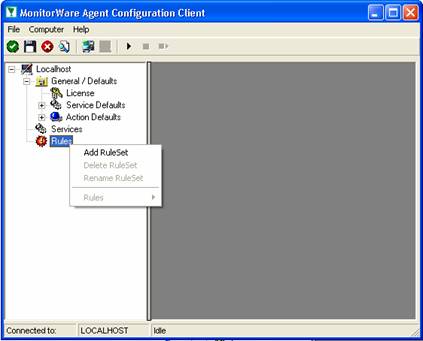
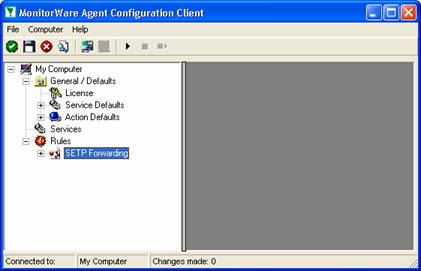
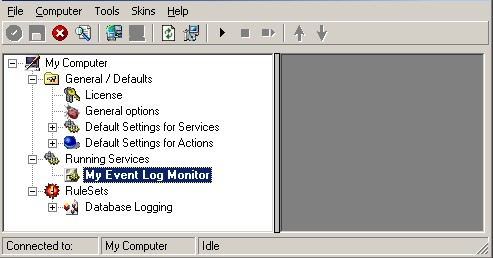
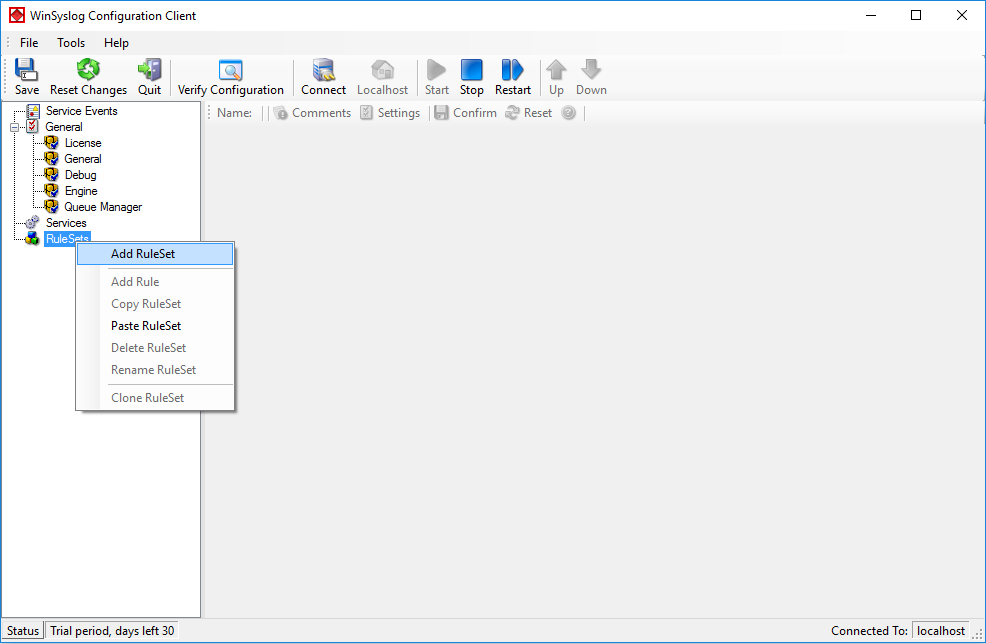
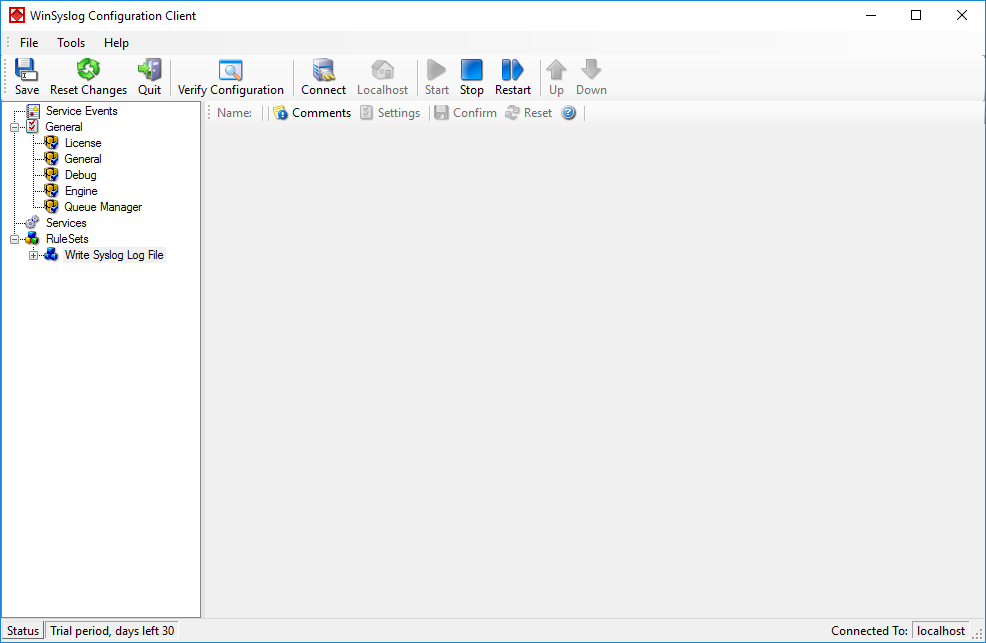
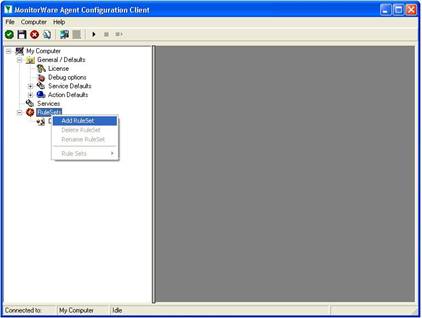
When starting MonitorWare Agent the first time, you will see on the lefthand side our overview of “Configured Services” and “Rulesets”. Right now, there shouldn’t be any entries here.
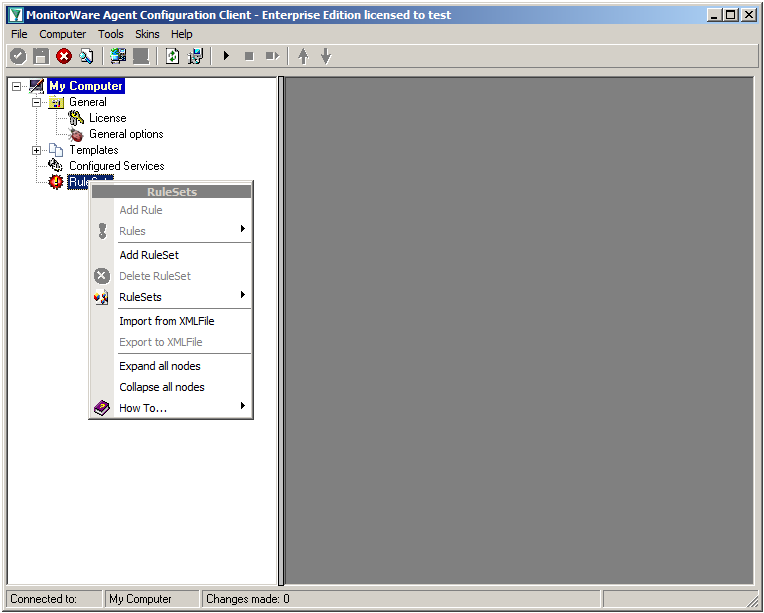
Right click on “Rulesets”. A context-menu will open.
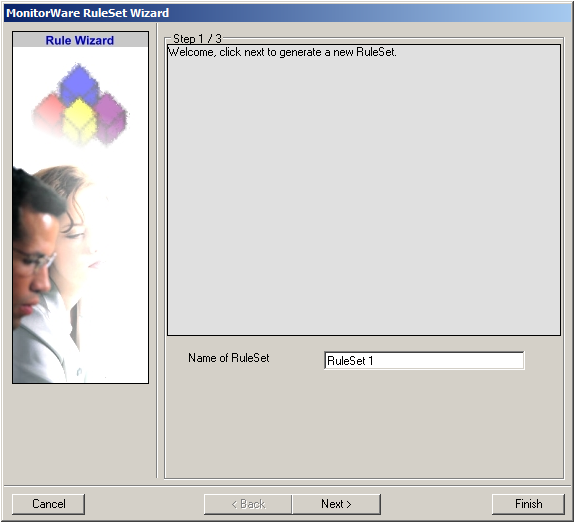
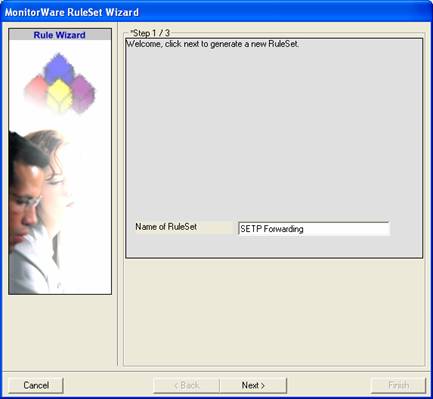
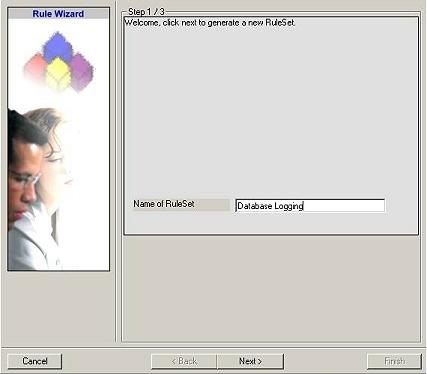
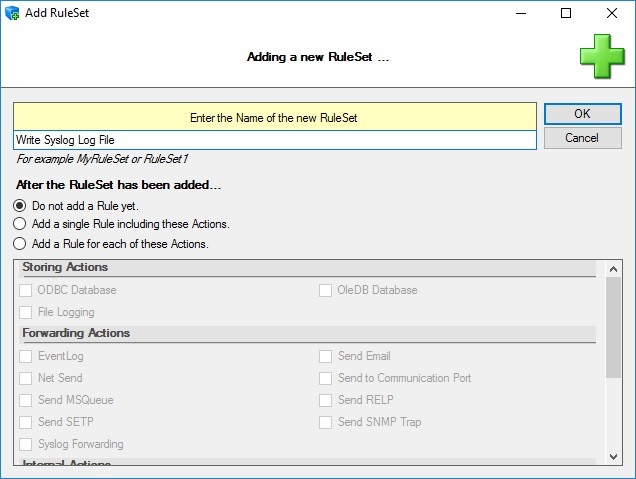
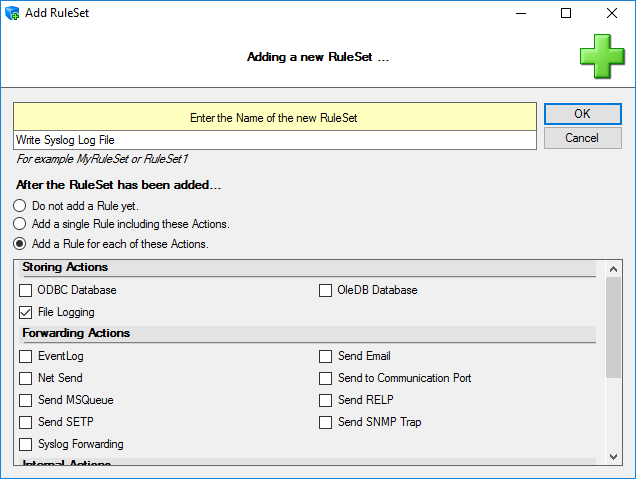
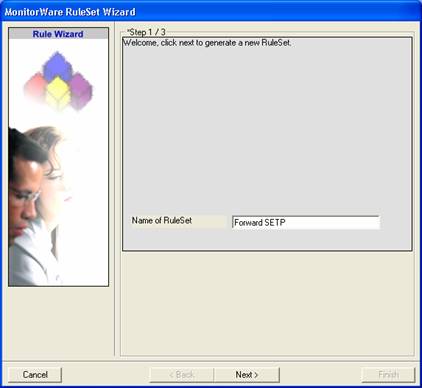
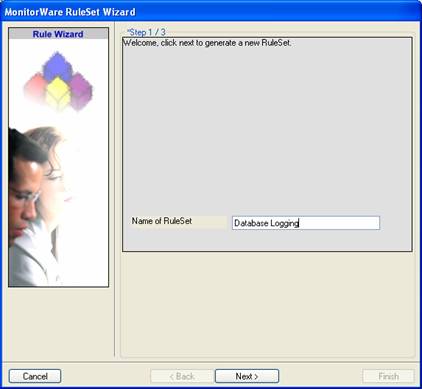
Choose “Add Ruleset”. The ruleset wizard will open. On this first screen, we can choose the name of the ruleset.
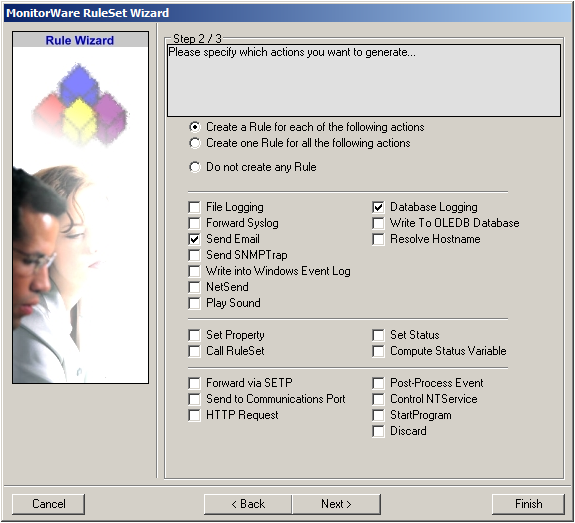
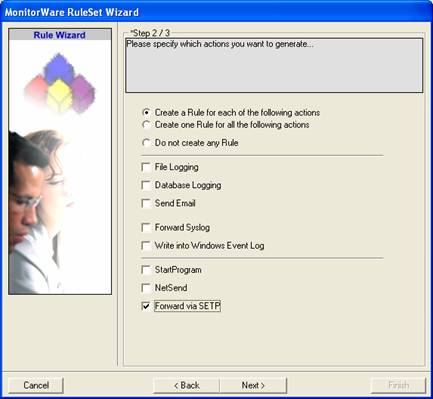
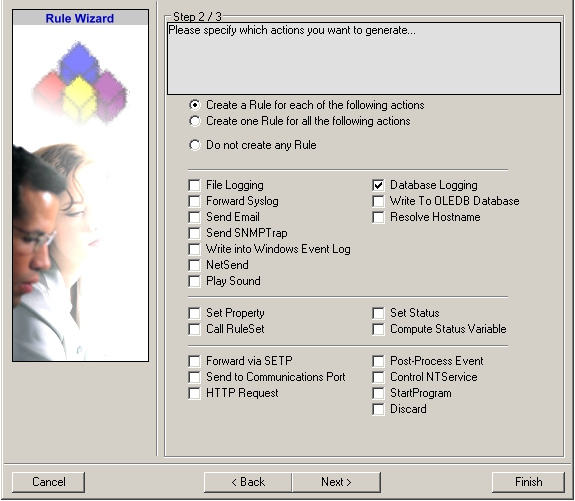
After choosing a name (in this example “Storage & Alert”), click on “Next”. Here we can set, what we will need. Leave the marker for “Create a Rule for each of the following actions” and choose “Send Email” and “Database Logging”.
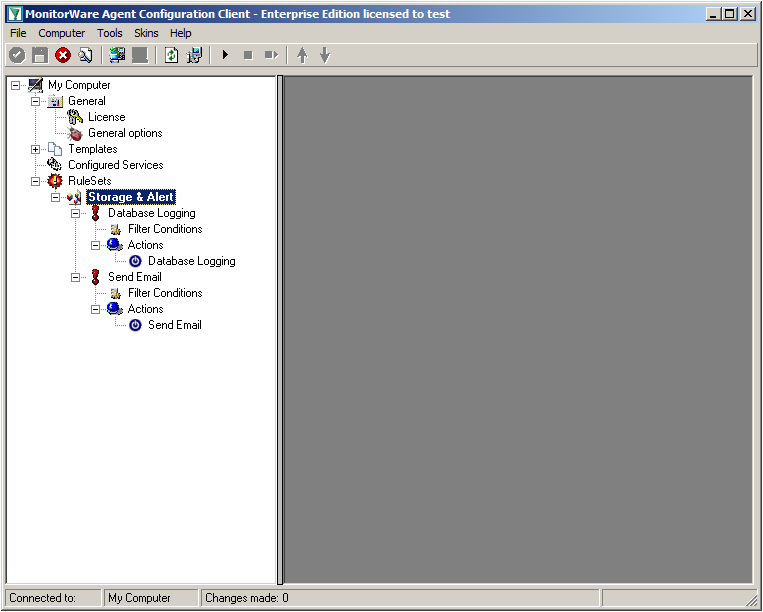
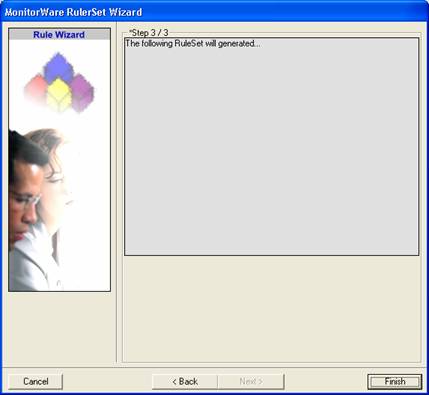
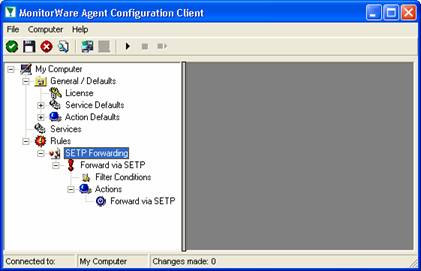
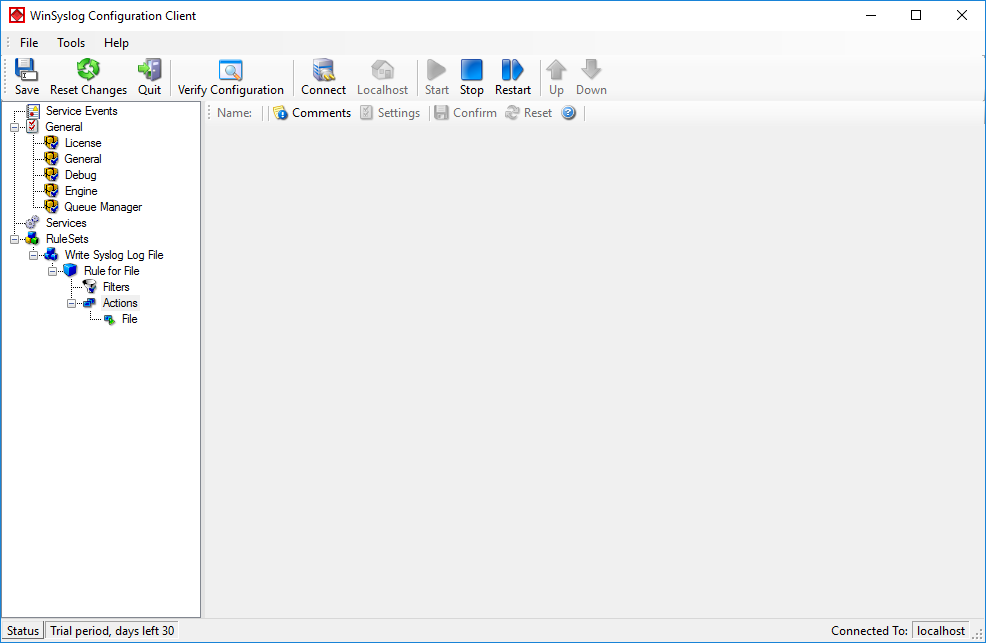
You can now click on Finish. You will now see a new ruleset in the treeview on the left hand side. If you expand this view completely, you can see the two rules that have been created and the actions that are in there. You should have a rule “Database Logging” and a rule “Send Email”.
Step 1.2
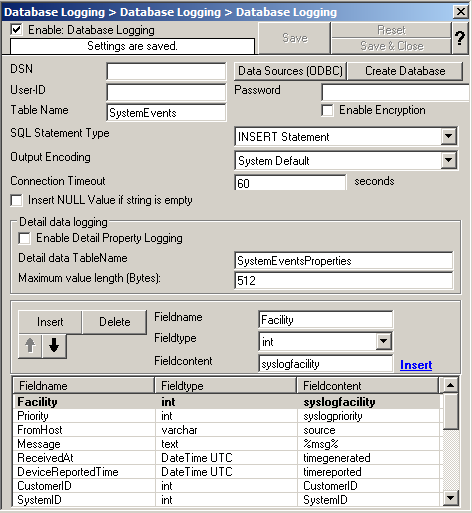
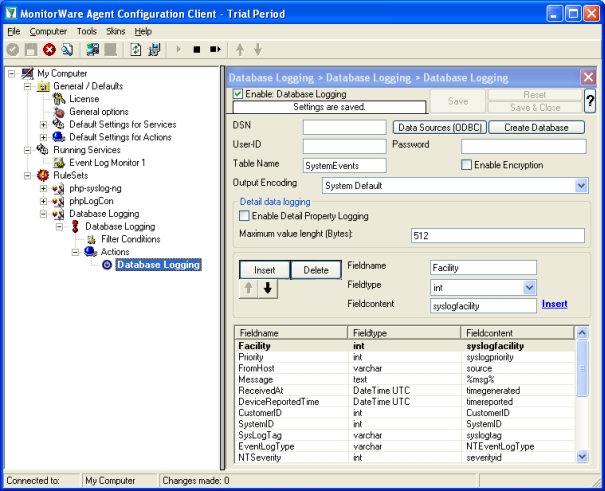
We will now start with configuring the action for “Database Logging”. Expand the branch called “Database Logging” completely. Under actions you will find the “Database Logging” action. When you click it, you will see the configuration window.
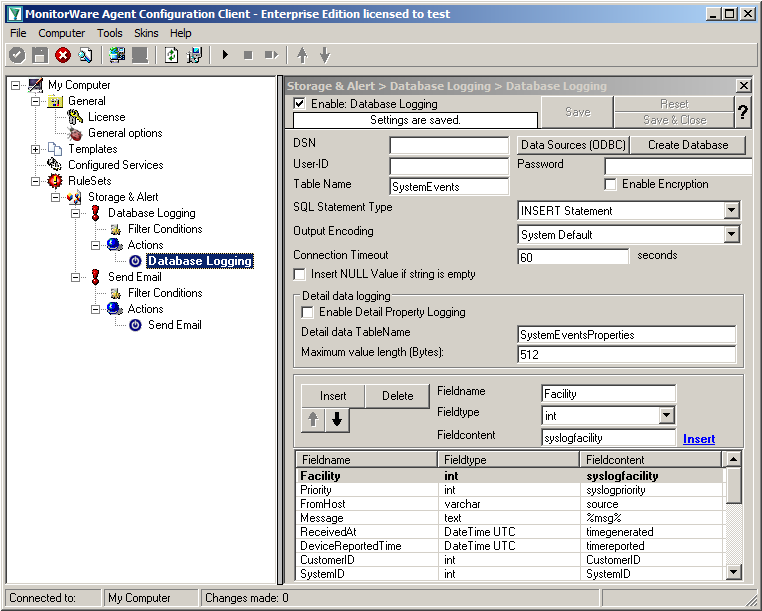
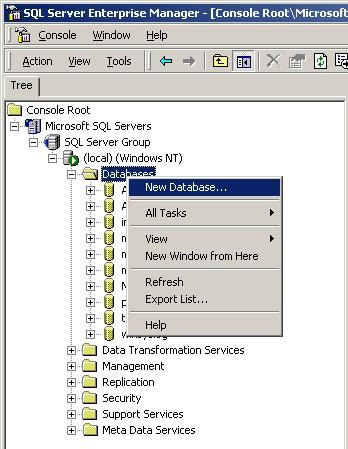
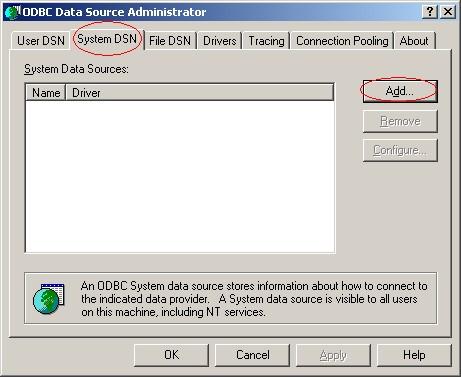
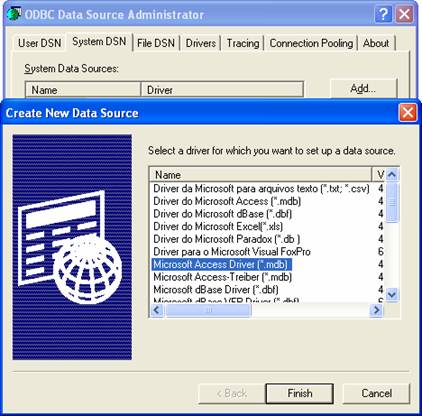
Click on the button “Data Source (ODBC)”. This will open the ODBC Data Source Administrator.
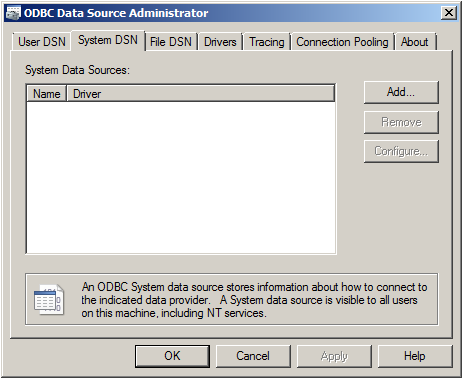
Go to System DSN and click “Add…”.
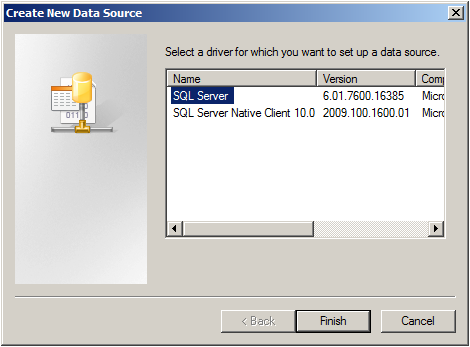
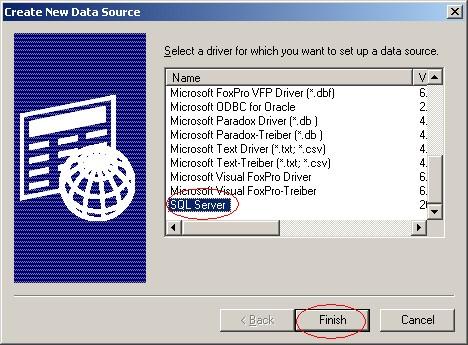
Select SQL Server from the list and click “Finish”.
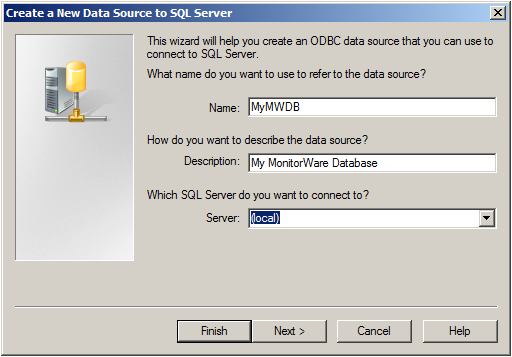
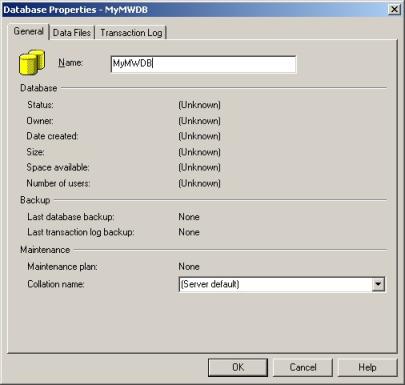
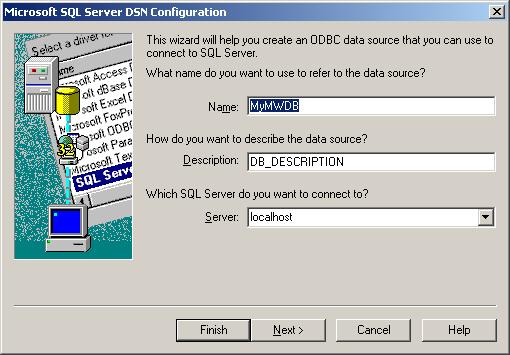
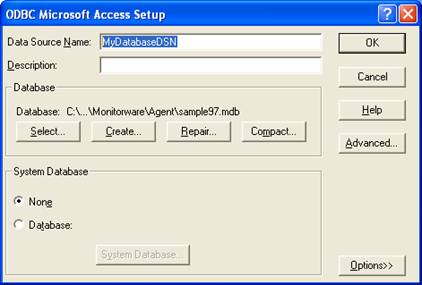
Choose a name for the datasource and a description. In this case we choose MyMWDB as name. As server choose the name of the server where the database is. In our example we use localhost. Now click on “Next”.
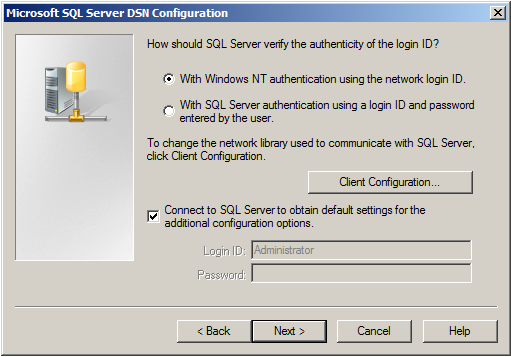
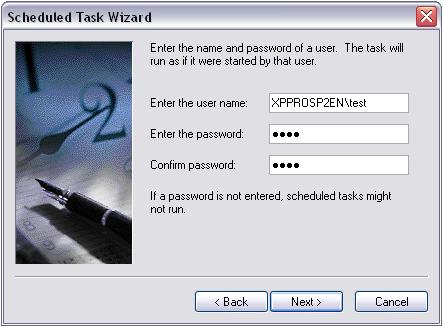
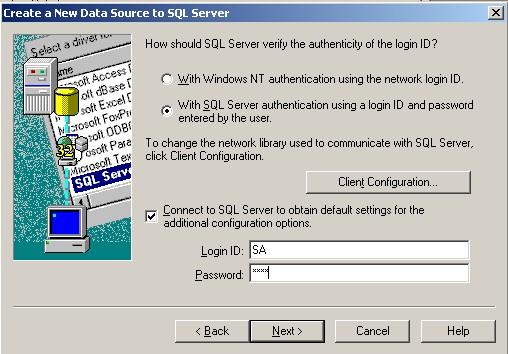
Select “SQL Server Authentication” and type in your MSSQL Login ID and Password. If you have Windows NT authentication like in our case, leave it as is. Click on “Next”.
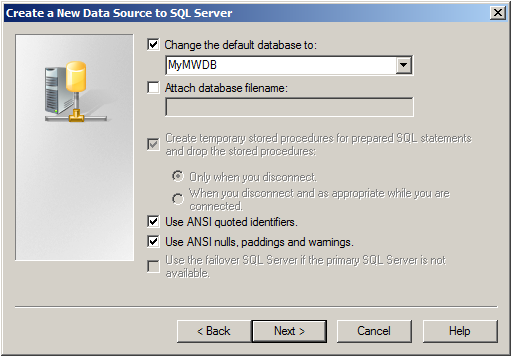
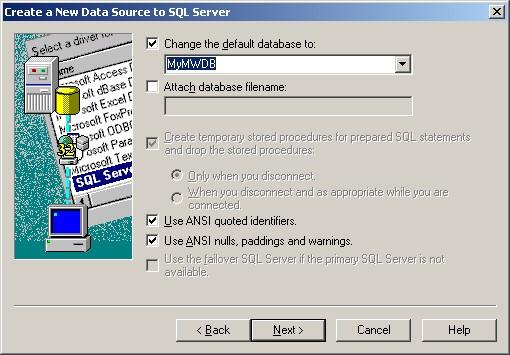
Select “Change the default Database to:” and choose your new created Database, in our example we use “MyMWDB” which we created beforehand. Click on “Next”.
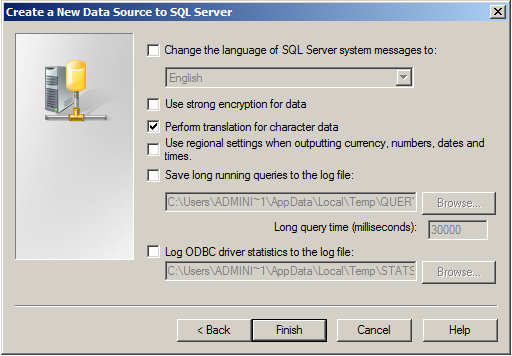
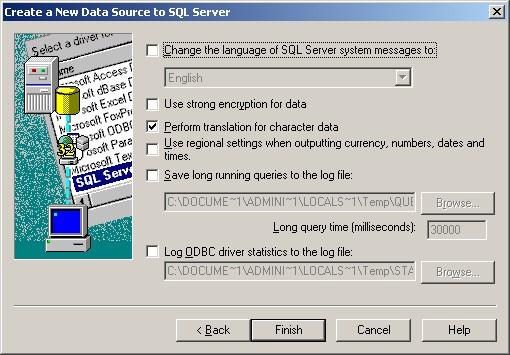
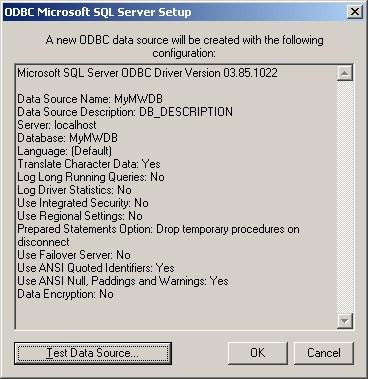
Leave all at default settings and click “Finish”, a test Window will appear:
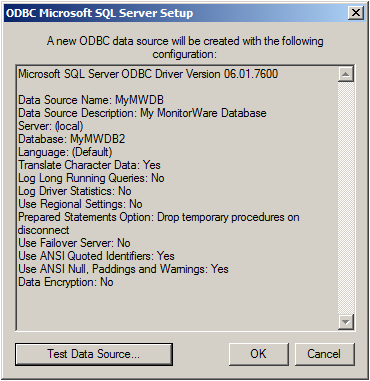
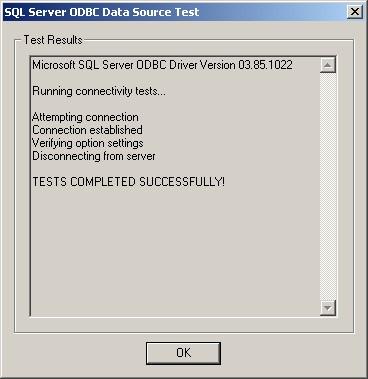
Click on “Test Data Source”, normally the following Window should be displayed:
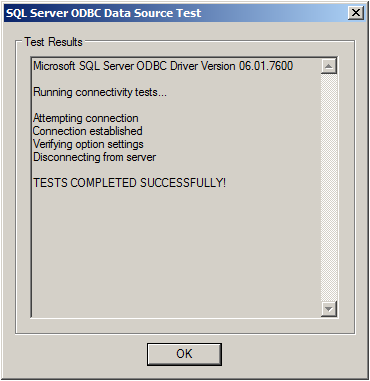
If not, go back and check your Settings, if yes, Click “OK” and exit the System-DSN Wizard.
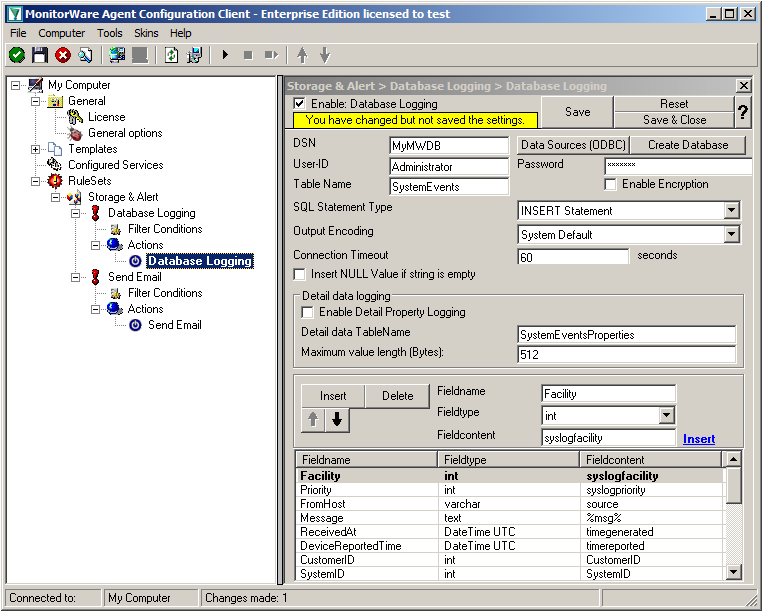
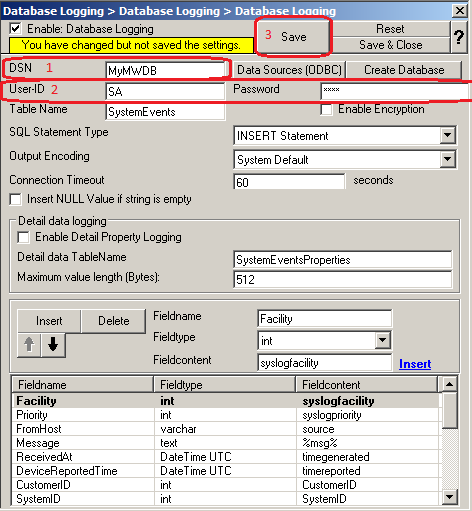
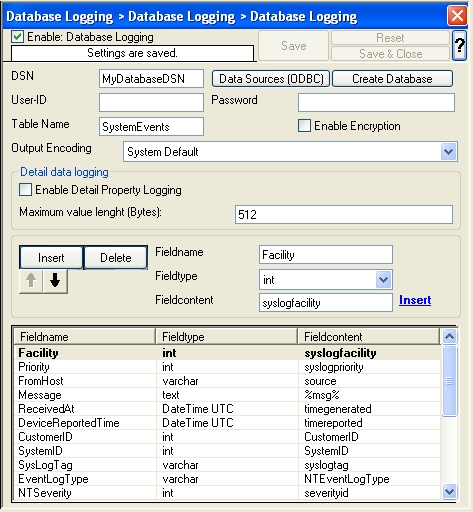
Now we are back in MonitorWare Agent. Insert the DSN for your database, User-ID and Password.
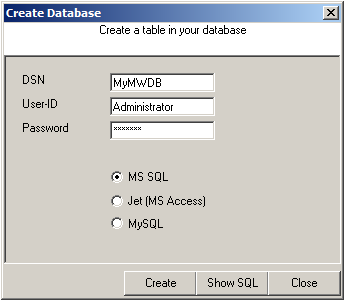
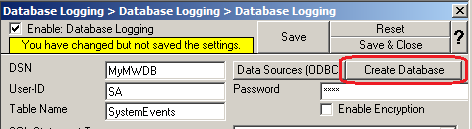
After that, click the “Create Database” button. We still need the tables that the log messages will be stored in. After clicking the button, a small window will open. Insert the DSN, User-ID, Password and choose the type of database you are using, in our case MS SQL. By clicking on the “Create” Button, the tables needed for the default database format of the MonitorWare Products will be created. After that, close the window.
Since we want to log all messages into the database, there is no need to set up any filters.
Step 1.3
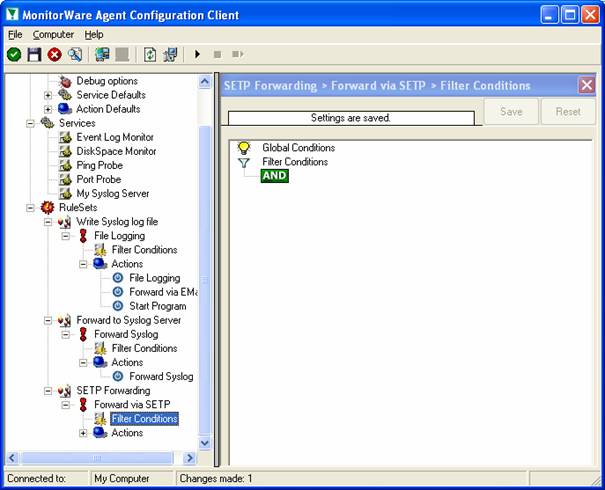
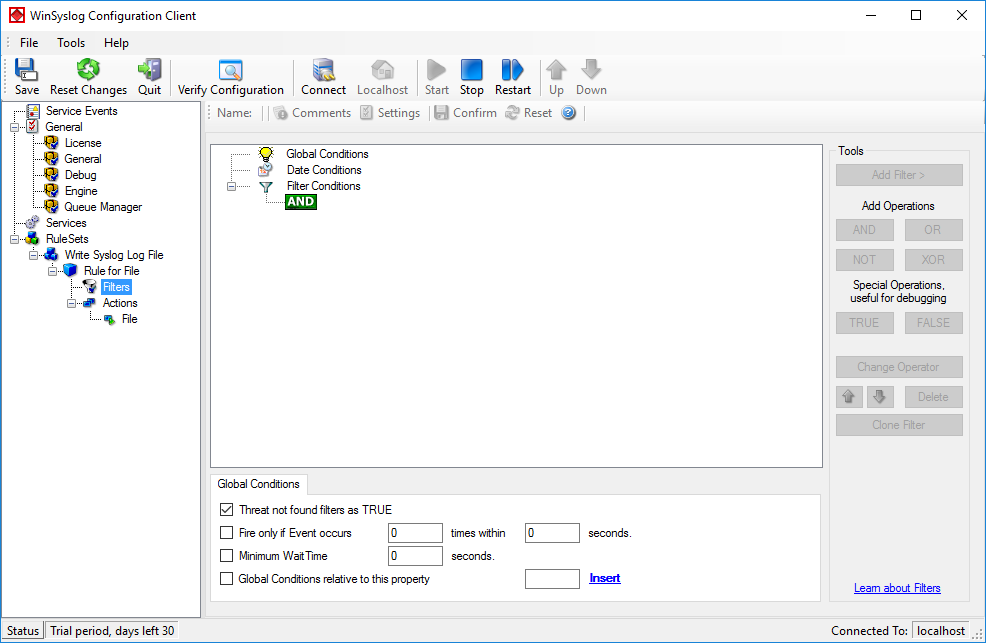
In the next step, we want to set up the Send Email rule. But since we only want error log messages, we need to set some filters. Click on the Filter Conditions. You will see the overview over the filters for this rule.
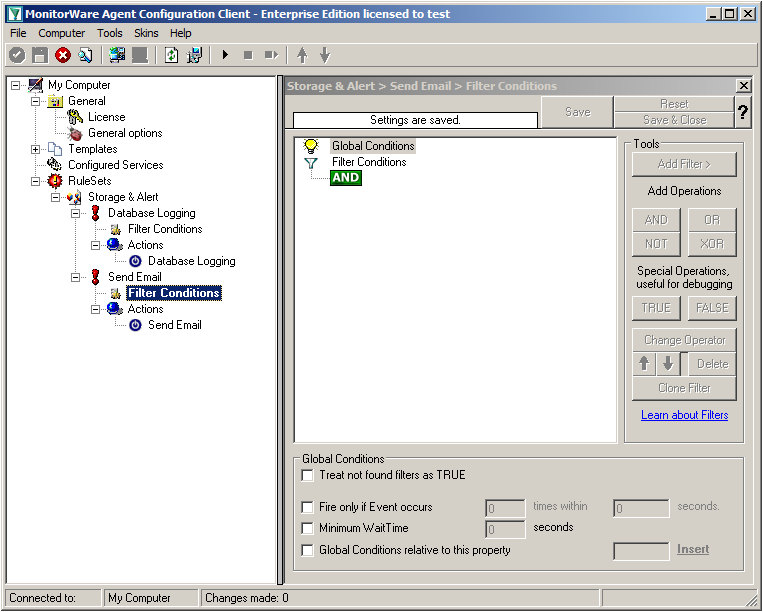
Right now, the view is empty except for a AND operator. Double-click it to change it into a OR operator.
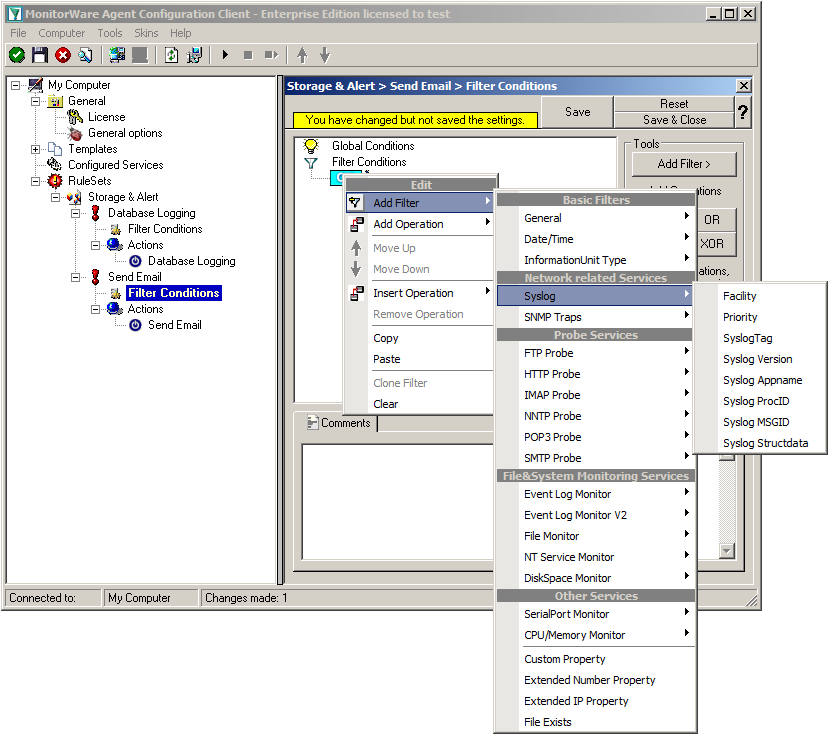
Right-click on the OR operator. A context menu will open. Go to Add Filter -> Syslog -> Priority.
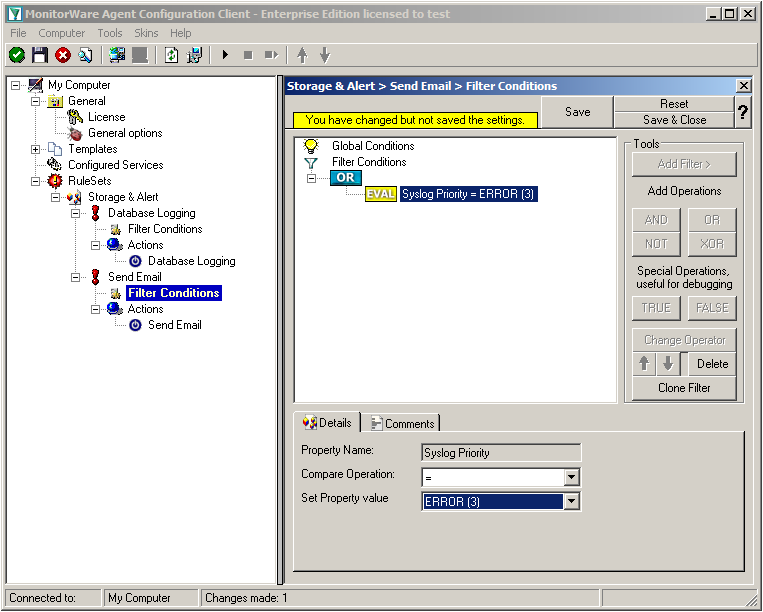
Click on the filter setting and change the property value to “Error (3)”.
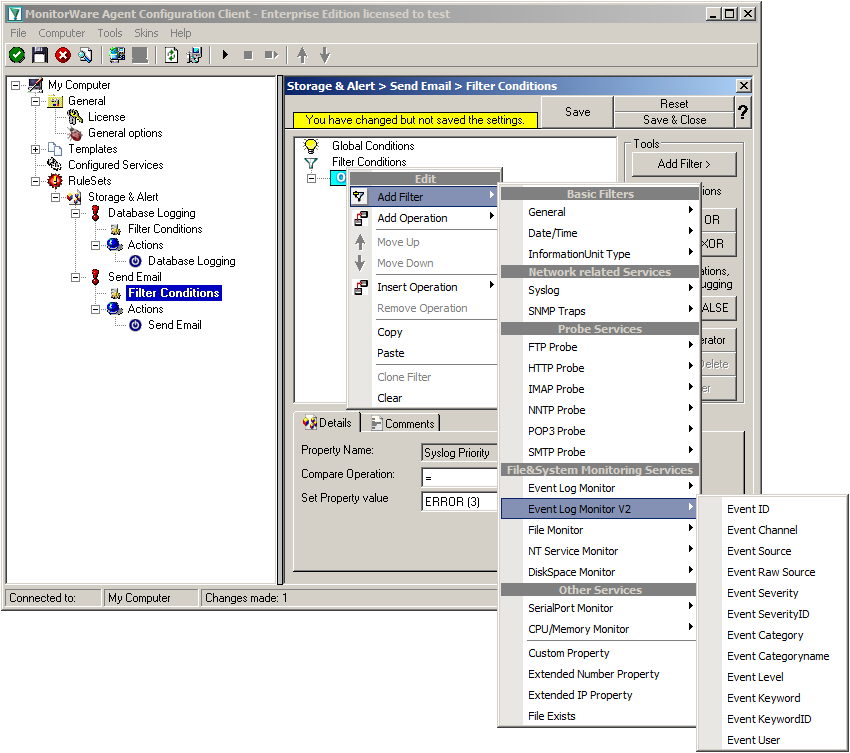
Again click on Add Filter -> EventLog Monitor V2 -> Event Severity.
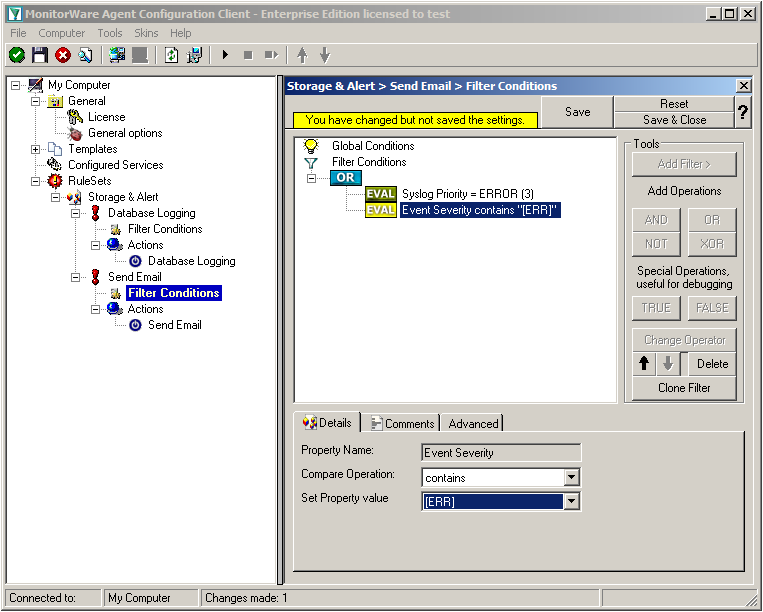
Click on the second filter setting and change the property value to “[ERR]”.
We are now finished with the filter settings. The filter will accept all log messages that are either of syslog proiority error or critical or Windows Event severity error. The OR operator ensures, that every of these cases will be accepted. When the messages are approved of fitting into the filter, the action will process them.
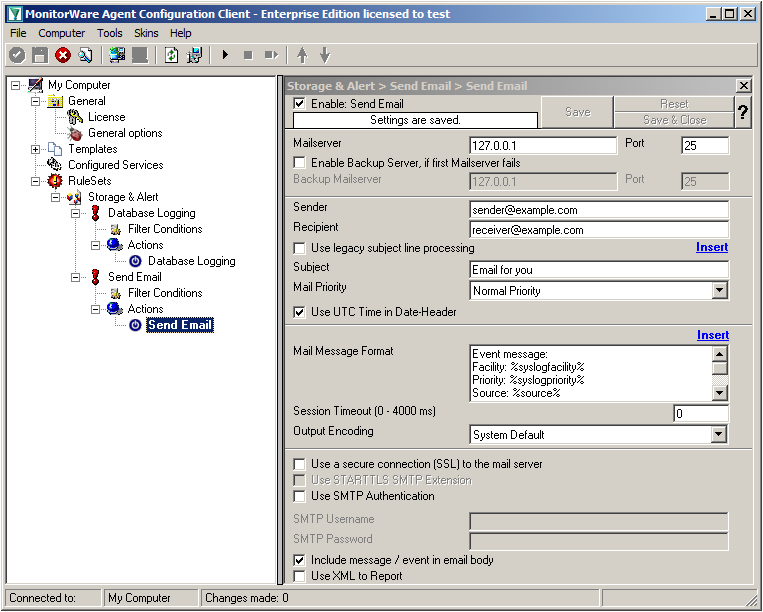
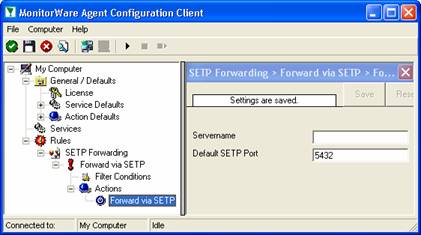
Click on the “Send Email” action now. You will see the configuration window on the right pane. Currently, there are only the default values in there.
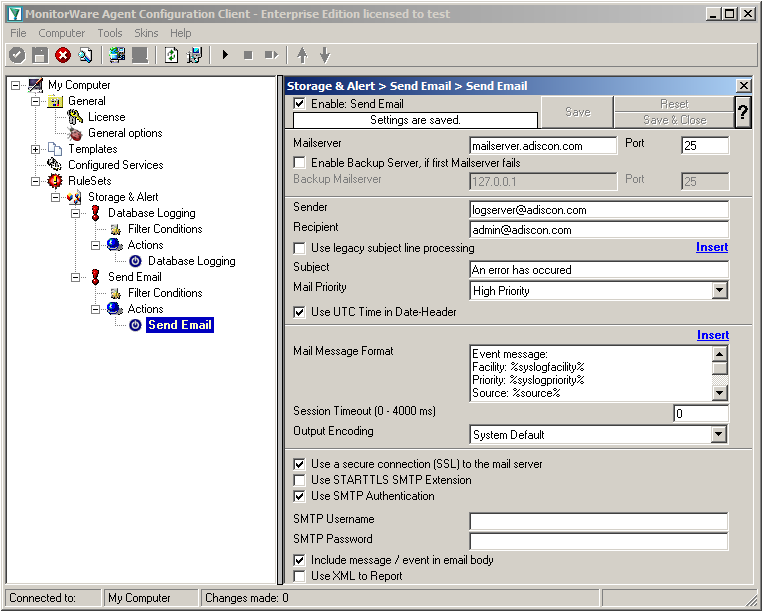
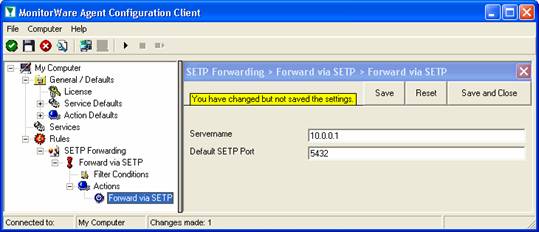
We need to change some settings here, like the Mailserver, Sender and Recipient, the subject and the Mail Priority. If necessary for your mail server, you need to change the authentification settings at the bottom as well. in our example we need SMTP Authentication for that. If you want, you could even enable the backup mail server.
Now we have all actions fully configured. It is now time to setup the configured services.
Step 1.4
Currently, when clicking on Configured Services you will not see a thing. But we will configure the services now. Without them, MonitorWare Agent is not able to get any log messages. We will setup 2 Syslog Receiver, 1 EventLog Monitor and 1 File Monitor.
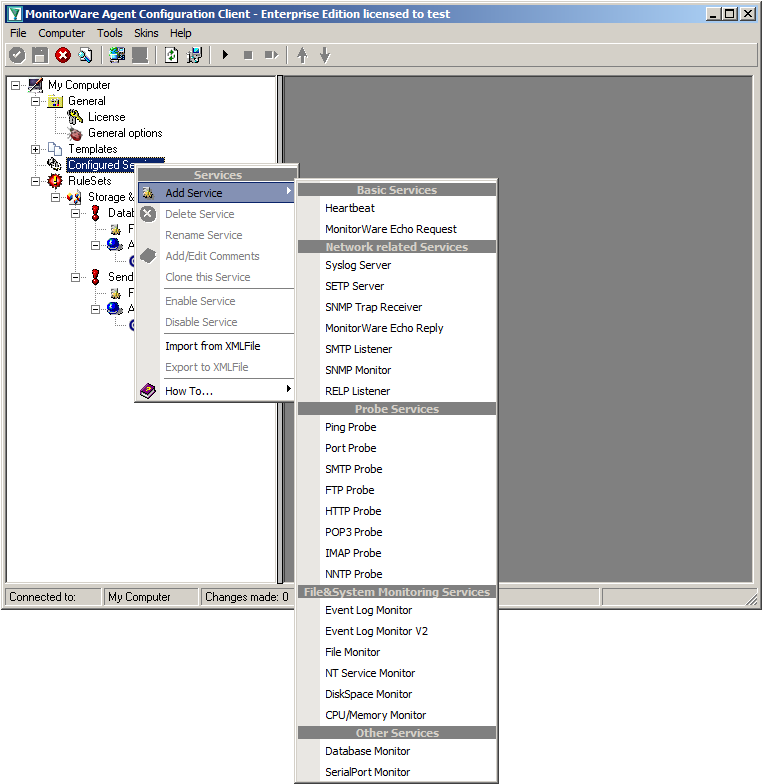
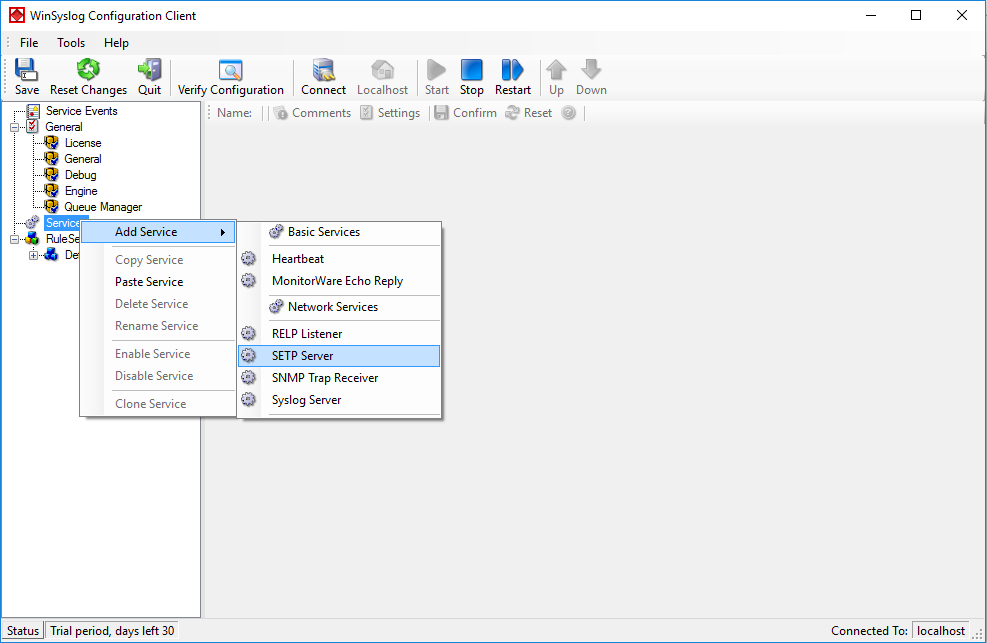
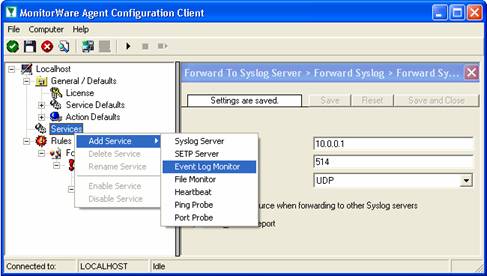
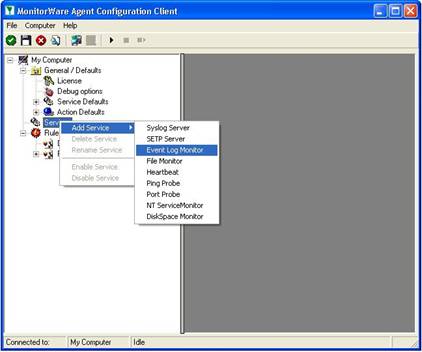
When right clicking on Configured Services a context-menu will open. By moving your cursor to “Add Service” you can see a list of Services, that may be configured. The list seems pretty long, but we basically need 3 services of them.
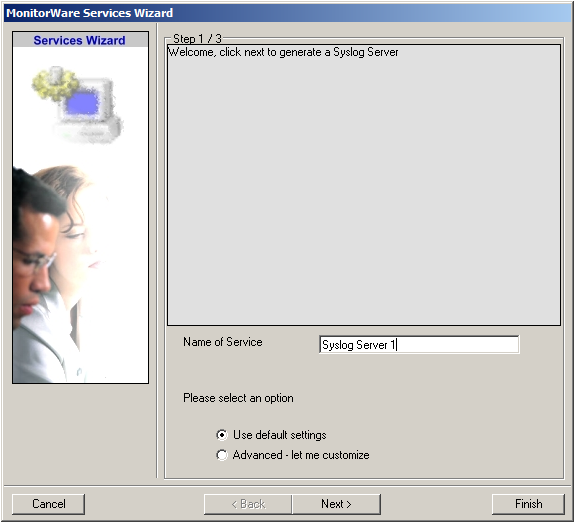
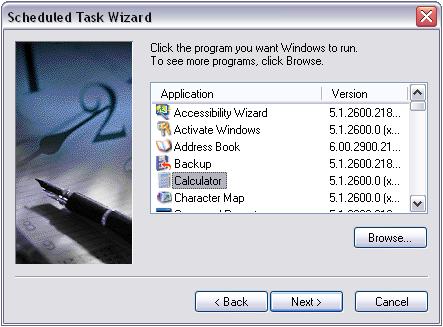
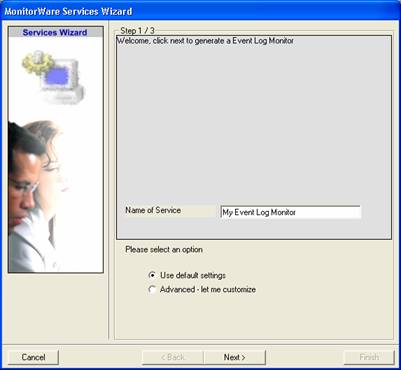
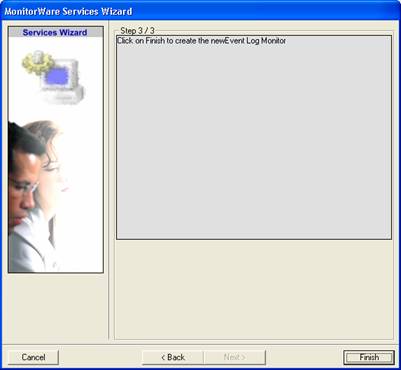
Click on “Syslog Server” first. The Services Wizard will open. Simply click on Finish for now. Repeat this again for Syslog Server, EventLogMonitor V2 and File Monitor.
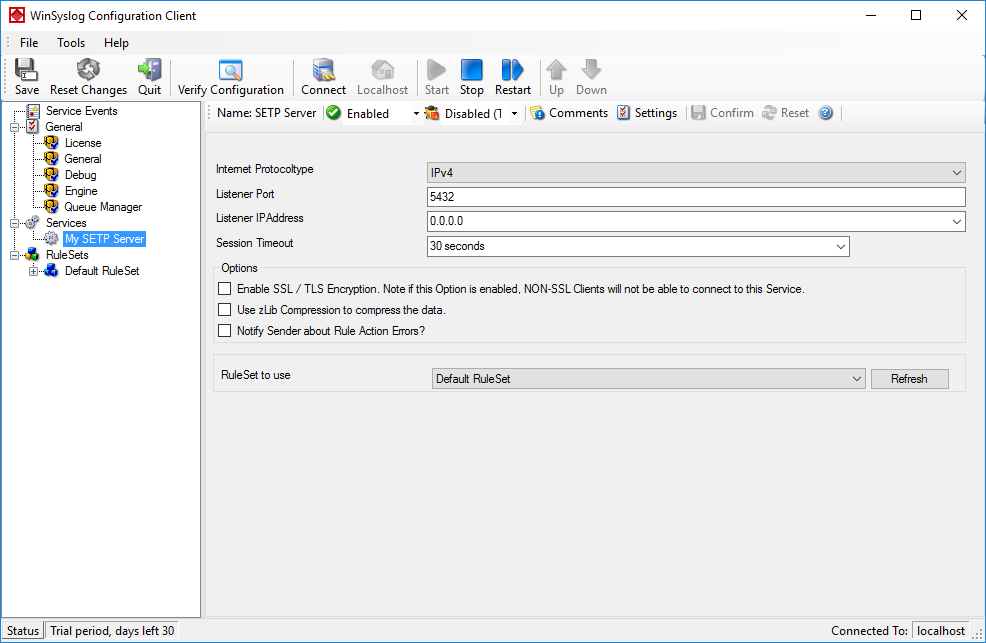
In the end, you should have a list with 4 Services. For our example I renamed the services by doing a right-click on the Service name I wanted to change and the choosing “Rename Service”. This was mostly to distinct the two Syslog Servers.
Step 1.5
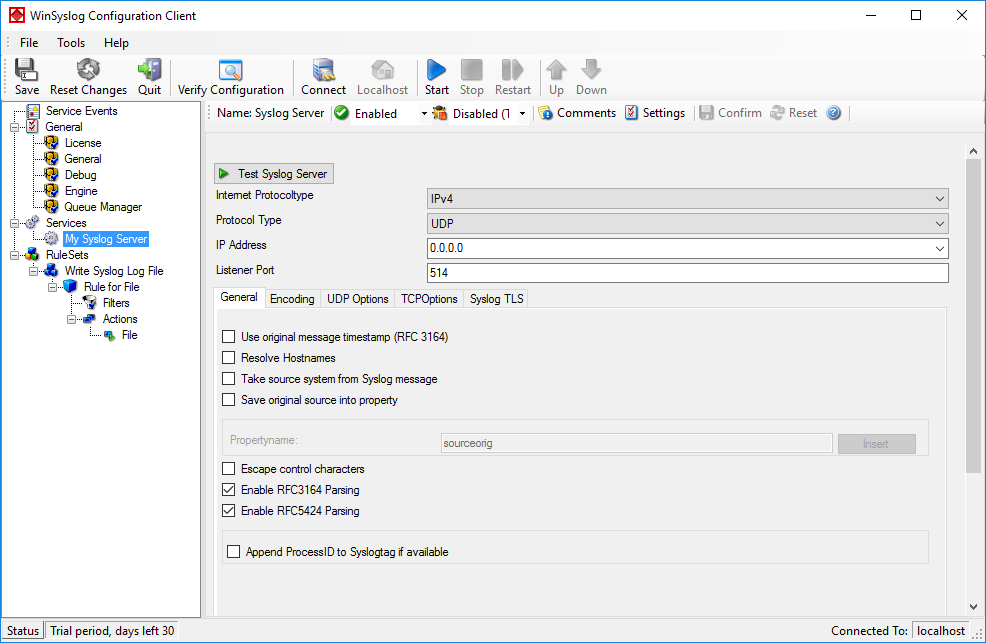
Settings for Syslog Server UDP
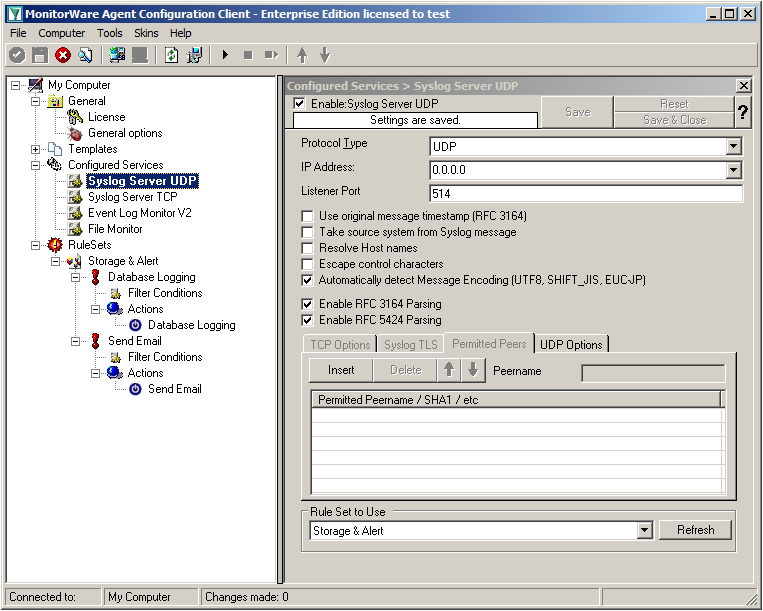
We can leave the “Syslog Server UDP” on default settings. It is already listening to UDP on port 514. The rest of the default settings is just fine.
Step 1.6
Settings for Syslog Server TCP
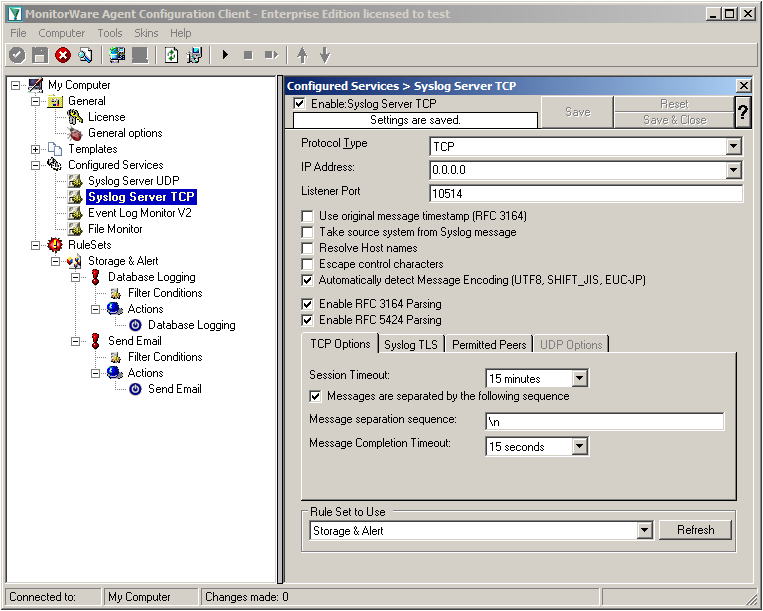
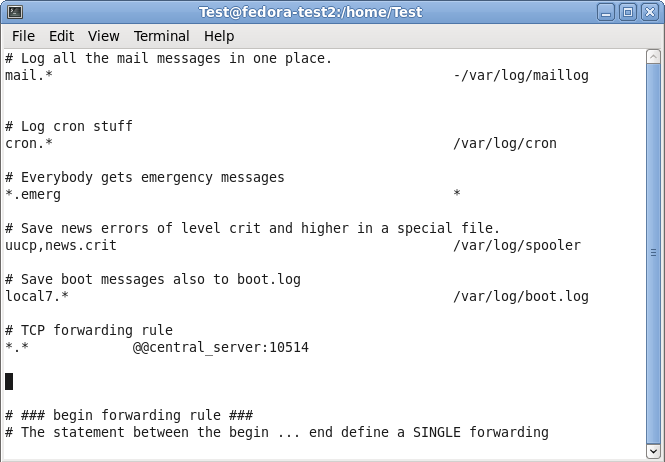
We will now go to the “Syslog Server TCP” now. Here we need to change several settings. Change the protocol type to TCP and the Listener Port to 10514. Further, we need to enable the option “Messages are separated by the following sequence” in the TCP options. It should look like this now:
Step 1.7
Settings for Event Log Monitor V2
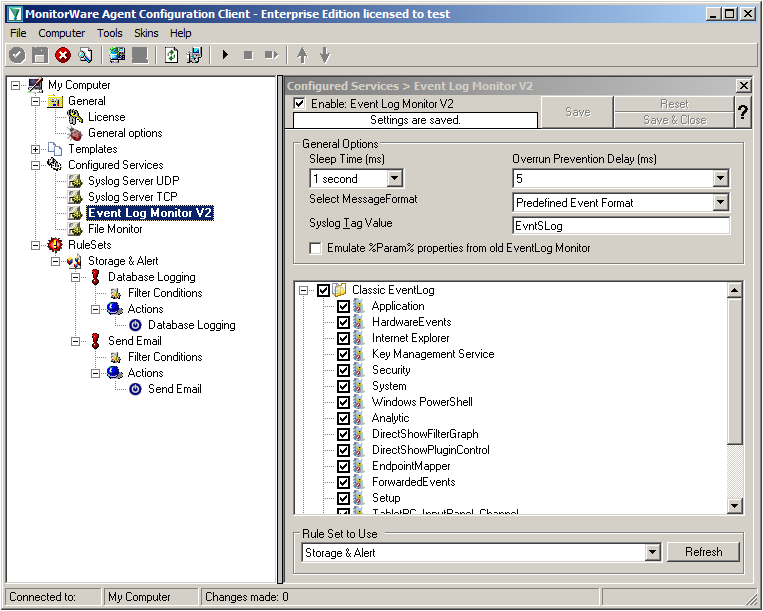
The Event Log Monitor V2 needs no additional setup. Again the default values are ok. If you want specific Event categories not to be stored, you can disable the options. But the basic format is sufficient.
Step 1.8
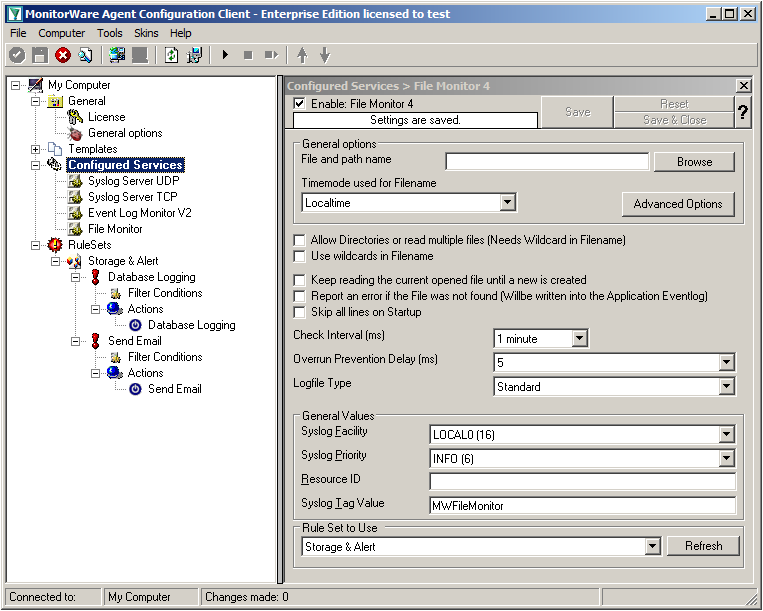
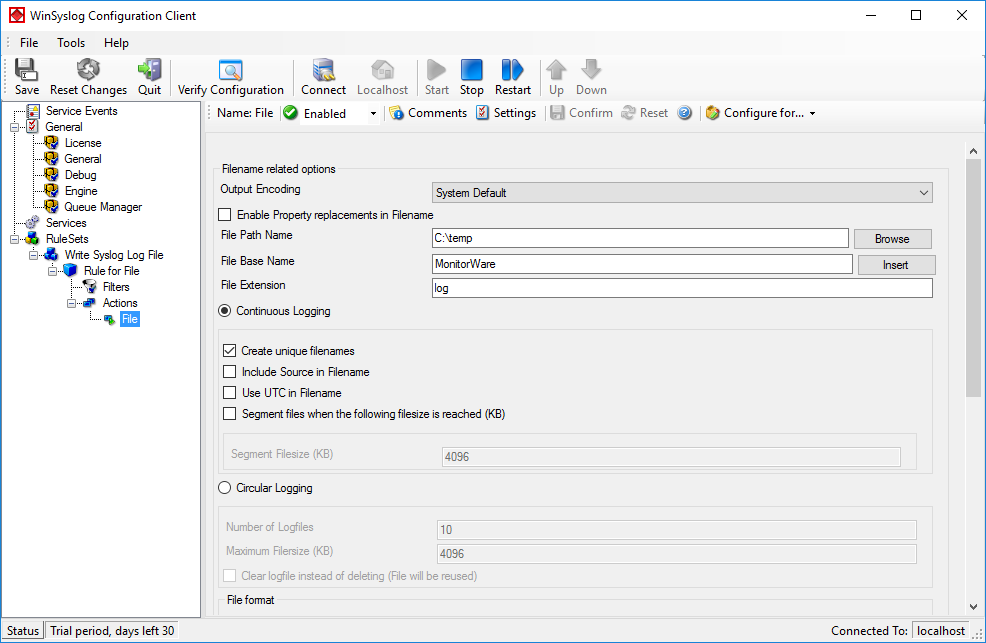
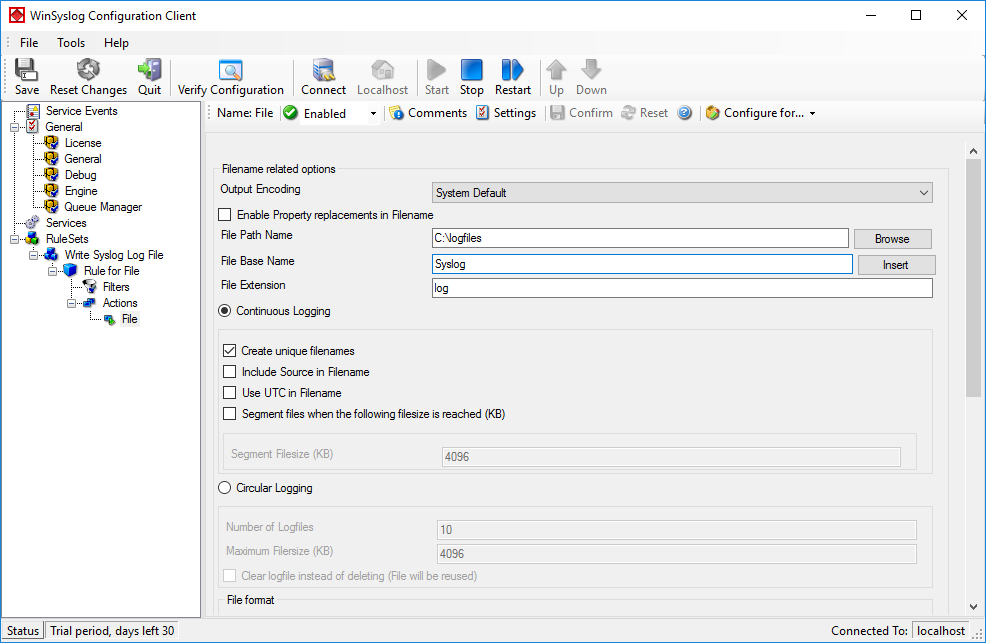
Settings for File Monitor
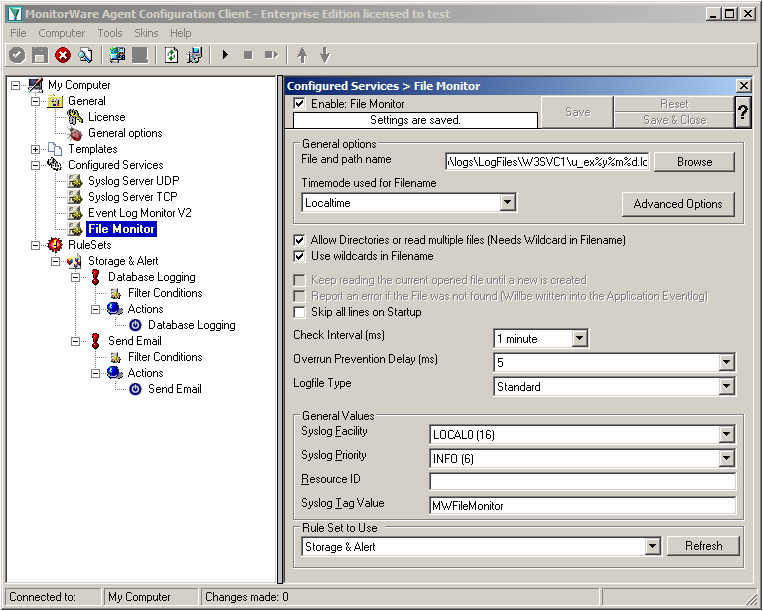
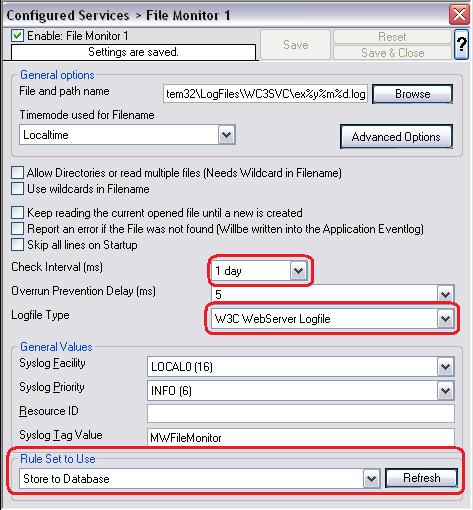
The File Monitor needs some additional settings. First, enable the option “Allow Directories or read multiple files”. You will see, that the use of wildcards will be automatically enabled and some other options completely being disabled.
Then we need to set the source files. For our example, we want to monitor the IIS logfiles. At the top of the File Monitor configuration you can see the option “File and path name”. There is a Browse button right next to it. Click it.
A windows explorer window will open, where you can choose the file you want to monitor. Navigate to the path C:\inetpub\logs\LogFiles\W3SVC1\. This is the location where the log files are stored. Please note, that the file location could be different when using another version of IIS. Choose the first file in the list. (Note: Daily Internet Information Server log files are named “u_exyymmdd.log”, with yy being the 2 digit year, mm the month and dd the day of month. To generate the same name with file monitor, use the following name “u_ex%y%m%d.log”.)
Set the Logfile Type to “W3C WebServer Logfile”.
Please note, that this step can be easily adapted for other log files (e.g. DHCP log files) as well.
Step 1 Finished
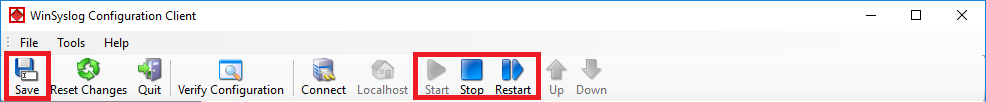
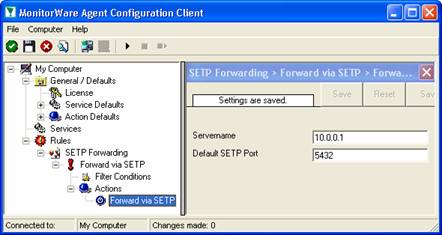
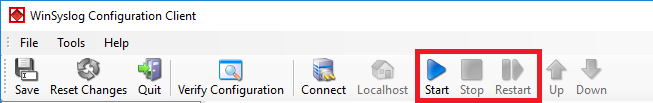
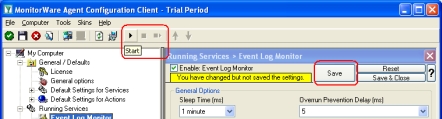
We have now finished the configuration for our central server. It will now be able to receive syslog either via TCP (port 10514) or UDP (port 514), monitor the local Event Log as well as the IIS logfiles. Once more click the “Save” button to save the configuration (if not done already) and start the service. All log messages will now be stored into the database as they arrive/occur. Further, administrators will be alerted via email once an error occurs.
<< Go back to the main page


 Click “Next”. A new wizard page appears.
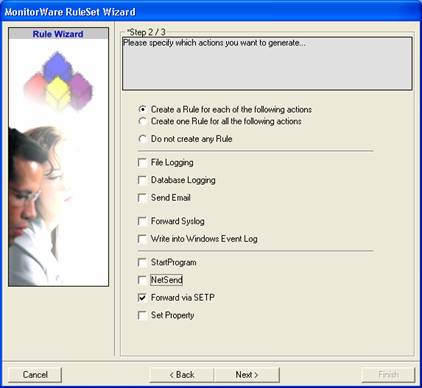
 Click “Next”. A new wizard page appears.
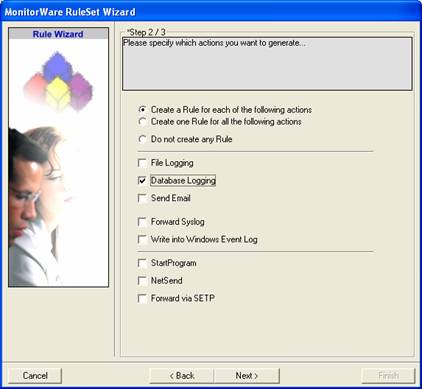
 Once you have done so, a new wizard starts.
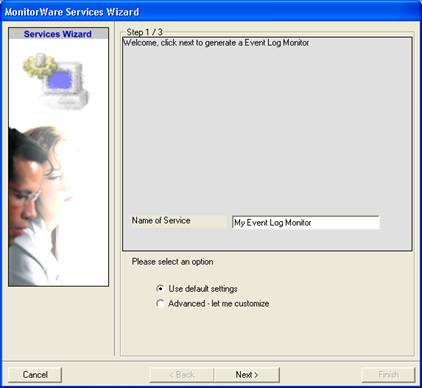
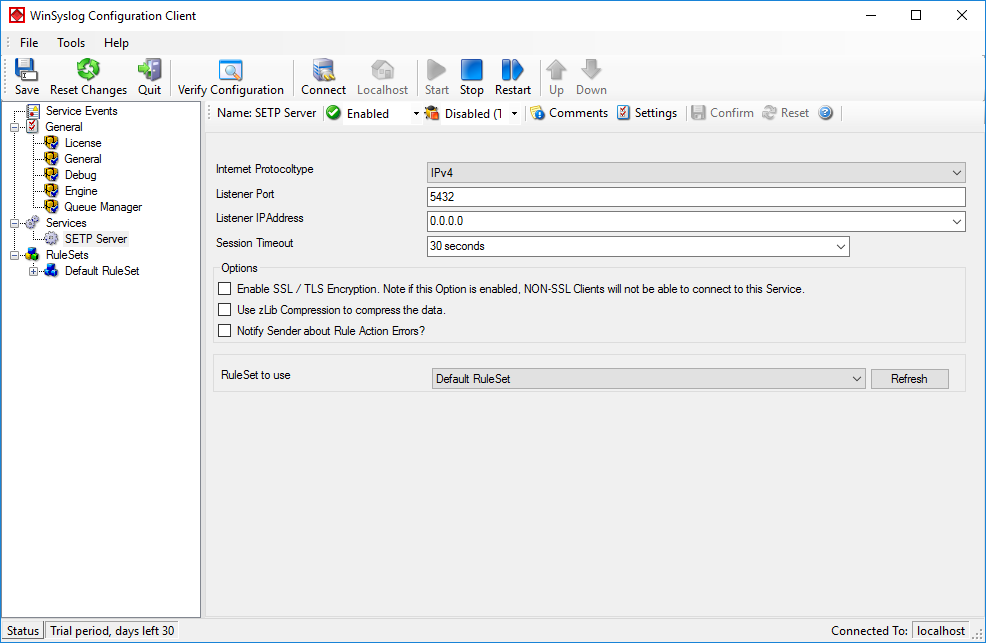
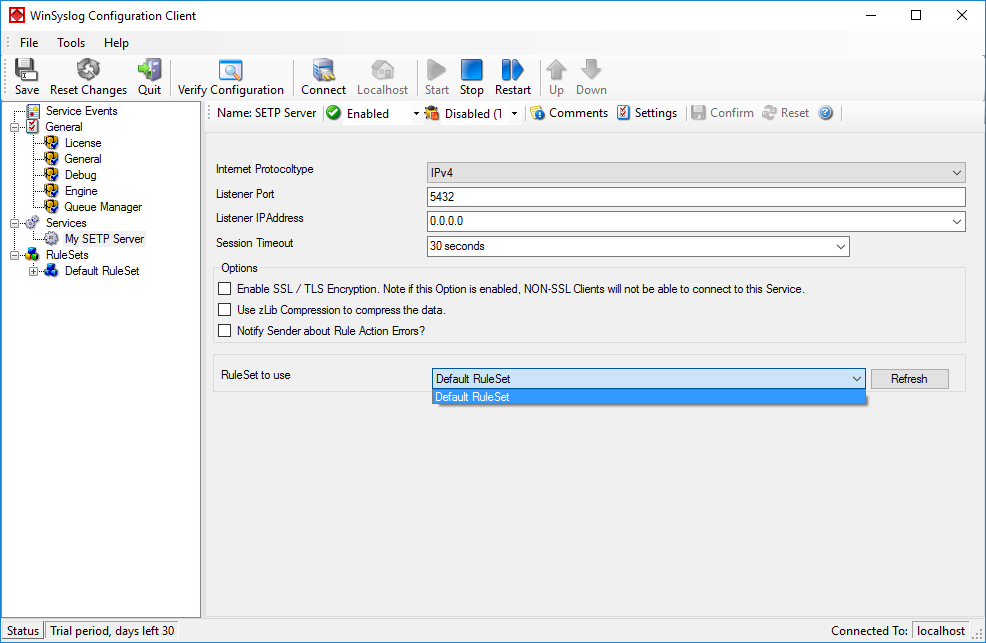
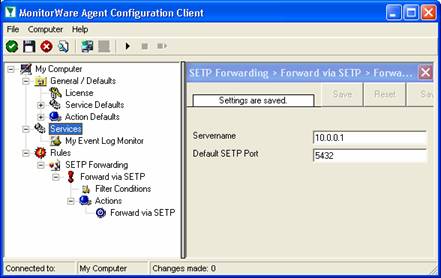
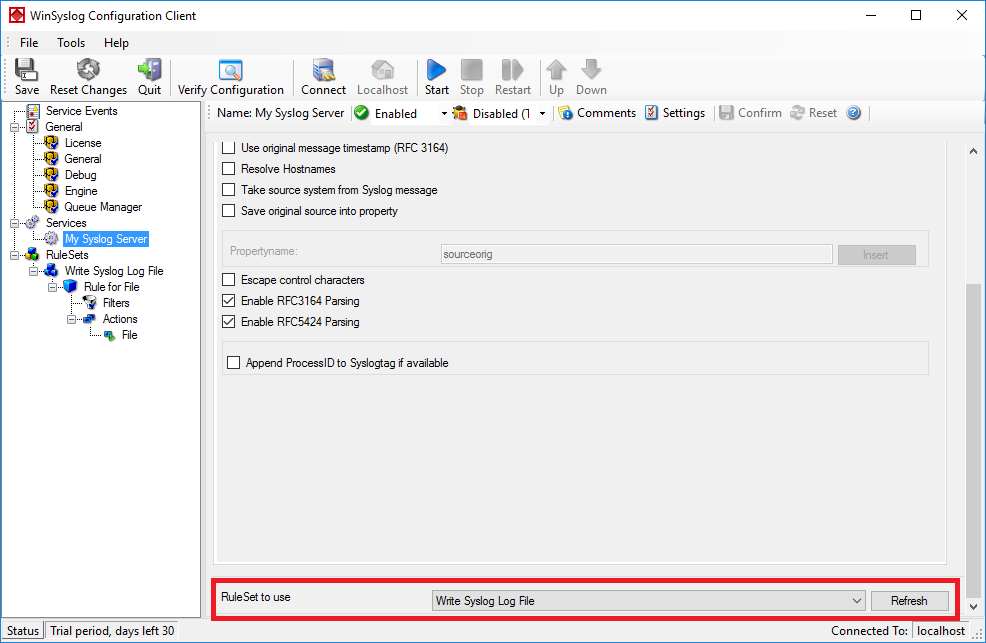
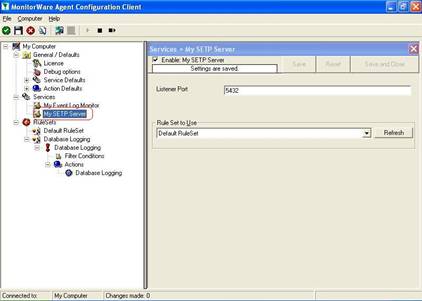
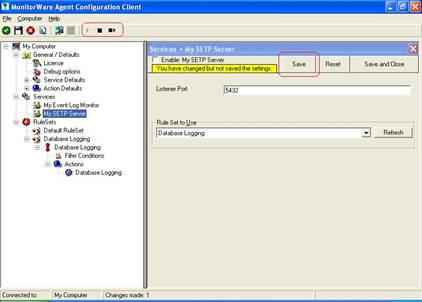
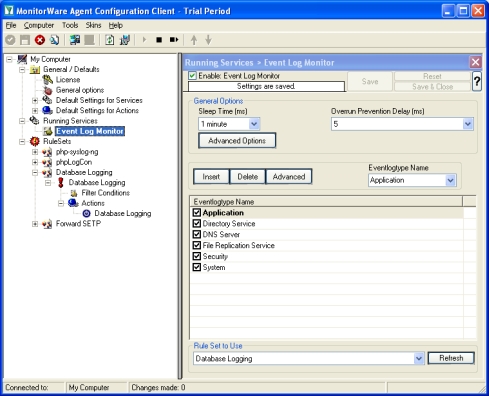 As you can see, the service has been created with the default parameters.Please note that the “Default RuleSet” has been automatically assigned as the rule set to use. By default, the wizard will always assign the first rule set visible in the tree view to new services. In our case, this is not correct and will be corrected soon.
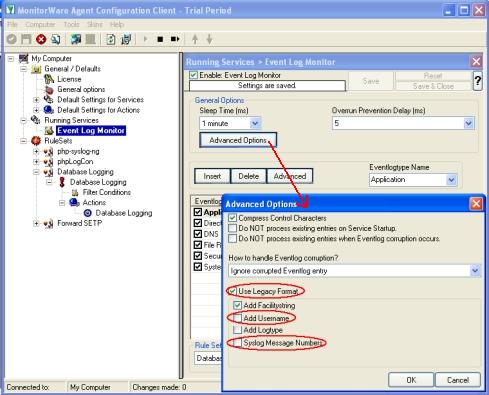
 Central hub server:
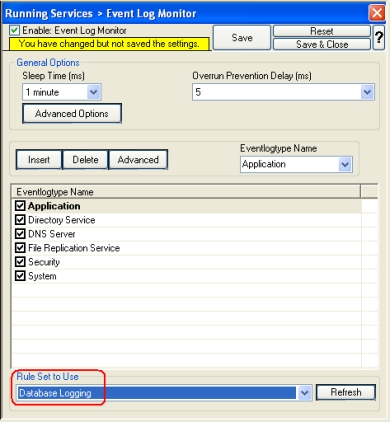
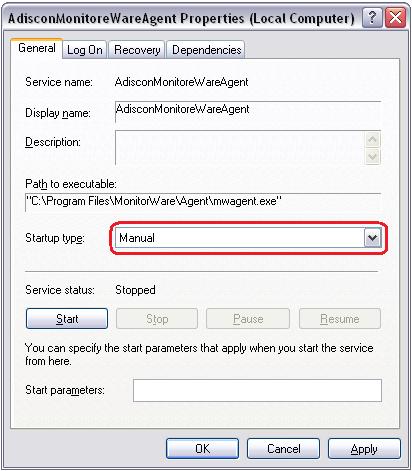
 MonitorWare Agent cannot dynamically read changed configurations. As such, it needs to be restarted after such changes. In our sample, the service was not yet started, so we simply need to start it. If it already runs, you need to restart it.
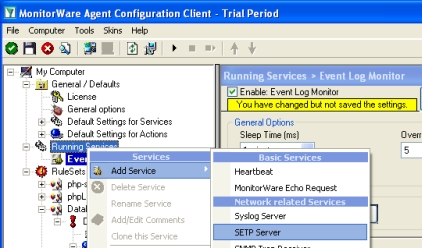 Once you have done so, a new wizard starts.
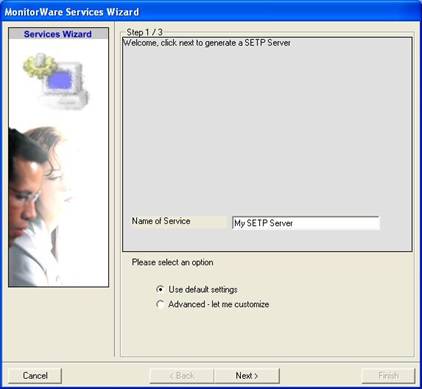
 As you can see, the service has been created with the default parameters.
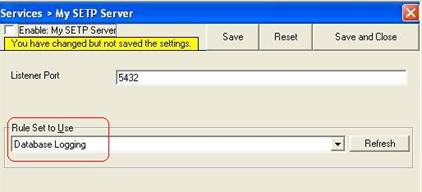
 MonitorWare Agent cannot dynamically read changed configurations. As such, it needs to be restarted after such changes.
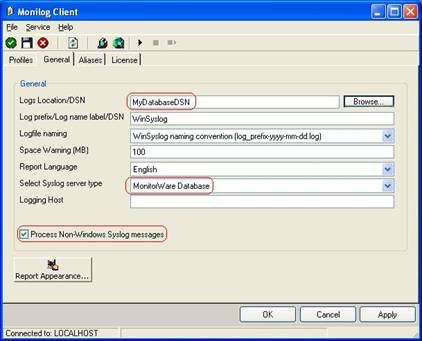 Click “Apply” after making your changes!
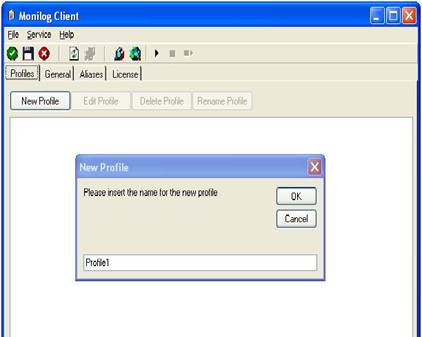 Click the “OK” button to create a new profile.
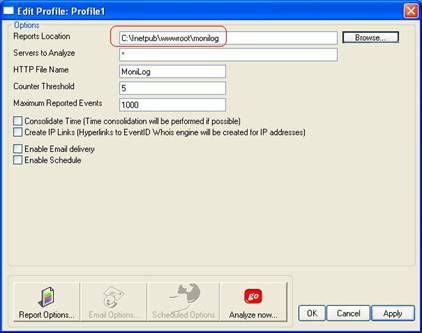 Click “Apply” to save your changes!
 Click on “OK” to close the windows by using default options.
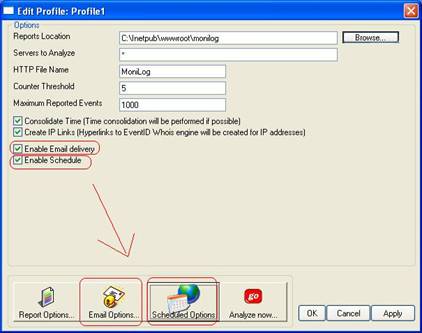 The “Email Options” and “Scheduled Options” become colored and are now available.
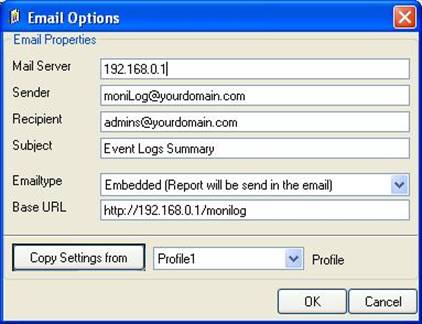 Important: make sure the values match your configuration! This is vitally important because otherwise MoniLog is incapable of sending email correctly. Click “OK” to apply the new settings.
 Click “OK” to apply the setting.
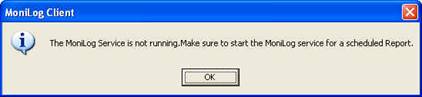 This tells you that the MoniLog service has not yet been started. The service generates the scheduled reports (so you don’t need to run the client in foreground). For now click “OK”. We’ll start the service in the next step. Please note that we now have fully configured reporting, but it will not occur because the service is not yet running.