Migrating the Rules from EventReporter to MonitorWare Agent

Migrating the Rules from EventReporter to MonitorWare Agent

Created 2003-07-22 by Wajih-ur-Rehman

How can I migrate the rules that I have defined in EventReporter to MonitorWare Agent?

This FAQ is only applicable to those who are using EventReporter 6.x and MonitorWare Agent 1.2 or higher. Follow the steps below:

  1. Click on Start and go to run. Type regedit.
  2. Browse to HKEY_LOCAL_MACHINE\SOFTWARE\Adiscon\EventReporter\RuleSets
  3. Export the above mentioned key and save it somewhere.
  4. Open the file created in the above step with notepad.
  5. Replace all occurances of EventReporter with MonitorWare\Agent. (Simply find and replace all from the Edit menu of notepad)
  6. Save the file and close it.
  7. Double click on this registry file.
  8. It will migrate all the rules from EventReporter to MonitorWare Agent and will also over-ride the previous rules defined for MonitorWare Agent.

How can I extend MonitorWare Database?

How can I extend MonitorWare Database?

Created 2003-10-21 by Wajih-ur-Rehman

How can I extend MonitorWare Database?

You can create new fields and tables by appending u- before the names. This way the names of your custom fields and tables will never conflict with our fields and table names respectively since we will never add a field or a table name starting with u- but as of now we don’t support these custom fields and custom tables with any of our products.

If you could post the answers to the following questions on support@adiscon.com, perhaps we would be able to add your requested feature in the next releases of our products:

  1. What exactly are you looking for?
  2. Why exactly do you want to extend the database?

Your input in this regard would be greatly appreciated.

2003-02-25 MonitorWare Agent 1.2

MonitorWare Agent 1.2

  • New Scaleable Filterengine -The new filter engine as very powerful, you can build complex filter conditions like known from Microsoft Network Monitor. A note for existing MonitorWare Agent Users. After update, you have to start the MWAgent Client first. This is important, because it will automatically import your existing filters into the new Filter system. If you are new to this kind of filtering, I recommend that you read the Filter Conditions part of the manual before you start to play with the filters. Continue reading “2003-02-25 MonitorWare Agent 1.2”

“A complete step by step guide on setting up EventLogMonitor Service

How To setup EventLogMonitor Service

Article created 2003-02-24 by Rainer Gerhards.
Last Updated 2005-08-16 by Timm Herget.


Note: This guide was initially written for MW Agent, but the steps are the same in EventReporter.

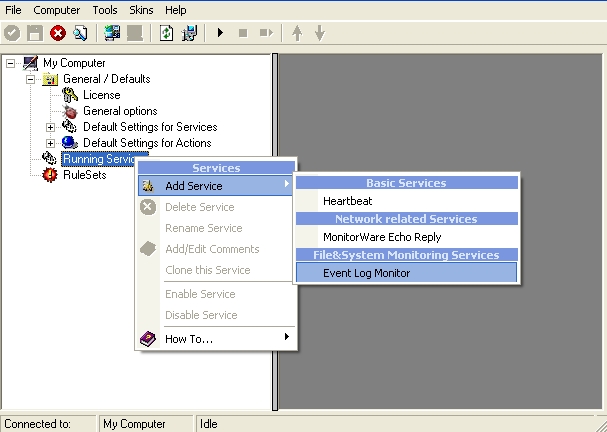
1. First, right click on “Services”, then select “Add Service” and then “Event
Log Monitor”:

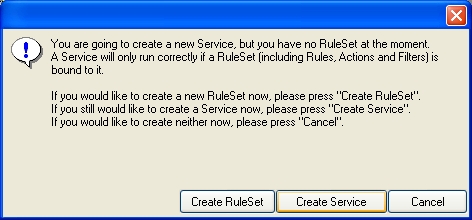
2. Once you have done so, a new wizard starts.

If the following Popup appears, please select “Create Service”:

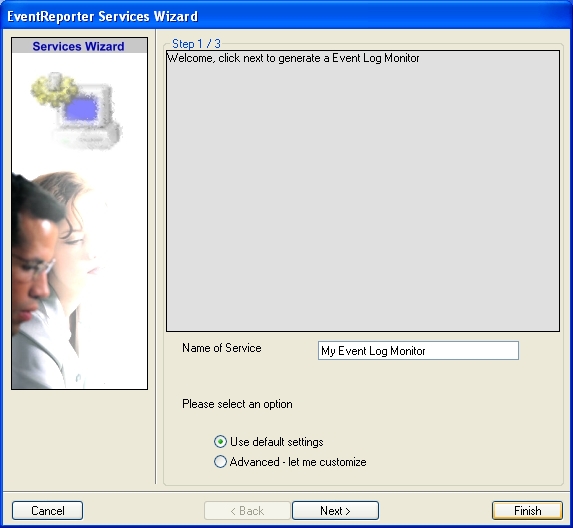
Again, you can use either the default name or any one you like. We will use
“My Event Log Monitor” in this sample. Leave the “Use default settings” selected
and press “Next”.

3. As we have used the default, the wizard will immediately proceed with step
3, the confirmation page. Press “Finish” to create the service. The wizard
completes and returns to the configuration client.

4. Now, you will see the newly created service beneath the “Services” part of
the tree view. To check its parameters, select it:


As you can see, the service has been created with the default parameters.

Note
1:
The “Default RuleSet” has been automatically assigned as
the rule set to use. By default, the wizard will always assign the first rule
set visible in the tree view to new services. In our case, this is not correct
and will be corrected soon.

Note 2: If you want to generate reports (using Monilog) on the data via this service i.e. EventLogMonitor, then you have to press
the “Configure for Monilog” button and make the settings as shown in the screen-shot.


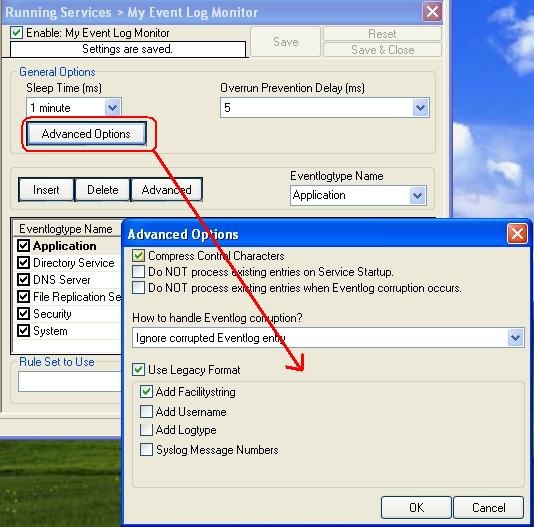
Note 3: If you want to generate reports (using MonitorWare
Console) on the data via this service i.e. EventLogMonitor, then you have to
uncheck the “Use Legacy Format” option. This is recommended. If you don’t
uncheck this option then meaningful reports aren’t generated (i.e. reports are
not properly consolidated by MonitorWare Console).

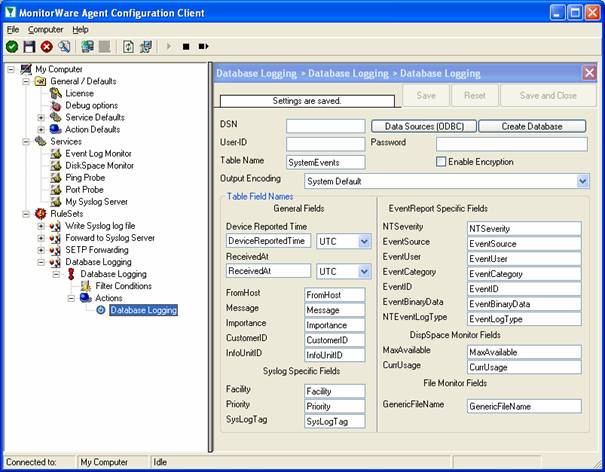
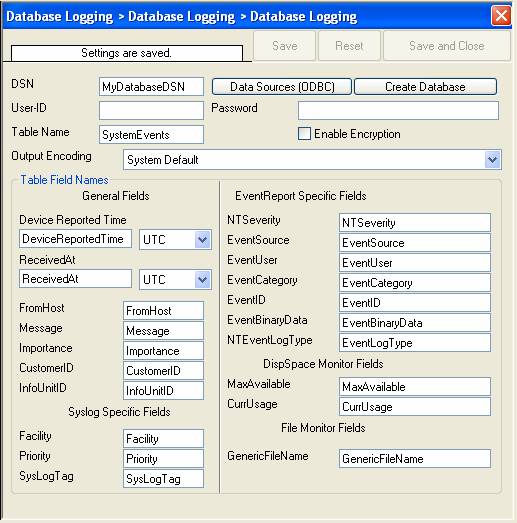
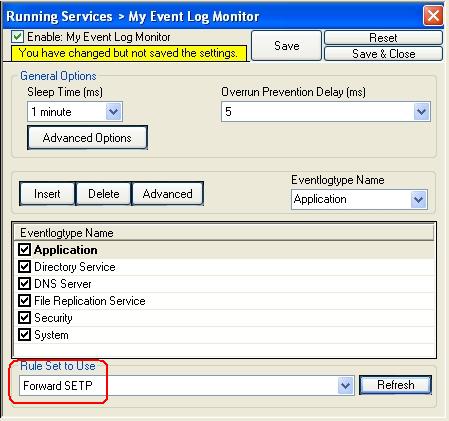
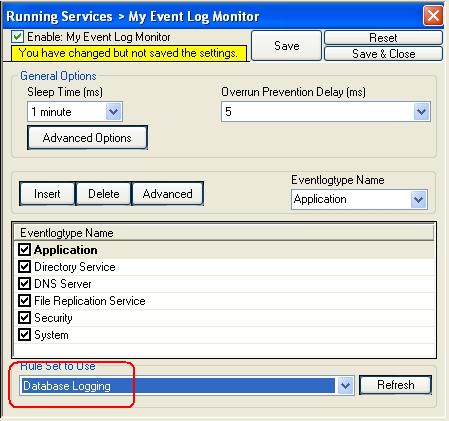
5. Now you must differentiate between clients and central hub server. In
clients use the “Forward ” RuleSet we have created in Step 2, select it as rule
set to use. In central hub server select the “Database Logging” RuleSet we have
created in Step 3. Leave all other settings in their default.

Clients:

Central hub server:

6. Finally, save the change and start MonitorWareAgent. This procedure
completes the configuration of the syslog server.

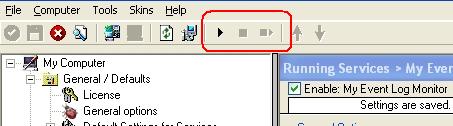
MonitorWare Agent cannot dynamically read changed configurations. As such, it
needs to be restarted after such changes. In our sample, the service was not yet
started, so we simply need to start it. If it already runs, you need to restart
it.

With step 5 the client machines configuration has finished. All the next
steps are only concerned with the central hub server.

A complete step by step guide on setting up database logging action

How To setup Database Logging Action

Article created 2003-02-24 by Rainer Gerhards.

1.
Start the MonitorWare Agent

2.
Again, you can select the language to use. And
again, I suggest using English, as this makes the guide easier to follow.

3.
Then define a new rule set, right click
"Rules". A pop up menu will appear. Select "Add Rule Set" from this
menu. On screen, it looks as follows:

4.
Then, a wizard starts. Change the name of the
rule to whatever name you like. We will use "Database Logging" in this
example. The screen looks as follow:


Click "Next". A new wizard page appears.

5.
Select only Database Logging. Do not select any
other options for this sample. Also, leave the "Create a Rule for each of the
following actions" setting selected. Click "Next". You will see a
confirmation page. Click "Finish" to create the rule set.

6.
As you can see, the new Rule Set "Database
Logging" is present. Please expand it in the tree view until the action level
of the "Database Logging" Rule and select the "Database Logging" action
to configure.

7.
Now click on the Data Sources (ODBC) button to
open the ODBC Data Source Administrator. Then choose the "System DSN" tab an
click the "Add" button to add a new System-DSN (Select the Microsoft Access
driver like in the screenshot below).

8.
In the next step, click the "Select button and go
to the MonitorWare Agent installation directory (Usual C:\program files\MonitorWare\Agent\)
and choose the sample database called sample97.mdb. After that name the new DSN
with "MyDatabaseDSN" like in the following screenshot and press OK.

9.
Now close the ODBC Data Source Administrator
and switch back to the MonitorWare Agent Client and insert "MyDatabaseDSN"
in the DSN field. Leave all other settings in their default and save the
changes.

2003-02-24 MonitorWare Agent 1.2 Final Released

MonitorWare Agent 1.2 Final Released

Adiscon today announced the immediate availability of MonitorWare Agent 1.2 Final. This version has a new powerful Filter-Engine which allows you to build very complex Filters like known from Microsoft Network
Monitor. For more details see below.  Continue reading “2003-02-24 MonitorWare Agent 1.2 Final Released”

2003-02-04 MonitorWare Agent 1.2 Beta 1 Released

MonitorWare Agent 1.2 Beta 1 Released

Adiscon today announced the immediate availability of MonitorWare Agent 1.2 Beta 1.

This version has a new powerful Filter-Engine which allows you to build very complex Filters like known from Microsoft Network Monitor. For more details see below.  Continue reading “2003-02-04 MonitorWare Agent 1.2 Beta 1 Released”

How can I forward IIS logs to a syslog deamon?

How can I forward IIS logs to a syslog deamon?

Created on 2002-10-04 by Rainer Gerhards.

MonitorWare Agent can forward Microsoft Internet Information Server (IIS) log files to any syslog deamon (or syslo server, if you like). Fortunately, IIS stores web log files as plain text files in the file system. Even better, other processes are allowed to read these files while IIS adds information to them. This enables MonitorWare Agent to forward them in near real-time.

MonitorWare Agent’s file monitor is optimized to pick up application log files. This includes IIS log files. Specific logic enables it to gather only the valid part of the currently being written log file (IIS writes files in 64K increments and there is garbage after the valid log data lines). Special replacement characters inside the file name allow to handle changing file names, so monitoring even works while rolling over to new names.

To activate log forwarding, create one file monitor per IIS log file to monitor. Be sure to use the proper replacement characters if IIS modifies the log file name (by default, it includes the day of month). Details on them can be found in the manual. Then be sure to send all file lines to a rule base that has syslog forwarding enabled. There is a sample in the Step-By-Step Guides inside the manual.

IIS log file data is like any other event data in MonitorWare Agent. So it can not only be forwarded by syslog but also be filtered, acted on, alerts generated and so on. Another possible approach is to generate alerts if specific attack patterns show up in the logs. As long as the pattern is known and can be seen in the log file line, this can easily be configured.

Just a reminder: besides IIS, all other text logs can be processed. Prominent examples include the DHCP log or database message log files.