Centralized logging in a hybrid environment (Windows/Linux) – Step 4

Step 4 – Setting up the Linux Clients

We still need to implement the Linux clients into our logging network. This could be Linux workstations or servers. Currently, rsyslog is already shipped with many Linux Distributions as the default syslog daemon already. Though, often a rather old version is installed (mostly v3), this will be sufficient for our current goals.

For our example we will use a Fedora system and alter the configuration accordingly. In the end, rsyslog should use the logs, that are logged locally and forward them via TCP to the central log server.

Please note: The example has been made with Fedora 13. Some steps may vary with other Linux distributions. Since there are so many possibilities, we cannot list them all. So we only concentrate on one version.

Step 4.1:

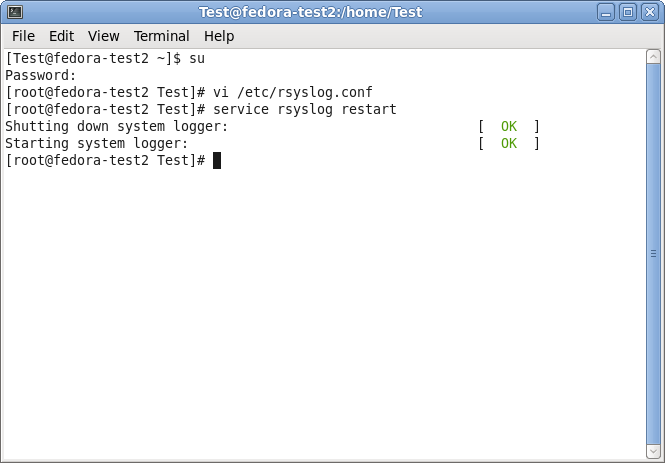
First of all, we need a terminal or command line and go into root mode with su. We do not need the root rights desperately, but it is a bit easier to achieve our goals.

Step 4.2

We need to alter the configuration accordingly. We will use the vi text-editor to do so. If you are not familiar with vi, you should consider getting some knowledge first with the vi man page.

You can find the default configuration file in

/etc/rsyslog.conf

This configuration file will be loaded once rsyslog is started.

Open the configuration file by the following command:

vi /etc/rsyslog.conf

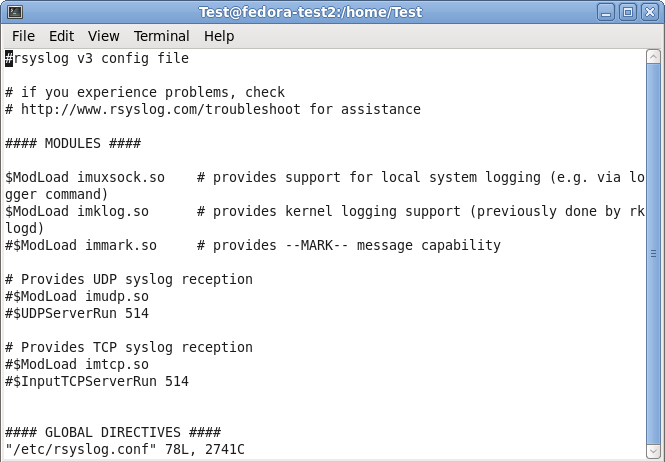
Your terminal should look like this:

centralized_monitoring_4001

Step 4.3

Under the header “#### MODULES ####” you can see the loaded modules. The ones we need are already loaded. For sending syslog, we do not need a extra module to be loaded. Basically, the imuxsock.so is listening to the local log socket and imklog.so provides the support for kernel logging. More is currently not needed.

When going further down in the configuration, we see parts that are called UDP and TCP syslog reception. They are uncommented. We don’t need them, so we leave them that way. As you can see, there is the command to load a module (introduced my $ModLoad) and then a specific command that is given to the module which tells it to run as a syslog server on a specific port.

Step 4.4

When scrolling further down in the configuration file, we will find the header “#### RULES ####“.

centralized_monitoring_4002

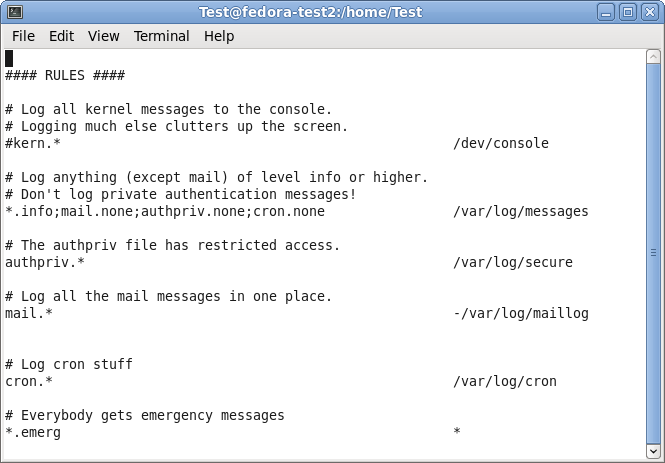
Here, some rules are defined about which logs are stored in which location. These rules have a basic format. Basically, this looks like this:

facility.severity storage_location

The facility roughly determines, what has generated the log message. The severity tells you, how urgent the message is. And the storage location determines, where to store the logs. In the default config, there are several rules for some important log files. They will all be stored in the folder /var/log.

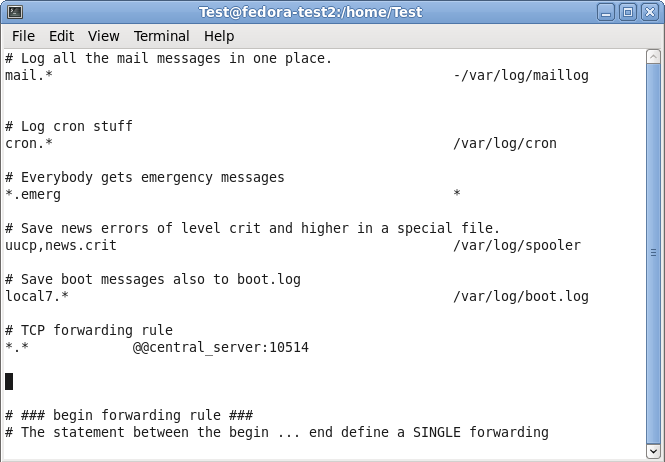
We need to add another rule for forwarding all log messages via TCP syslog. For now, go to the last of the rules and insert the following:

*.* @@central_server:10514

This rule means that all messages, no matter the facility or severity, will be forwarded via TCP to the central server on port 10514. We need to choose port 10514, since our central server will listen to TCP syslog on this port.

In the configuration file, this should look like this:

centralized_monitoring_4003

You can now save and quit vi.

Step 4.5

Now that we have altered our configuration according to our needs (which hasn’t been too much), we still have one more thing to do. We need to restart the service.

Now that we are back on the command line, we can easily use the following command:

service rsyslog restart

This will tell the rsyslog service to stop and start again. Thus, the configuration will be loaded with the changes we made.

centralized_monitoring_4004

Step 4 – finished

We are now finished with setting up rsyslog correctly. It will take all the logs it receives and forwards them to our central log server via TCP on port 10514. In addition to that, the default log rules still exist and will log messages to the local harddrive.

Though, there could be many more scenarios and configurations. We decided to keep it simple for a basic setup.

<< Go back to the main page

A complete step by step guide on setting up Scheduling of Reports with Job Manager

How To Schedule Reports with MonitorWare Console

Article created 2003-11-20 by
Wajih-ur-Rehman.

Reports in MonitorWare Console can be scheduled using Job Manager. With Job
Manager you can not only schedule the reports such that they are saved on the
hard disk but also you can schedule the reports such that they are sent via
email to specified recipients.

1. Click "Options" in the main tool bar of MonitorWare Console and then click
on "Job Manager Settings…" You will see a dialog box as shown below

2. Click on the report that you want to schedule. In this example i will
illustrate the scheduling of "System Status Report"

3. Click on "System Status Report" on the left hand side.

4. On the right hand side, set the time and UTC offset. Please note that the
check box must be checked if you want to schedule the report. Lets say
you want to generate this report daily at 11:00 pm. If you have logged the
records in the database with local time, then you dont need to set this UTC
value. It will stay at 0. These settings are shown below:

5. Now click on Action tab. You will see as below:

6. Set the File Prefix. In this case, I leave it as default.

7. Now you have 2 options. Either you can save the report on the hard disk or
you can send an email when the scheduled time is met. If you select "Save as
file" radio button, then the "File Settings" button will be enabled and on the
other hand, if you select "Send as attachment in email" radio button, then both
"SMTP Settings and "Message Settings" buttons will be enabled. You can either
carry on with Step 8 or Step 9 depending upon your requirements

8. If you want to save the report on the hard disk at the scheduled time then
select "Save as file" radio button and click on "File Settings" button. Once you
do that, you will see the following dialog box:

You can select any path over here that you feel like. But if you want to view
this report on the web, you will have to create a folder under Inetpub->wwwroot.
In this case, I have created a folder named "MonitorWareConsole" and have
selected the same in the above dialog box. Click OK once you have done that

9. If on the other hand, you are interested in the report being emailed to
some specified recipient at the specified time, then you should select the radio
buttion labeled as "Send as attachment in email". After Selecting it, click on
SMTP Settings. It will show you the following dialog box:

Enter your SMTP server name. Click OK. Then click on "Message Settings"
button. You will see a dialog box similar to the one shown below:

Fill in these values and click OK when done

10. After setting the "Action" tab according to 8 or 9 above, click on Filter
tab. Once done, you will see following dialog box:

You can now select one of the above 3 mentioned filters based on your
requirements.

11. Once done, click on "Save" button. If the Job Manager Service is running,
it will give you a message saying that it would restart the service so that new
settings could take effect. If on the other hand, the service in the background
is not running, it would give you a message saying that you have to manually
restart the service. You can start the service manually by going to Control
Panel->Administrative Tools->Services and start AdisconMWCJobManager Service

A complete step by step guide on setting up centralized Windows event monitoring. It contains screenshots of all important dialogs as well as links to the necessary free downloads.

How To setup Windows centralized Monitoring

Article created 2003-11-24 by
Wajih-ur Rehman.

Article updated 2004-04-22 by
Tamsila-Q-Siddique.

Monitoring Windows NT/2000/XP/2003 is important even for small environments.
This article is strictly task focused. It does not describe why the
systems should be monitored nor does it provide any further background. Please see
the respective backgrounders or product documentation on this. This article is a
step-by-step description of what you need to do in order to centrally monitor
your Windows NT/2000/XP and 2003 systems.

This article has been extracted from the
MonitorWare Agent documentation. Please be sure to check the MonitorWare Agent online help
if a newer version is available.

Centralized Event Reports

In this step-by-step guide, MonitorWare Agent is configured to work together with
Adiscon’s MonitorWare Console to automatically
generate event summaries for the monitored servers and other devices.

This
guide focuses on a typical small to medium business topography with a single
geographical location and 5 Windows clients and a central hub server. All
systems are well connected via a local Ethernet. Event reports from all machines
should be stored in a database. The administrator shall receive daily
consolidated event reports.

What you need

In
this guide, I am focusing on building a solution with Adiscon’s MonitorWare
Agent and MonitorWare Console. This combination allows you to centralize all your event logs
and report events from them. Free 30 day trial versions are available at the
respective product sites (links below), so you can try the system without the
need to buy anything.

You
need to run the following products:

  • 1 MonitorWare
    Agent for each system that is to be monitored. In our scenario, this means 6
    copies, one for each client and one for the central hub server to be monitored.
  • 1 MonitorWare Console togenerate consolidated reports based on the gathered log data.
  • To deliver
    MonitorWare Console’s reports, you need a local web server (for example Microsoft’s IIS or
    Apache) and a mail server capable of talking SMTP (most modern servers support
    this)

You
need administrative privileges on each of the machines. This is required both
for installation and configuration. Make sure you log on with a sufficiently
privileged user account.

Step 1 – Download Software

As you read the MonitorWare Agent
manual, you most probably downloaded the MonitorWare Agent. If you haven’t,
please visit www.mwagent.com/download
to do so. In addition to the agent, you also need MonitorWare Console. A free,
full-featured 30 day trial is available at

http://www.mwconsole.com/en/download/
.

Step 2 – Install MonitorWare Agent

Run the MonitorWare Agent setup
program on all systems that should be monitored. This means you need to run it
on all 5 clients and the central hub server. Take a note of the central hub
server IP address or host name. You’ll need this value when configuring the
agents on the client machine. For our example, we assume this system has an IP
address of 192.168.0.1.

For larger installations (with many
more servers) there are ways to set it up in a simpler fashion, but in a
scenario like ours, it is faster to install it on each machine manually. You can
install it with the default settings. When setup has finished, the program
automatically is configured to operate as a simple syslog server. However, it
does not yet create the log in our database we need. So we will go ahead and
change this on each of the machines or by launching it on one machine and
remotely connecting to the others. It is your choice. In this sample, I use the
MonitorWare Agent on each machine (it is easier to follow).

Step 3 – Create a RuleSet for Forward by SETP

The steps to configure the agents are
as follows (repeat this on each of the 5 client machines). This step needs not
to be done on the central hub server!:

Forward via SETP Steps

Step 4 – Create a RuleSet for database logging

This
step needs only to be done on the central hub server!

Database Logging Steps

Step 5 – Create an Event Log Monitor Service

The steps to configure the MonitorWare Agents are as follows (repeat this
step on each of the 5 client machines and the central hub server!
):

EventLogMonitor Service Steps

Step 6 – Create a SETP Server Service

The
steps to configure the agents are as follows (only central hub server!):

SETP Server Service Steps

Step 7 – Preparing Web Server for MonitorWare Console

MonitorWare Console publishes its reports through
the local web server (central hub server).

To avoid confusion, we recommend
creating a separate directory on the web server for MonitorWare Console. Let us assume you
use Microsoft Internet Information Server and run it in the default
configuration. Then, you web pages are stored in the c:\inetpub\wwwroot
directory. Create a subdirectory “MonitorWareConsole” directly beneath this
directory.

Step 8 – Installing and Configuring MonitorWare Console

MWConsole- Installation and Configuration Steps (1.1)

MWConsole- Installation and Configuration Steps (2.0)

Step 9 – Generating Reports with MonitorWare Console Manually

This section explains how the reports can be generated with MonitorWare
Console manually. Since “System Status” Report is most comprehensive report that
tells a detailed description about the network, in this section I will explain
this report only. Please note that, the procedure for generating any report is
almost the same.

Generating Windows Reports with Console 1.1 Manually

Generating
Windows Reports with Console 2.0 Manually

Step 10 – Scheduling the Generation of Reports with MonitorWare Console

This section explains how the reports can be generated with MonitorWare
Console automatically using Job Manager. With Job Manager, you can generate all
the reports based on a pre-defined schedule and ask it to either store it in
some location on the hard disk or send it to specified recipient via email. Once
again, I will explain the scheduling of System Status Report in this section.
Please note that, the procedure for scheduling any report is the same.

Scheduling Reports with Console 1.1

Scheduling Reports with Console 2.0

You are done!

Well, this is all you need to do to
configure the basic operations. Once you are comfortable with the basic setup,
you can enhance the system with local pre-filtering of event, enhanced logging
and alerting (with MonitorWare Agent) and changing report options (with
MonitorWare Console).

We hope this article is helpful. If you have any questions or remarks,
please do not hesitate to contact us at
support@adiscon.com

“A complete description of common uses of the MonitorWare line of products. – Relaying events

Common uses

Article created 2003-05-14 by Rainer
Gerhards
.

Relaying Events

In all but the easiest scenarios event data needs to be relayed between
different machines. Please note that relaying is also often referred to
as “forwarding” – both terms have the same meaning in the context
of this documentation.

A typical relay scenario might look like follows:

Here, devices send event data to servers configured for relaying. These
servers in turn forward the data to its final destination, the central
server.

Please note that the so-called “Relay Server” need not be limited to the
relay function. It can also perform any other MonitorWare agent function
like data gathering or real time alerting. Also, the devices of course
can include Windows systems monitored by a MonitorWare Agent configured as data gathering- The idea behind the picture is to provide a quick sample – it is in no means complete.

Whenever it comes to relaying messages, an important decision must be made: the protocol used for relaying must be selected. Basically, either syslog or the SETP protocol can be used. This is an important choice, because the two protocols offer very different benefits:

syslog

  • supported by virtually all network devices (like routers, firewalls and the like)
  • standardized (but not necessarily all devices follow the standard)
  • THE universal network event notification protocol
  • UDP based, as such event data might be lost in transit
  • limited to 1024 characters per event, which is definitely too short for Windows
    event log entries (larger messages can be processed by MonitorWare, but
    this can result in more likely packet loss)
  • event source system typically can not be tracked correctly when using inside a cascaded system
  • event information for non-original syslog events is lost as they can not be transmitted in native format

SETP

  • Adiscon’s proprietary protocol for event notification
  • so far, supported by MonitorWare Agent exclusively
  • TCP based, reliable delivery possible
  • can be used with Windows IPsec
  • optimized for event data transmittal
  • events are transmitted in native format and thus can be fully reconstructed at
    the receiving side
  • no event size limit
  • XML based

Given the advantages, Adiscon recommends using SETP whenever possible. This is then the case when an MonitorWare Agent sends events to another MonitorWare Agent. When events from other devices, e.g. routers, are to be received, syslog protocol must be used for these incoming events. If event data is to be sent to a non-MonitorWare Agent system (e.g. a management system on a Linux or UNIX system), syslog must also be used as these other systems do not “speak” SETP.

MonitorWare Agent can process both of these protocols concurrently. So it is no problem to use SETP in a mixed environment. Again, we highly recommend using SETP whenever possible.

A complete description of common uses of the MonitorWare line of products. – Solving Products

Common uses

Article created 2003-05-14 by Rainer
Gerhards
.

Solving Problems

Solving problems is closely related to alerting. As with alerting, actions are to be executed if a trigger condition exists. With problem-solving,
these are actual corrective actions. Samples are deleting temporary
files when disk space goes low or blocking an external IP address in a firewall in case an attack is detected.

MonitorWare itself does only provide limited “canned” actions for
problem-solving. However, it contains the “execute program” action,
which is a very powerful tool in solving problem conditions.

The basic idea behind this concept is that the MonitorWare agent detects
correctable conditions and then executes an external program (or a batch
file!) to correct the problem. With the power of external program, batch
files and scripts, many minor conditions can be solved before they cause
deep trouble. Many routine tasks can be solved without operator
intervention which also means they can be solved while no operator is
available.

Problem-solving logic can be put on any Agent. However, Adiscon highly recommends placing it on the each of the machines that will use problem solving logic. This not only ensure quick response time and reliability, it also guarantees that actions are carried out as quickly as possible.

A complete description of common uses of the MonitorWare line of products. – Alerting

Common uses

Article created 2003-05-14 by Rainer
Gerhards
.

Alerting

In this scenario, the primary concern is to receive alerts if specific events happen. Of course, alerting is often used together with other scenarios as alerting alone does not provide in-depth analysis or storage of the captured events.

Alerts can be generated by every running instance of MonitorWare Agent. As such, alerts can be generated both on each machine that is monitored as well as on a central machine. Also, alert generation can be combined.

There are advantages and disadvantages for each mode. The big plus of generating alerts on each monitored machine is that they will be triggered whenever they are detected. There is no interim system that events need to be passed to and as such no interim system that can fail. However, this implies that alerts need to be configured on each monitored machine, which can be inconvenient (but becomes less of a burden with the soon available central configuration service).

Central alert generation ultimately solves this issue, as alerts are only generated on a single machine – or at least few machines. On the other hand, if the reporting system is not able to reach the central server for some reason – or the central server fails, no alerts will occur at all. This, of course can be largely worked around by monitoring the central server’s health with another instance of the MonitorWare Agent running on another machine, but this adds complexity.

Fortunately, MonitorWare is flexible enough to allow all imaginable configurations. For example, it is possible to trigger for extremely urgent alerts on every monitored machine while less critical alerts are checked at a central server.

In any case, alerts are defined via rule sets. Inside the rule set, filters are defined for the alert conditions and action carry out the actual alert. Of course, alert actions are most often sending emails or starting a “net send” command to broadcast the message e.g. to a group of network administrators.

Alerts can be executed on a MonitorWare Agent who is also performing other functions.

A complete description of common uses of the MonitorWare line of products. – Event archival

Common uses

Article created 2003-05-14 by Rainer
Gerhards
.

Event archival

If you have to create an archive of past events, this scenario is for you.
The main focus here is storage of event data. Potentially, data is
stored for a long time and eventually never being overwritten. It is
also highly likely that data will be written to a read-only media like
CD-R.

Event archive are created for a number of reasons, some samples are

  • Corporate requirementsYour organization, as a general policy, requires you to log data for later review.
  • ISO 9000 requirementsDepending on where logs are being generated, they might be needed to be long-term
    archived to fulfil the ISO 9000 requirements.
  • legal requirementsDepending on your country, some or all organizations might be required by law to
    save log data for an extended period of time. For example, in many
    countries internet service providers are required by law to archive
    connection logs for at least some month so that criminal investigators can use them to track down cyber-criminals.

Depending on the exact requirements you have, the event archive can be placed on a server that performs other functions or it can not. If the log archive is potentially used in court, we highly recommend to use a dedicated and specifically configured machine.

Creating an “unsecured” Event Archive

By “unsecured”, we mean an archive that is created without any specific measures against tampering with the log data. This type of archive is meant to be used for internal audits, only. This archive is not intended to be used as evidence in court. As such, a less restrictive security policy might be used.

This scenario is often found in organizations where event archiving is not the topmost priority and funding thus is limited. The advantage of an unsecured archive is that no dedicated machine or complex procedures are needed. If that level of security is sufficient for your application, the unsecured archive can be placed on event repository server that also performs other actions. For example, the event data could be written to a database which is also access by other tools.

However, as a general recommendation, we recommend to write archives as text files, which can later easily be compressed and written to read only media (if there is justification for this). This also allows to keep the database clean of otherwise unneeded historical data.

Setting up a unsecured event archive is relatively trivial.

Creating a highly secure Event Archive

This type of archive is needed if log data is potentially to be used in
court. Please note that some countries require organizations to store
log data securely.

As law is very different in different countries and states, this guide here
can not provide a definite answer on how to set up an archive to comply with local laws or to be used as evidence. You need to work with your legal advisor on how to do that. However, Adiscon’s scenario here describes some steps that are typically required.

A secure event archive is one where event data can not be tampered (or at least where it is highly unlikely). As such, special care must be taken that the system the archive resides on is tamper-resistant as well as the archived logs.

A typical configuration for a secure log host looks as follows:

As a general guideline, we recommend the following steps to create a highly secure event archive:

  • Firstly, check with your legal counsel and make sure you understand the legal requirements and implications of your doing! This is an essential step. If, for example, event log data is meant to be used in court and there is even a slight failure in your procedures, the data can not be used as evidence!
  • Make sure that the central log host is a dedicated, well-equipped machine.
  • Ensure physical security of the central log host.
  • Ensure that the log host is protected by a firewall and there is no other system inside the log host’s network. Remember: nowadays firewalls have become quite inexpensive. If in doubt, look for a Cisco PIX 501, which offer very much for very little money!
  • Review “Creating a hardened log host” for information on hardening your log host.After mastering the initial steps, creating the log host itself is quite simple:
  • Then, follow the “Creating a simple Syslog Server” step-by-step guide.
  • If you would like to receive Windows event log data or other non-syslog based events, we recommend to set up a SETP server and use SETP for relaying messages from the local Agents. This is described in
    “Forwarding NT Event Logs to a SETP Server”
    .
  • Keep in mind that both the syslog server and the SETP server can run concurrently!
  • Point all your log sources to the log host. Instructions for common syslog devices can be found in “Sample Syslog Device Configurations”.This concludes the creation of the log host.
  • Ensure that log data is written to offline media on a regular basis. It is highly recommended to use read-only media like CD-R or DVD-R. Using rewriteable made might make the archive questionable in court. As does writing too infrequently to offline media. We recommend a daily schedule. Be sure to make backup copies from this media and store it on two physically different, secure places. Keep in mind that log data contains very sensitive information: make sure no unauthorized person has access to it. For example, it is not the best idea to send these CDs via postal mail or regular courier.
  • After you have finally set up your system and documented all procedure, be sure to re-check with your legal counsel.
  • Finally, remember that security is not a one-shot! Neither is law. Be sure to apply all hot-fixes to your server as they become available and change your procedures as need arises. Be sure to check with your legal counsel on a regular basis to ensure continued compliance with legal requirements.As you have seen, when creating a secure log host, there are many things beyond the scope of Adiscon’s software to consider. The small guidelines above are hopefully a good starting point. But it is strongly advised to check with other security sites (like www.cert.org)
    and consultants before implementing such a system. Your local government might even run a dedicated site with recommendations.

    Creating a log archive for Evidence in Court

    This is more or less the same scenario as “Creating a highly secure Event Archive”.
    We are providing a separate section as many people have inquired about
    some legal specifics. So we have tried to find some good sources, which
    we list here.

    Again, we can not and do not provide legal advise here – check with your
    legal counsel before implementing any solution.

    In the US, you might also want to visit www.cybercrime.gov.

    To set up a log archive that should potentially be used as evidence in
    court, please follow “Creating a highly secure Event Archive“.

Automatically archiving logfiles written by MonitorWare Agent.

Automatically archiving logfiles written by MonitorWare Agent.

Article created 2008-11-27 by Andre Lorbach.

This article was written by using the MonitorWare Agent, but it can also be applied to EventReporter and WinSyslog.

By default the log files generated by MonitorWare Agent using the WriteFile Action are written on a daily basis, so you have one log file for each day. Over time this can become a huge number uncompressed log files, so you properly want to archive them automatically to save disk space. There is no inbuilt method in MonitorWare Agent yet to do so, but this article will describe how you can archive this goal by using the Windows Task Scheduler and WinRar.

Table of Contents

1. Installing and Configuring MonitorWare Agent
1.1 Download and Install MonitorWare Agent
1.2 Setup up basic MonitorWare Agent configuration
1.3 Configure the Write File Action.
1.4 Start MonitorWare Agent
2. Configure log file archiving
2.1 Download and Install WinRar
2.2 Create VBScript which utilizes WinRar to create archives.
2.3 Create Task in Windows Task Scheduler
Final Thoughts

1. Installing and Configuring MonitorWare Agent

1.1 Download and Install MonitorWare Agent

So if you haven’t done so already, go to www.mwagent.com and download the latest MonitorWare Agent version. It is always recommended to use the latest Version of MonitorWare Agent. Once the download is done, go ahead and install it. You may have to restart after installation, this depends on your system.

Back to Top

1.2 Setup up basic MonitorWare Agent configuration

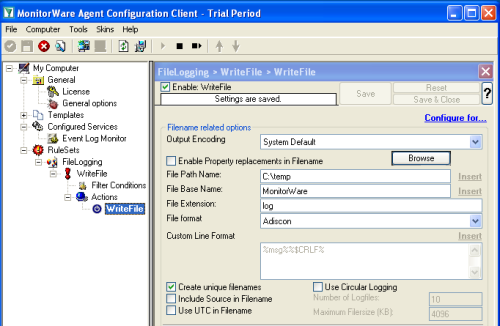
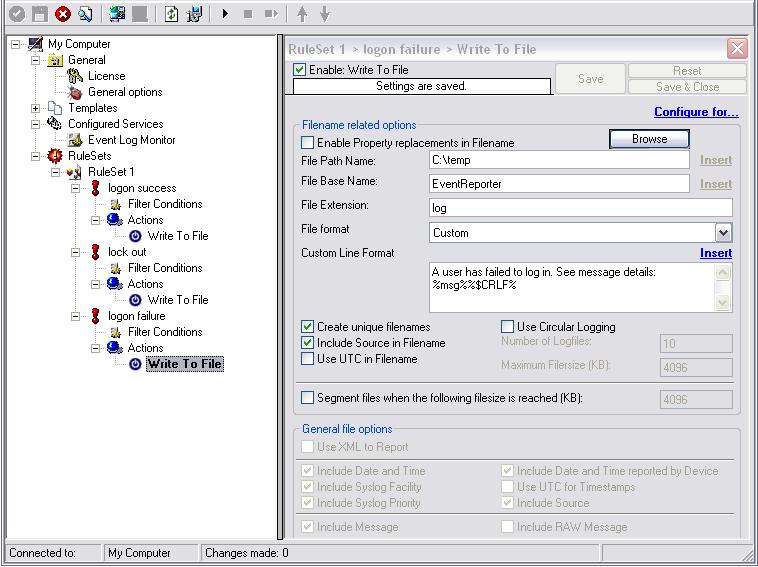
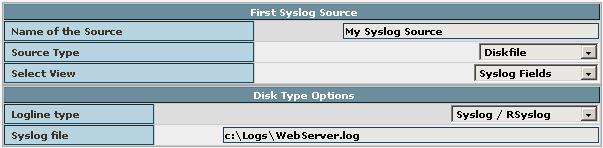
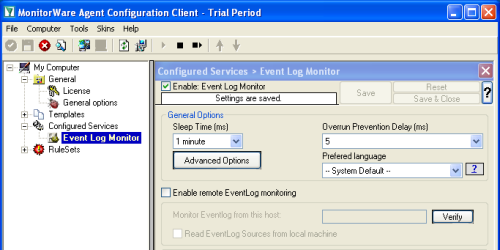
Start the MonitorWare Agent client and skip the wizard on startup. In this article, we will use an EventLog Monitor as source for our File logging, but you can use any other kind of source. Create a new “EventLog Monitor” service and just name it “EventLog Monitor”. You can leave all configuration settings as they are in the screenshot on the right.

Back to Top

1.3 Configure the Write File Action.

In order to create log files we need a Write File Action. Create a new Write File Action like in the screenshot on the right. The default settings will create daily log files automatically. You may customize the log format by using the custom “File format” option. It is important to have the “Create unique filenames” Option enabled, this will enable the daily written log files.

The log file name for 2008-11-28 would be MonitorWare-2008-11-28.log, and for the next day MonitorWare-2008-11-29.log and so on.

Back to Top

1.4 Start MonitorWare Agent

After you configured MonitorWare Agent, you can start the Service and verify that the daily log files are successfully written.

Back to Top

2 Configure log file archiving

2.1 Download and Install WinRar

Visit the RarSoft website to download the latest Version of WinRar, if you haven’t installed it already. There are plenty of other packer applications out there and this article may also be used with them. However I will focus on using WinRar.

Once you downloaded WinRar, start it’s installation, and remember the exact path it was installed to. Usually this is “C:\Program Files\WinRAR” or “C:\Program Files (x86)\WinRAR”.

Back to Top

2.2 Create a VBScript which utilizes WinRar to create the archives.

This script will actually do the work for you. It is designed to automatically generate the filename of the log file from yesterday, and create an archive with the same name. If the archive is successfully created, the log file will automatically be deleted. The script is also in the script package which you can download at the top. You can also copy the script content from the textbox below, and create a new file archive_logs.vbs yourself.

By default the script will create zip files, if you rather want to create rar files, just remove the -afzip parameter from the variable szCommand at the end of the script.

The next thing to do is to edit this script to your needs. There are 4 parameters at the top which you may need to customize, so the script fits into your environment.

szWinRardirectory – contains the full installation of your WinRar installation
szBasedirectory – Same as the Basedirectory parameter as in your WriteFile action
szBaseName – Same as the BaseName parameter in your WriteFile action.
szExtension – Same as the Extension parameter in your WriteFile action.

Once you have done this, you should run the script at least once manually by double clicking it to see if it works. You may only notice a short popup of the WinRar Windows, depending if a log file to archive can be found, and archiving takes some time. If it works, you should see a zip-packed log file in your logs directory, like in this screenshot.

Back to Top

2.3 Create Task in Windows Task Scheduler

Open the Control Panel, and go to the scheduled tasks. From there you can create a new scheduled task using a wizard. Once the wizard is opened, click on browse to manually select the “archive_logs.vbs” script. Then proceed to the next step of the wizard.

Choose “Daily”, and set the start time in the next wizard step. I have chosen 02:00 am in this article, but you can also chose 04:00am or 01:00am. It should not be 00:00am, because the script might archive the log file too early.

In the next step you have to configure the Username and Password, the task is going to run under. Once you finished creating the scheduled task, right click it in the task list and select “Run” in order to test that the task is working.

Back to Top

Final Thoughts

I hope this article will help you solving your tasks and shows you the potential of MonitorWare Agent, and what you can archive with it. Feel free to email me for recommendations or questions.

 Continue reading “Automatically archiving logfiles written by MonitorWare Agent.”

Filtering Logon, failed Logon and Lockout Events

Filtering Logon, failed Logon and Lockout Events

Created 2008-10-16 by Florian Riedl

Please Note: This article is valid for EventReporter 9.x / MWAgent 5.x and lower and describes, how to set the filters to get only logon, failed logon and lockout events.

The scenario is, that we need to monitor the behavior of users logging into machines, as well as failing or being locked out, due to bad inserted passwords. All those events should be written into a text file with a unique message that indicates to us what has happened. We need only one ruleset and one service for this. The service would be the EventLog Monitor. In the ruleset, we need 3 separate rules with each having one Action, the Write to File Action. The basic setup should look like this:


Image 1: Basic Setup

Now we will get to the core part of this setup. The filters. This will be a little bit complex, as there are a lot of possibilities when it comes to monitoring logon events. We need to monitor the events with the following IDs:

  • Event ID: 528 – Successful Logon
  • Event ID: 529 – Logon Failure: Unknown user name or bad password
  • Event ID: 530 – Logon Failure: Account logon time restriction violation
  • Event ID: 531 – Logon Failure: Account currently disabled
  • Event ID: 532 – Logon Failure: The specified user account has expired
  • Event ID: 533 – Logon Failure: User not allowed to logon at this computer
  • Event ID: 534 – Logon Failure: The user has not been granted the requested logon type at this machine
  • Event ID: 535 – Logon Failure: The specified account’s password has expired
  • Event ID: 536 – Logon Failure: The NetLogon component is not active
  • Event ID: 537 – Logon Failure: An unexpected error occurred during logon
  • Event ID: 539 – Logon Failure: Account locked out

We need to split up these events for the different rules we created before. To summarize it, we need the following packages:

  • Logon Success: Event ID 528
  • Logon Failure: Event ID 529 – 537
  • Account Lockout: Event ID 539

There are a lot of Events available for logon failure. So we have to consider all the events that would fit. If some events do not fit for your account policy auditing, then simply leave them out. With this information in mind, we set up the filters. The first two filter will be for “Successful Logon” and “Account Lockout”. We use the “AND”-Operator and filter for the Event ID. This looks as follows:


Image 2 and 3: Filter for “Successful Logon” and “Account Lockout”

The last filter for “Logon Failure” looks a bit different, as we have multiple conditions that we need to check. Therefore we need a different Operator. We will take the “OR”-Operator as this is the most suitable. It will evaluate to true once one of the multiple conditions is true. So the same Action (writing a message to a textfile that tells us, that a login has failed) can be performed for multiple events. In contrary, the “AND”-Operator needs all conditions to be true to process the Event, else the Action will not be carried out. The filter should look like this:


Image 4: Filter for “Logon Failure”

The last thing we have to do is to set the messages that should be written into the textfile. Therefore go to each “Write to File”-Action and set the “File Format” to “Custom”. Then you can edit the message to whatever you like. I chose these messages for my example:

  • A User has successfully logged in, see message details: %msg%%$CRLF%
  • A User has been locked out. See messages details: %msg%%$CRLF%
  • A User has failed to log in. See message details: %msg%%$CRLF%

These messages give you directly a comment about the event that happened and show you the original message, which holds the information about the user, machine and message details. The configuration for one of those Actions could look like this:


Image 5: Settings for “Write to File”-Action

Please Note: Every “Write to File”-Action needs to write its messages into the same file. Else, you will have separate files for all three kinds of messages. If writing to the same file, a message will be written one after another, so there will not be any overlapping with the messages.

You could also make this message a bit more detailed by including the timestamp and the name of the machine on which the Event happened. Then it could look like this:

  • %timereported%, %Param0%, %Param1%, %Param5%, Logon Failure%$CRLF%

This would result in the following message:

2008-10-14 09:24:33, Username, Domain, Workstation, Logon Failure

The message now contains the complete timestamp with date and time, the name of the Domain for which the Event applies, the Workstation name from which the message originates and “Logon Failure” as comment to what happened. We have to do this in a fixed way, as we do not have this information automatically parsed from the Event message. If you want to have the detailed description for the Event you can either add the complete message with %msg% or parse out the information before writing it and put it into a custom property with the “Post-Processing”-Action (only available in MonitorWare Agent Professional and Enterprise).

This is all that needs to be done for having all events for Successful Logon, Logon Failure and Account Lockout written into a textfile. If you have any remarks, suggestions or questions to this article, please send a email to our Support Team.

Install phpLogCon with IIS6.0

Install phpLogCon with IIS6.0

Article created 2008-10-14 by Tom Bergfeld.

In this paper, I describe how to install phpLogCon with IIS6.0. It is intentionally a brief step-by-step guide, targeted to those who want to quickly get it up and running. For more elaborate information about phpLogCon, please consult the phpLogCon manual set.

Installing IIS

If you don’t use IIS so far, you have to install it now. You just need your Windows-Installation-CD. Go to “Add or Remove Programs” in your Control Panel. There you will find IIS by clicking “Add or Remove Windows Components” (in some cases like Windows Server 2003 IIS is in “Application Server”).
Choose it and follow the install instructions.

To check if the install was correct open your browser and type “localhost” in your navigation bar. You should see the following screen (it’s the default startscreen of the IIS).

Downloading PHP-installer

Here you will find the PHP installer. Download it and follow the instructions of the installer. A simple test should show if the install was correct. Create a simple test.php-file in your webbrowser folder (default IIS folder c:\Inetpub\wwwroot) and try to open it via your browser. I created a simple test.php for you, that you can use to test your PHP by clicking here or download it.

Downloading phpLogCon

For obvious reasons, you need to download phpLogCon.
Load the most recent build from here.

Installing phpLogCon

Perhaps you will need to download and install third party software like WinRAR to unpack the downloaded phpLogCon tar.gz file.

Open the windows explorer and go to the Inetpub\wwwroot folder of your IIS web server, which is the folder where you can place html/php files. Create a new folder called phplogcon there.

If you downloaded and unpacked phpLogCon, copy or move the content of the src folder into the C:\Inetpub\wwwroot\phplogcon folder.

The explorer window should be like in the screenshot now.

Before you can start the real install you have to set write permissions in the settings of the IIS like in the screenshot. Right click on the wwwroot folder -> properties -> security

Now open your phplogcon installation in your favourite webbrowser (localhost/phplogcon), you will see an error, and you will be pointed to the installation script. The install script will guide you through the phplogcon installation, just follow the instructions.

In the first step phpLogCon creates the config.php file in your created phplogcon folder and checks the permissions, if the config.php can be written or not.

In the next steps you can set several basic options.

Number of syslog messages per page = 50 (default)
This is the number of syslog messages displayed on each page. You can increase the value (makes phpLogCon slower) or decrease the value (makes it faster).

Message character limit for the main view = 80 (default)
Set the number of characters per message which will be shown in the last column of the main view. Full messages can be reviewed by hovering the mouse over it.

Show message details popup (default yes) = yes (default)
Here you can set, if you want the small window with the complete message to pop up if you are hovering over a event with the cursor. If you choose “No”, then you have to click on the message to see the details.

Create the first source for syslog messages.
Step 7 is the most important. Here, you will configure your first data source, which holds all your syslog data. Mainly, you have to choose a “Name of the Source” and a “Source Type”. The name will be displayed later in a drop-down menu with which you choose your active syslog source. The “Source Type” can be a file, a MySQL database or the PHP PDO which supports different database types like mssql, PostgreSQL, odbc, oracle or even ibm db2.

If you choose the diskfile,like in our case, you have to provide the following information:
Logline Type = Syslog / Rsyslog (default) or Adiscon WinSyslog
This tells phpLogCon, how the lines look like. This is necessary for showing the log messages properly.

Syslog File = /var/log/syslog (default)
This is the position of the logfile in your file system.
The only thing we have to change is the Syslog File into the folder of your choice. I created a file called Webserver.log in the folder c:\Logs, therefore my screen looks like this.

You are done!

In the next step you finish your install. The last thing you have to do is to delete or rename your install.php in your
c:\Inetpub\wwwroot\phplogcon folder to avoid a reinstall everytime you start your phpLogCon.