How to install MonitorWare Agent in silent mode?

How to install MonitorWare Agent in silent mode?

Created on by Andre Lorbach.

Because MonitorWare Agent is using the Windows Installer (MSIE) it is very easy to start the Installation in silent mode.
There are two ways to do it.

1. Using the MonitorWare Agent msi-file (Only possible if Windows Installer version 2.0 is installed on the target machine)
The msi-file has to be started with the following command line options (Using a sample File location):
msiexec /i C:\SetupFileName.msi /qn

2. Using the WinSyslog setup-file (Only necessary if Windows Installer 2.0 isn’t installed – a reboot might be necessary).
The setup-file has to be started with the following command line options (Using a sample File location):
SetupFileName.exe /v”/qn” /s

For more informations about the Windows Installer command line options see: http://msdn.microsoft.com/library/default.asp?url=/library/en-us/msi/hh/msi/app_73eb.asp.

A complete step by step guide that explains how the reports can be generated with MonitorWare Console

How To Generate Reports with MonitorWare Console Manually (For Windows
Reporting Module – applicable for 2.0)

Article created 2004-03-10 by
Tamsila-Q-Siddique
.

1. You would need Base Product Key and Window Reporting Module Key for this
scenario.

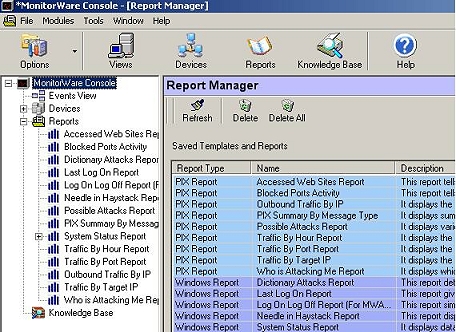
2. Once MonitorWare Console 2.0 is opened, on the left hand side, you can see a
tree view with a node called “Reports”. Click on that node. It will show you
the list of available reports under it as well as on the right hand side. You
will see something similar to the following figure:

You can now click on any of the displayed reports. For the purpose of this
article, I have selected “System Status Report” because it is a very
comprehensive report and summarizes the overall network activity very well.
Once you click on the System Status Report, you will see something similar to
the figure shown below.

Note: Windows Reports are displayed in a band of Lilac whereas the PIX
Reports are displayed in a band of Blue.

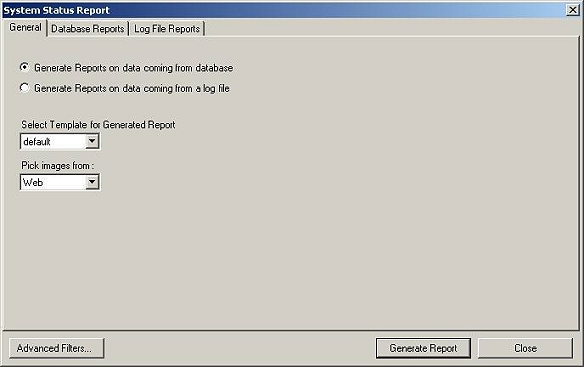
3. Once you click on System Status Report, the following form will be displayed

4. This form displays the report options. If you double clicked on any “Report”,
then in that case, this form will open up with default options that you had
set. (For details about defining global settings, please refer to MonitorWare
Console’s Manual which can be accessed by pressing the Help button in
MonitorWare Console’s tool bar). These settings help you out if you want to
generate many reports with almost the same settings.


Of course, you have the liberty to overwrite these settings. You can generate
reports on the data using the underlying database (even from an another
database) or from a log file.


You have the option of generating the reports on the fly. Even if MonitorWare
Console is connected to some other database, still you can give any DSN, its
user name and its password and the report will be generated on that
particular
database to which the DSN is pointing to. The same approach can be used with
the log files. You can override the default log file settings and MonitorWare
Console can generate reports using some other log file, still you can give Log
File Configurations in the above fields and the report will be generated on
that particular log file.


If “Generate Reports on data coming from database” is checked then all of the
controls on “Log File Reports” tab will be disabled. If “Generate Reports on
data coming from a log file ” is checked then then all of the controls on
“Database Reports” tab will be disabled. It means that these are mutually
exclusive.


You can select various templates for the HTML reports that will be generated
from the general tab and this tab also allows you to pick images from web or
from the local disk


5. MonitorWare Console provides a powerful feature of letting users define and
apply filters on any report. Using this form is further explained in the
upcoming steps, you can apply the filters of your own choice on the underlying
database or on the log files. (For details about the filters, please refer to
MonitorWare Console’s Manual which can be accessed by pressing the Help button
in MonitorWare Console’s tool bar).

Case 1:

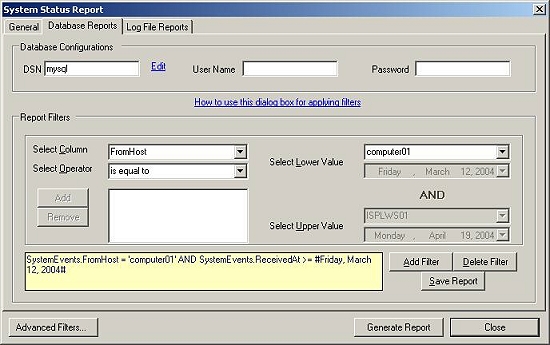
6. Lets assume in this scenario that, I am interested in getting a report for
the records that were logged (into the underlying database) after March 12, 2004
and were from the machine computer01.

7. For this scenario select the “Generate Reports on data coming from database”
option from the general tab. Switch to the Database Reports tab and setup the
filter in the following way:

8. At the bottom left of the screen shot above, you can see there is a button
which is called “Advanced Filters”. The settings made in this form applies on
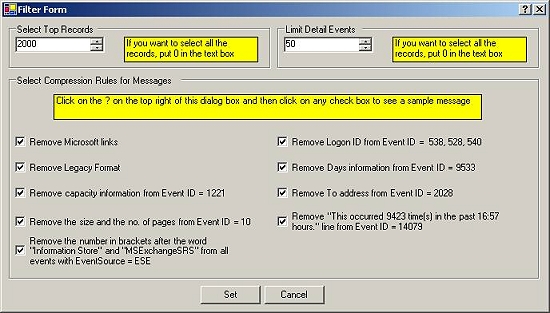
the form as a whole. If you click on this button, a form similar to the one
shown below will pop up:

With this Advanced Filters’ Form, you can specify some additional filters for
the System Status Report. This Advanced Filter form provides an opportunity to
consolidate the records to a great extent. I will give one example to clarify
this. Some events that are generated in the Windows Event Log have the same
message but sometimes contain different Microsoft links. If you select the
check box “Remove Microsoft links” above, it will remove the Microsoft links
before consolidating them and hence a number of different events with count 1
could be consolidated to just a single line. Please note that it doesn’t remove
the information permanently from the database. It just removes this information
for generating this report. Similarly other check boxes can be checked to
provide a greater level of consolidation.

9. Once you define the advanced filters in the form shown above, press the “Set”
button. You will be taken back to the previous Filter From.

10. Once you have defined all the filters, you can actually save all of your
settings by pressing the “Save Report” Button in the Filter Form so that you
don’t have to define these filters daily if you are interested in seeing this
report daily.

11. You can now press the “Generate Report” button. It will open up a report in
HTML format according to your defined filters as shown below: (Please note that
some information has been removed purposely for security reasons)

System
Status Report

In this report, you also have the option of expanding and contracting the node
of From Host, Event Log Type, Event Source and Event Id.

Case 2:


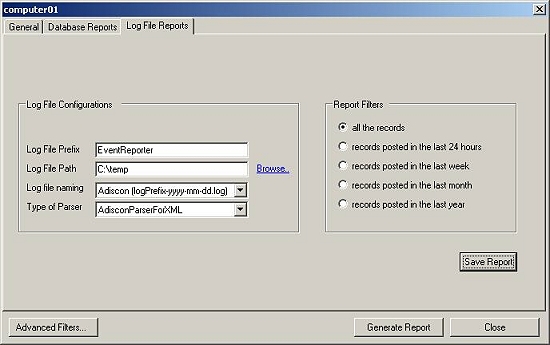
12. Lets assume in this scenario that, I am interested in getting a report on
all the records that were logged (into the log file).


13. For this scenario select the “Generate Reports on data coming from a log
file” option from the general tab. Switch to the Log File Reports tab and setup
the filter in the following way:

14. Once you have defined the filters, you can actually save all of your
settings by pressing the “Save Report” Button in the Filter Form so that you
don’t have to define these filters daily if you are interested in seeing this
report daily.


15. You can now press the “Generate Report” button. It will open up a report in
HTML format according to your defined filters as shown below:

System
Status Report

In this report, you also have the option of expanding and contracting the node
of From Host, Event Log Type, Event Source and Event Id.

Note: You can have a look at other available
Windows Reports
.

Forwarding Windows Events via stunnel to a UNIX/Linux syslogd

Forwarding Windows Events via stunnel to a UNIX/Linux syslogd

Article created 2004-02-04 by Rainer Gerhards.

Windows Event Log data can securely be forwarded to a UNIX/Linux based syslogd via stunnel. This article describes why and how this can be done. It is a mini-howto that primarily focusses on the Windows side because there are many good descriptions for the UNIX/Linux side.

The free stunnel project provides a way to use ssl communication for any non-ssl aware client and server (daemon).

This is done much like a wrapper. Both on the client and on the server machine, tunnel portals are created. The non-ssl aware client and server software is configured to not directly talk to the remote partner, but to the local (s)tunnel portal instead. Stunnel, in turn, takes the data received from the client, encrypts it via ssl, sends it to the remote tunnel portal and that remote portal sends it to the recipient process on the remote machine. The transfer to the portals is done via unencrypted communication. As such, it is vital that the portal and the respective program that is talking to it are on the same machine, otherwise data would travel partly unencrypted.

Tunneling, as done by stunnel, requires connection oriented communication. As such, classical UDP-based syslog can not be used for tunneling. Consequently, you need to use a Syslog implementation that supports TCP, either non-standard raw TCP or one of the newer standards like RFC 3195 (RFC 3195 supports encryption by itself, so it is best to check first if your application supports this – if it does, this is better than setting up a tunnel). Fortunately, Adiscon products support both raw TCP syslog as well as RFC 3195, so you can talk to whatever you have on the UNIX/Linux side.

For this article, I assume that you run syslog-ng on the UNIX/Linux side. It supports raw TCP, only, so this is the mode of choice. I selected this scenario because syslog-ng is quite common and chances are good that you will use it if you think about securely transfering Syslog data to UNIX/Linux. Please note that the stock syslogd does NOT support connection oriented (TCP) syslog, so you need to replace it by something else if you would like to use stunnel.

As I wrote, I try not to duplicate the UNIX/Linux side howto’s available. There is a good one for syslog-ng at http://www.stunnel.org/examples/syslog-ng.html. I will use the settings from this tutorial while setting up the Windows side. Please read through it, and understand how stunnel works before proceeding. If you are more a UNIX/Linux-type admin, it may be a good idea to create a UNIX/Linux only lab according to this howto – this will get you aquainted to the software.

I suggest that you set up your UNIX/Linux environment before proceeding.

You can fully utilize your stunnel knowledge on Windows, because there is an excellent and fully equivalent port available. These are distributed as binaries at http://www.stunnel.org/download/binaries.html – download your copy before proceeding. Copy the files to a location of your choice. If in doubt what you need, download the latest stunnel binary as well as the ZIP file with the openssl libararies. Place everything in the same directory, e.g. c:\bin\stunnel. Please note that the stunnel binary (eg. stunnel-4.04.exe) is the actual stunnel program and NOT a self-extracting exe program.

Once you have done this, you only need to supply stunnel with a correct configuration file. You can use the one from the stunnel UNIX/Linux tutorial, step 5. Make sure that you not only copy over the config file but also the needed .PEM files. You probably need to change the pathes in the stunnel.conf file to reflect your local Windows directory structure.

Once you have the config file ready, you can start the Windows stunnel. Please note that it by default starts interactively. If all goes well, there is a small icon in the icon tray. Double-Click it to get a status window. If something goes wrong, the status window automatically appears with a nice error message.

Let’s assume all went well. What is left is that we must tell the event log monitor where to forward events to. This method applies to both the EventReporter and the MonitorWare Agent product. Both of them allow forwarding events via the “forward syslog” action. You need to configure this action to use TCP for the transport. Then, you must set the address of the syslog server (receiver) to 127.0.0.1, the local machine. This is important, because you will no longer directly talk to the remote server but to the local stunnel portal instead! The port number must be set to where the stunnel portal is listening, port 514 in this example.

Please note that it may be clever to change this port number to something different form 514 (e.g. to 2514) because 514 may conflict with a syslog server process running on the same machine. If you change it, make sure that you change it both in EventReporter or MonitorWare Agent AND the client stunnel.conf file. I am sticking with the default of 514 soley because I would like to keep things as consistent with the UNIX/Linux tutorial as possible.

Once you have configured the event log monitor, you can restart the EventReporter or MonitorWare Agent service and should see messages traveling via the stunnel (assumed that the UNIX/Linux server part is already running…).

The remaining thing needed to do is to set stunnel to run non-interactively as a Windows service. This can be done with “stunnel.exe -install”. If in doubt, see the stunnel documentation.

If you have sucessfully followed these steps, you have a logging system that extracts Windows event log data and securely forwards it to a central syslog daemon on UNIX/Linux. Please note that you could also transfer IIS logs, other text files, database contents and a wealth of other important state information if you use MonitorWare Agent. As the stunnel works in combination with the “forward syslog” action, you can use it together with any data source supported by the product.

If you can’t find the links…

Don’t worry! I am used to disappearing sites and information. As such, I have cached a (PDF) copy of the UNIX/Linux syslog-ng stunnel tutorial, the stunnel windows binary, the stunnel source and the openssl binaries at the time of this writing. This material is kind of last resort and most probably outdated. I strongly recommend visiting www.stunnel.org to get it directly from the source.

How can I copy the current configuration to the other servers?

How can I copy the current configuration to the other servers?

Created 2004-01-26 by Tamsila-Q-Siddique

I have got “x” number of copies of EventReporter, MonitorWare Agent or Winsyslog. How can I copy the current configuration to the other servers so we can save time? I want to copy all of the services and rulesets I’ve setup on my server.

Please do the following:

  1. Go to Computer Menu-> Export Settings to Registry-File (Not Binary).
  2. Save this registry file.

Now put this registry file in a shared folder. Then on each computer you would just have to double click on it. When you double click on this registry file it would simply import your registry settings into EventReporter, MonitorWare Agent or WinSyslog. When you open the EventReporter, MonitorWare Agent, or WinSyslog you would see your configured rules and services.

Note: If you are using Windows XP / Windows 2000 and want to export your settings from EventReporter, MonitorWare Agent or WinSyslog to WinNT 4.0 machine then follow the following steps:

  1. Start -> Run.
  2. Type “regedit” and click ok – Now the Registry Editor is opened.
  3. Navigate to HKEY_LOCAL_MACHINE\SOFTWARE\Adiscon\EventReporter (MonitorWare Agent or WinSyslog) click on the “EventReporter” (MonitorWare Agent, WinSyslog) folder.
  4. Go to Registry Menu -> Export Registry File…
  5. Now give the file a name, like “myeventconfig” and change the “Save as type” to “Win9x/NT4 Registration Files (REGEDIT4)”.

Now you have a registry file that can be used for distributing your configuration across your WinNT 4.0 machines. If you don’t follow this procedure, you will not be able to distribute your Windows XP / Windows 2000 registry file to NT machines.

Do I need a new Key for an Upgrade?

Do I need a new Key for an Upgrade?

Created 2004-01-23 by Tamsila-Q-Siddique

Will the same key work when I upgrade from 1.x version to 2.x version?

You can use this license key for any 1.x version of MonitorWare Agent. But this license key will not work if you want to upgrade from 1.x to 2.x and it will also not work if you want to switch from e.g. professional edition to enterprise edition. It calls for a new license. If you had got a new license and aren’t sure what to do follow these simple procedure.

Note1: But if you have got an UpgradeInsurance ID please contact support@adiscon.com for further details.

Note2: We assume you already have installed the trial version. If you do not have it installed, please visit the product web site and download and install the product first.

  1. Download MonitorWare Agent from http://www.mwagent.com/en/Download/
  2. After downloading the software start the client application.
  3. Switch to the “License” tab.
  4. Enter the License Name and License Key into the respective fields.
  5. Click “OK”

This process will switch the product from the trial version to the licensed one. Be sure to enter the license name and license key exactly as provided by us. Remember that the license key information is case-sensitive. Documentation on how to enter the license key is in the manual. If you still encounter problems, please go throught this License Information FAQ.

Note3: Different Editions and Versions of MonitorWare Agent are availabe.

What does Event ID 1011 mean?

What does Event ID 1011 mean?

Created 2004-01-16 by Tamsila-Q-Siddique

What does event 1011 mean?

Our MonitorWare Line of Products e.g. EventReporter, MonitorWare Agent etc. periodically reads the Windows Event Log. While reading the Windows Event Log, they try to read the last record that was processed in the last run. We had opt for this, because if the last record doesn’t exist, then either someone had messed up with the Windows Event Log or the Windows Event Log was truncated. When MonitorWare Line of Products can not read the last record, then two things happen:

  1. MonitorWare Line of Products send an Event ID 1011 to the Application Event Log stating that the Log has been truncated (this can be disabled by unchecking the “Report Log Truncation” checkbox in the configuration program).
  2. MonitorWare Line of Products re-set the counter to the begining of the Windows Event Log.

Number 2 is done because there is no better way to resume processing, especially when the last record could not be found (it would be guessing where to begin). Please note that this can lead to message duplication.

This condition is normal when someone has cleared the event log in question. However, if that is not the case, seeing an 1011 event is a good indication that somebody has messed up with the event logs.

If you receive multiple 1010 events and you know this is fine based on your configuration, you may want to look at our step-by-step guide to limiting the number of consecutive events received.

2004-01-16 Hotfix for MonitorWare Agent 2.0 released

Hotfix for MonitorWare Agent 2.0 released

During code review, Adiscon has found a potential bug in MonitorWare Agent which can lead to an agent abort (addressing fault) when the “discard” action is used. We have not yet received any customer reports on this problem. However, we advise all customers to apply the hotfix. Please note that this bug is not depending on the data from processed events, so it can not be exploited as a security weakness. Continue reading “2004-01-16 Hotfix for MonitorWare Agent 2.0 released”

What is the difference between MonitorWare Agent Workstation and Server?

What is the difference between MonitorWare Agent Workstation and Server?

Created 2004-01-13 by Rainer Gerhards

What is the difference between MonitorWare Agent Workstation (WS) and Server (SRV)?

The basic difference is based on the operating system the product runs on. If it is a workstations operating system like Windows XP, you need MonitorWare Agent Workstation. If it is a server Operating System like Windows Server 2003, you need the Server version. Other than that, some limits are different for the different editions.

To learn these exact differences, please visit the MonitorWare Agent Edition Comparison sheet. Please note that in that sheet “WS” means the workstation version while “SRV” means the server version.

Performance Optimizing Syslog Server

Performance Optimizing Syslog Server


Do you want to receive syslog in a Windows environment? Take a look at WinSyslog!

Receive, process and store your syslog data from routers, firewalls or linux/unix servers with this easy to configure application in your Windows environment. Troubleshoot network problems or be alerted, all quickly and easily.

Take a Quick Tour to WinSyslog to know more about its exciting features or directly download the free and full-featured 30 day trial version.


Article created 2004-01-09 by Rainer Gerhards.

We are quite often asked how many syslog message per second MonitorWare Agent can receive. The answer is not as simple as it may look. It largely depends. So I finally thought I write this brief article on the factors that influence syslog server performance. Obviously, you can also use it as a rough guide to optimizing your setup.

Let me try to outline a few factors influencing the performance.

To get started, you should know that MonitorWare Agent is optimized for large traffic bursts. A little understanding on how it is done helps to understand hardware sizing issues. MonitorWare Agent is multithreaded. There are threads that receive messages and there are threads that process them. These two thread types are loosely coupled via an in-memory queue. The receiver threads (by default) have a higher priority than the processing threads. So what happens when a lot of traffic comes in is that the receiver threads very fast receive the messages and store them in memory. The messages are only processed by the processing threads when no receiving thread is using the system. So on a busy system, an in-memory queue of received but unprocessed messages is build up. Obviously, if the machine continuously receives messages at a very high rate the in-memory buffer fills up and received data begins to get lost. However, this design guarantees that as many messages can be received as the machine is capable of. At least for traffic bursts, this de-couples the receive ability from the speed of the rule set actions.

This – the rule set – is another very important factor in deciding how many messages a given system can process. Naturally, writing received messages to a file is much less performance-intense than writing to a database. A small rule set with only a single rule, no filters and a single action is also faster to process than a complex rule set with many rules, complex filters and actions. Of course, MonitorWare Agent is optimized to process complex rule sets quickly… but even this takes time. So If you would like to squeeze the most out of a given machine (or need to process vast amounts of incoming messages), it is worth tweaking the rule set. If you would like to build a high-traffic central syslog server for creating a central archive… just do that. Create a rule set with a single rule, no filters and just a “write to file” (NOT “write to database”!) action. This will give you the optimal performance.

For a highest performance, you will obviously dedicate a machine just to MonitorWare Agent. Most importantly, if you must log to a database, make sure the database server is on a different hardware! Database server software needs considerable CPU resources and you will definitely not like to take them away from your syslog server. If you use a remote database, however, you will make sure that the network connection to it is well. So you should invest in a good 1 GB ethernet board and create an exclusive connection between your syslog and your database server (you may use an otherwise not connected ethernet switch).

OK, now we have arrived at hardware. Of course, the faster the box, the better. Add plenty of memory to take care for traffic bursts. The more physical memory the machine has, the better it can process traffic bursts. If you do not expect traffic bursts, memory is not that important. However, it is advisable to add some extra memory just for the case of unusual amounts of messages, e.g. caused by a malware outbreak or other exceptional situations.

A fast CPU is obviously important. Multiple fast CPUs are better. Due to our threading nature, multiple CPUs are very efficiently used. However, do not add CPUs without reason. If you have a central server wich just runs one syslog service (eg at standard port 514) and one rule that writes the messages to a file, you actually have 2 “real” threads running (plus a little overhead). So it obviously is a good idea to have at least two CPUs. A third CPU may bring some extra performance, but I would expect only a moderate increase. A fourth or any more CPU will not do any good – at best, they idle, at worst they add OS overhead. So for a typical configuration, a dual-CPU system is the best fit. If you run multiple listeners, additional CPUs help to improve performance greatly. They scale more or less one-to-one. Adding CPUs does not equally well work to improve complex ruleset performance. This stems back to some of the internal ordered queue handling and the need to keep things in order. So as another general advise, it is good to add CPUs for additional listeners but does seldomly make sense to take care of for complex rule set.

If your store data locally, you would obviously like to have as fast hard disk as you like. If you plan for highest performance, stay away from raid-5 arrays. They have bad write performance. Use RAID 0 + 1 instead. Use it at the hardware level! Make sure that the disk is defragmented – this is often overlooked. On a fast, defragmented disk, MonitorWare Agent’s file monitor can actually “stream” messages right to the hardware. It does not need to seek on disk, so you can expect performance close to the disk’s physical maximum.

You intend to shuffle a lot of data through the system – make sure you motherboard is well designed. We have seen bad motherboards slowing down an otherwise well-capable system.

Most importantly, make sure the system can talk nicely to the network. Use a brand, high performance busmastering NIC (network interface card). I am in favor of brand hardware because of the drivers. Most brand products come with drivers that actually allow you to leverage the hardware. Some (but definitely not all) non-brand cards may come with more or less the same hardware, but too slow drivers. If you expect high traffic make sure your card can handle this. If in doubt, add a second or third card. If you do, make sure it is connected to a different switch, otherwise the switch may become the bottleneck.

In general, make sure that the network is capable of carrying the traffic. This is especially important if log data is flowing in via the WAN.

Another factor greatly influencing MonitorWare’s performance is the syslog protocol used. UDP provides the lowest overhead, but for obvious reasons messages which can not be received are lost. TCP based logging comes with some overhead, but it will guarantee that all messages are received – at least until the sender is internally overrun). So TCP based protocols lower the absolute reception rate, but are often a better choice because they offer a much better guarantee that no data is lost (there is no 100% guarantee, but this is finally beyond the scope of this discussion). Please note that there are multiple options for TCP delivery nowadays – “plain” TCP (not standardized) and RFC 3195 compliant “syslog-reliable”. The later is more reliable but unfortunately very seldomly found in actual devices today. Even “plain” TCP is implemented only in few devices, so this may limit your choices to UDP in the actual case. Keep in mind, however, that MonitorWare Agent can run multiple listeners. So you could, for example, run three listeners, one for RFC 3195, one for “plain” TCP and one for UDP (as a reminder, a 4 CPU system would play nicely with that). Using multiple listeners brings you the best of all worlds. Please note that by default the TCP based listeners have a lower thread priority, so this also gives you a little more headroom when it comes to UDP bursts.

Finally, think about the message sender (the “device”, may of course also be another server emitting syslog messages). In rare circumstances (worm outbreak) it may happen that the sender itself exhausts its resources and is not capable to actually send all messages over the network. With UDP, this may simply happen because the (not very large) IP stack send buffer overflows. Even with TCP it can happen – it just can’t happen at the protocol level. But the application emitting syslog messages may overflow its internal buffers so that the data never makes it to the TCP queue. While sender overrun is seldomly experienced (and even more seldomly detected as such!), it has happened in reality and may happen to you.

The especially bad thing about an sender emitting massive amounts of data is that it may also overrun other parts of the whole network, thus affecting otherwise unaffected systems. Recent Internet worms have provided good examples of this in the wild. So if you can tune the sender, try to place some safeguards in there. For example, you could limit the amount of messages of a specific type that are sent within a specific period of time. Or, as another example, you can set MonitorWare’s Windows event log monitor to emit only 10 messages per second. If you do this, you may loose some message from the Windows box in case some malware takes it over, but you keep the rest of your syslog system healthy.

I hope this clarifies at least many of the important factors behind syslog server performance. And now back to the basic question: how many messages can MonitorWare Agent handle? Honestly, I don’t know. You may now better understand why I do not. It depends on what you do with it. I know, however, that we have quite some customers processing vast amounts of data, including burst traffic with our products. On the other extreme, in our lab, I have configured MonitorWare Agent to write log data to an Microsoft Access database on a diskette drive… It could handle large bursts, but it took hours to write the messages to the database… 😉
2004-01-06 MonitorWare Agent 2.0 released

MonitorWare Agent 2.0 Released

Adiscon today announced the immediate availability of MonitorWare Agent 2.0.
“I am pleased to announce the new 2.0 version” says president Rainer Gerhards “With this release, we managed to even further increase the fexibility of our flagship monitoring agent” Continue reading “2004-01-06 MonitorWare Agent 2.0 released”