MonitorWare Agent 10.2 Released
Build-IDs: Service 10.2.466, Client 10.2.0.1559
Features |
|
Bugfixes |
|
You can download Free Trial Version of MonitorWare Agent.
Log Consolidator and Alerter
Build-IDs: Service 10.2.466, Client 10.2.0.1559
Features |
|
Bugfixes |
|
You can download Free Trial Version of MonitorWare Agent.
Adiscon is proud to announce the 8.2 release of MonitorWare Agent. This is a minor release.
This release contains new features for the File Monitor, Database Monitor and the Write to File Action as well as a bugfix for the SNMP Trap Receiver.
For more details read the version history
Version 8.2 is a free download. Customers with existing 11.x keys can contact our Sales department for upgrade prices. If you have a valid Upgrade Insurance ID, you can request a free new key by sending your Upgrade Insurance ID to sales@adiscon.com. Please note that the download enables the free 30-day trial version if used without a key – so you can right now go ahead and evaluate it.
Build-IDs: Service 8.2.418, Client 8.2.1358
Features |
|
Bugfixes |
|
You can download Free Trial Version of MonitorWare Agent.
Article created 2004-09-14 by Timm Herget.
Last Updated 2011-07-27 by Florian Riedl.
This is a very quick step-by-step guide. It essentially is a step in multiple
configurations. You can refer to this guide whenever you need to add
database logging to one of your services.
Though we need to add some sidenotes for issues with 32/64bit systems. If you have a operating system
which is a 64bit edition, the installer for EventReporter, MonitorWare Agent or WinSyslog will automatically
install the appropriate binaries (64bit) on the system. The problem is now, that generally the 32bit drivers for ODBC
would work fine, but 64bit applications can only use drivers that are for 64bit as well. Therefore it is best
to make sure, that you have installed the 64bit ODBC drivers as well. This does only apply for MSSQL and MySQL databases. If you are trying to use a JET database with Adiscon’s products on a 64bit system, you’re in bad luck, since there are no 64bit ODBC drivers available.
MSSQL Enterprise Manager
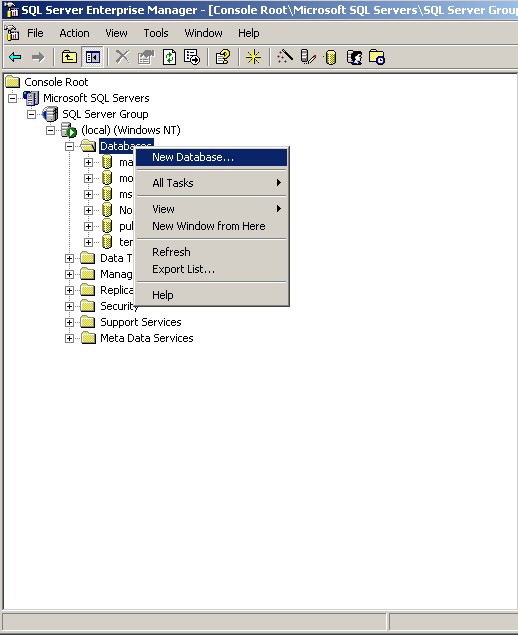
1. To create a new Database, open up the Microsoft SQL Enterprise Manager.
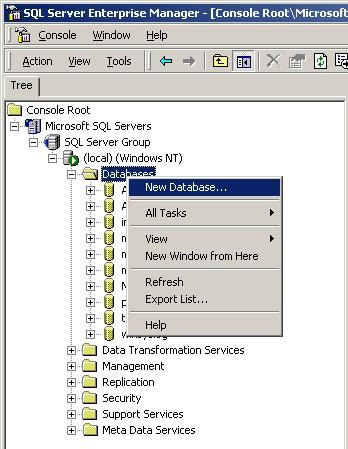
2. Right-click on “Databases” and select “New Database”.
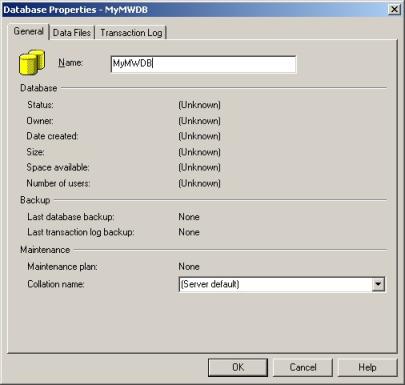
3. Select a Database Name there and click “OK”.
ODBC Data Source Administrator
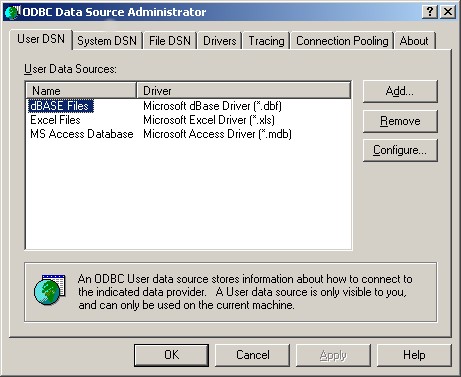
After you created the new Database, go to the Control Panel -> Administrative Tools and open up “Data Sources (ODBC)”.
The following Window will appear:
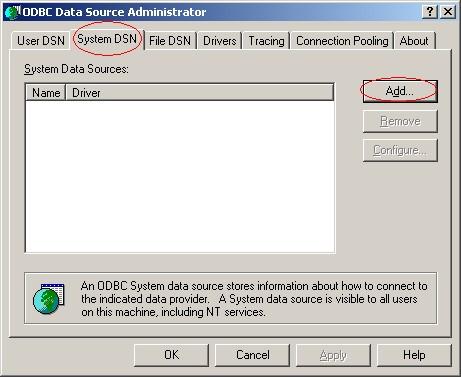
4. Click on “System DSN” and then “Add…”.
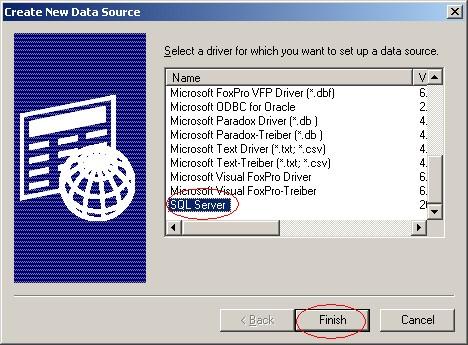
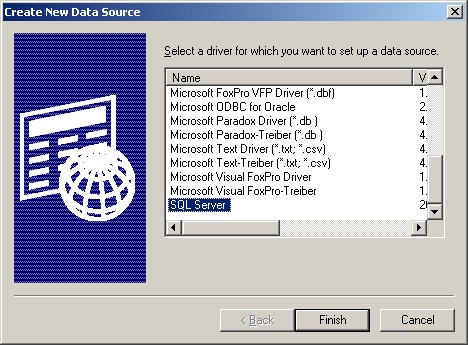
5. Select “SQL Server” as Driver from the List and click “Finish”.
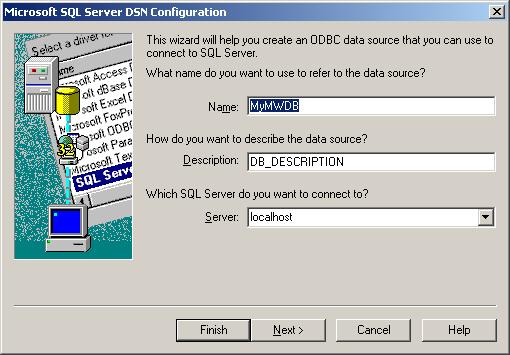
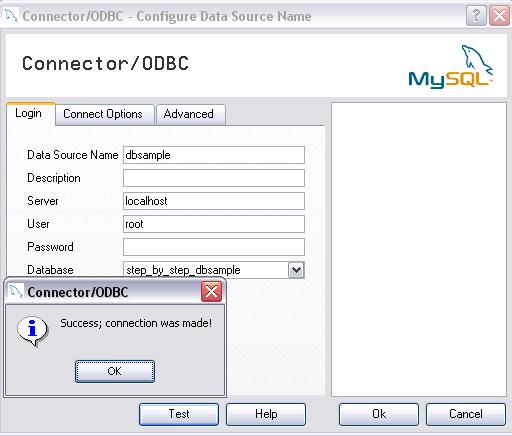
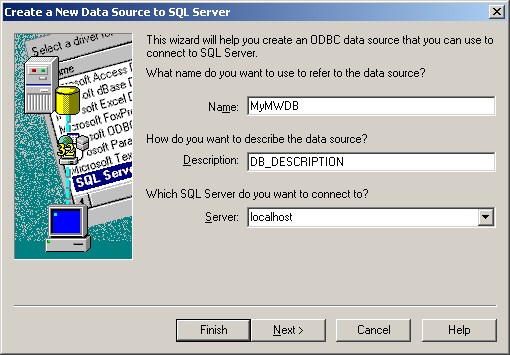
6. Choose a Datasource Name, Description and select the Server where the Database is. In our example we use “localhost”.
Click on “Next”.
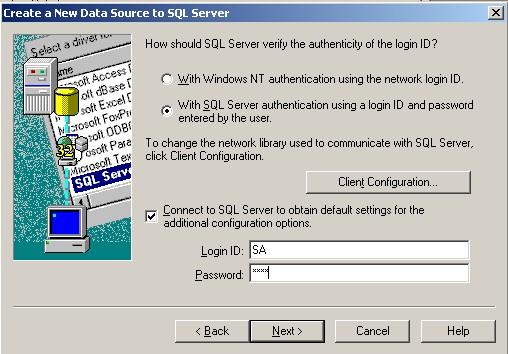
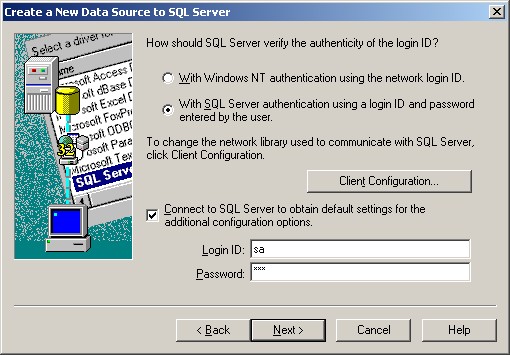
7. Select “SQL Server Authentication” and type in your MSSQL Login ID and Password. Click on “Next”.
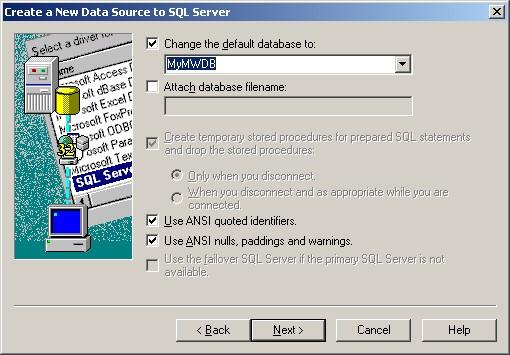
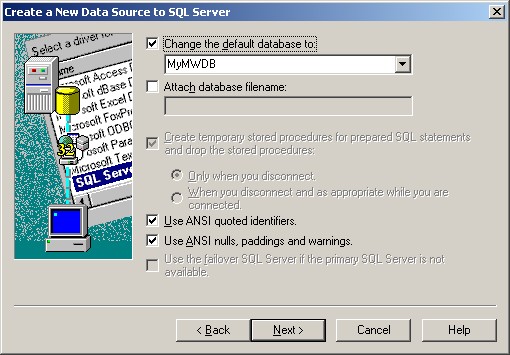
8. Select “Change the default Database to:” and choose your new created Database, in our example we use “MyMWDB”. Click on “Next”.
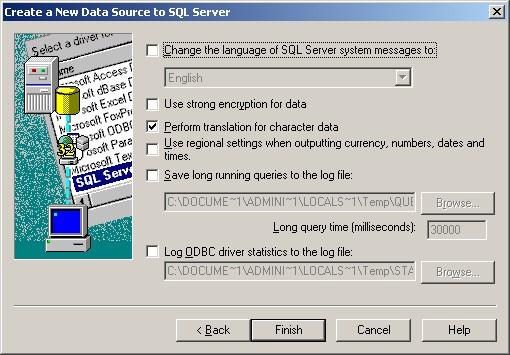
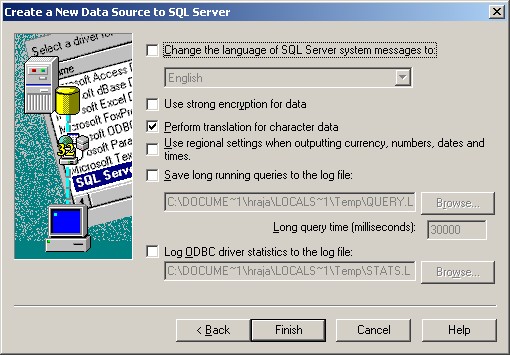
9. Leave all at default settings and click “Finish”, a test Window will appear:
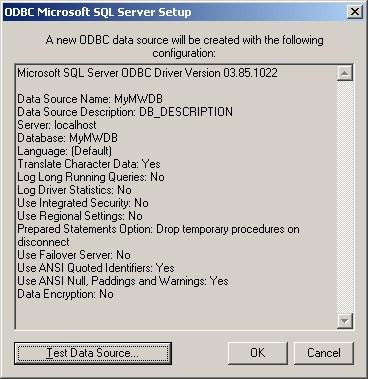
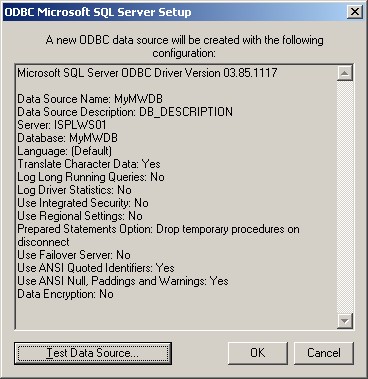
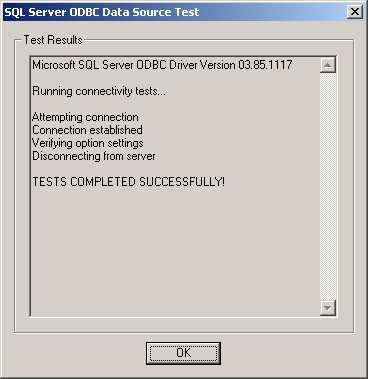
10. Click on “Test Data Source”, normally the following Window should be displayed:
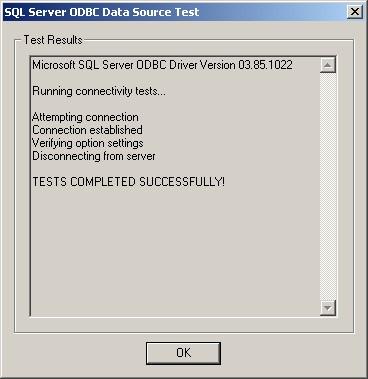
11. If not, go back and check your Settings, if yes, Click “OK” and exit the System-DSN Wizard.
Monitor Ware Line Product
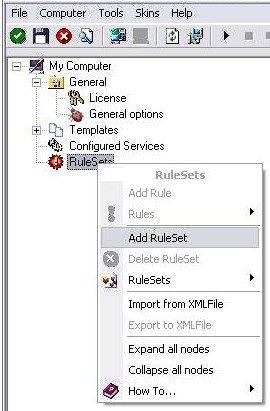
12. To define a new rule set, right click “Rules”. A pop up menu will
appear. Select “Add Rule Set” from this menu.
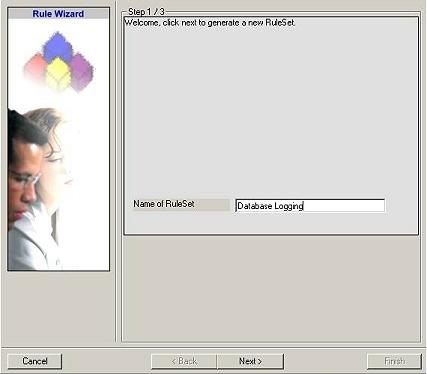
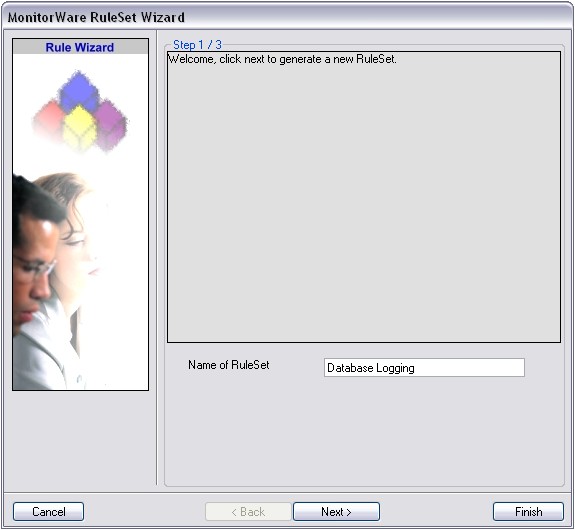
13. Then, a wizard starts. Change the name of the rule set to whatever name you
like. We will use “Database Logging” in this example. The screen
looks as follows:
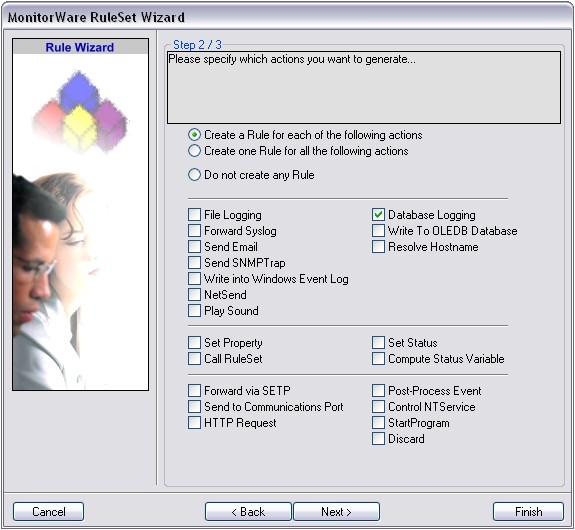
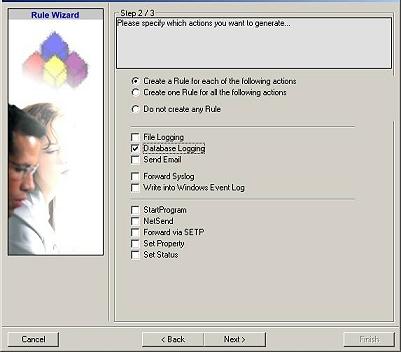
14. Click “Next”. A new wizard page appears:
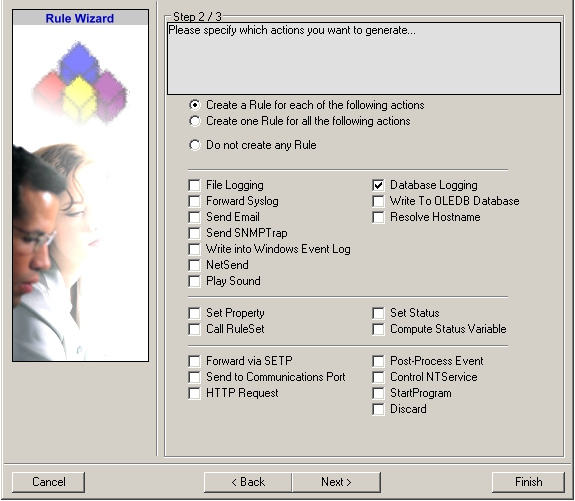
15. Select only Database Logging. Do not select any other options for this sample.
Also, leave the “Create a Rule for each of the following actions”
setting selected. Click “Next”. You will see a confirmation page.
Click “Finish” to create the rule set.
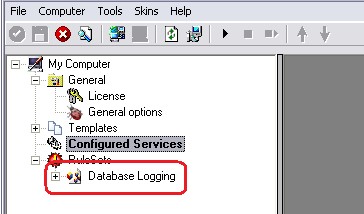
16. The wizard closes and the client shows a newly created rule set.
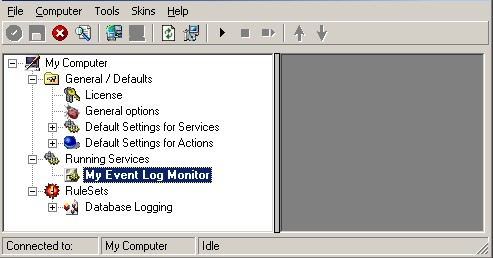
17. As you can see, the new Rule Set “Database Logging” is present. Please
expand it in the tree view until the action level of the “Database
Logging” Rule and select the “Database Logging” action to
configure.
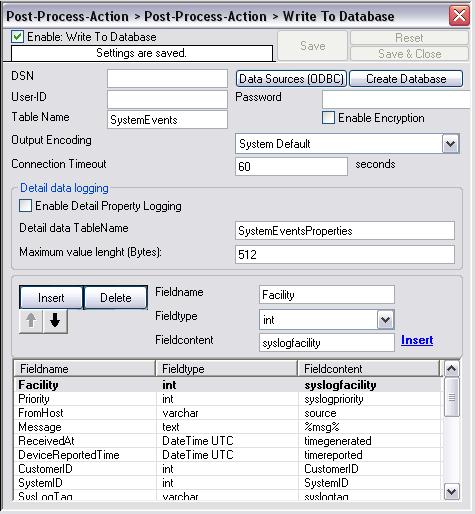
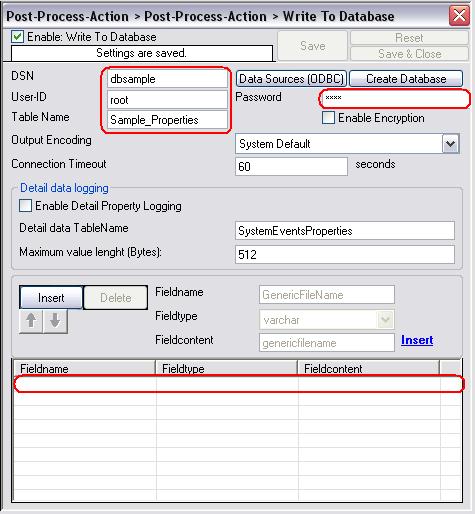
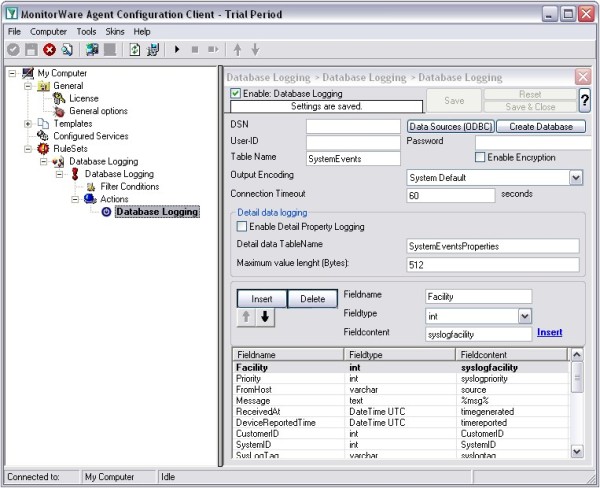
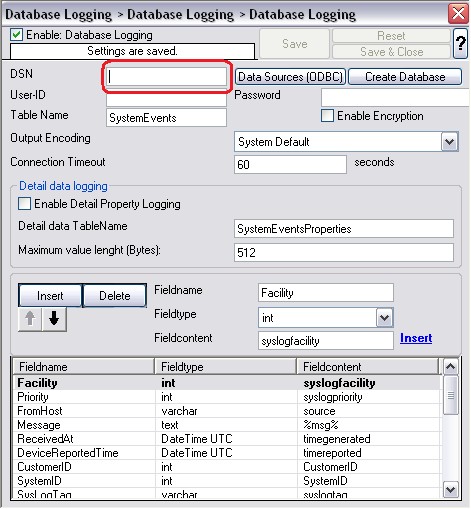
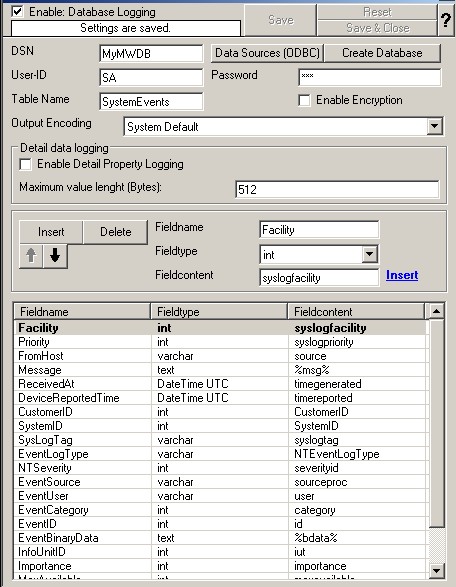
You will see the following Window now:
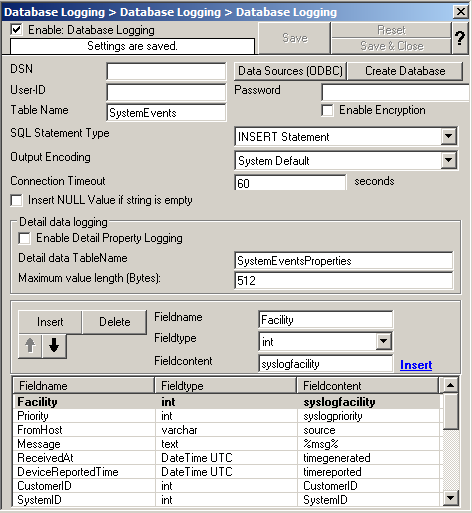
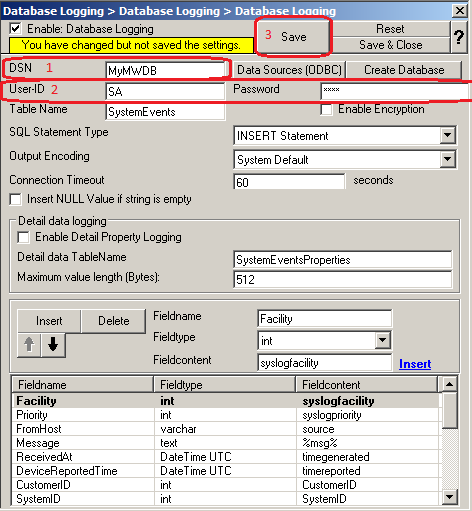
18. Type in your DSN, User-ID and Password now and press “Save”.
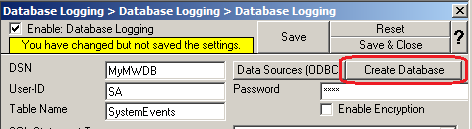
19. Click on the “Create Database” Button to let the Programm create the Adiscon-Table-Layout in your Database.
Done 🙂
The central log server is the most important part of our central log storage and thus will be configured as the first part. And due to all the things it needs to do, it has the most work of course. When selecting your machine to install the central log server on, please keep in mind, that you need quite a good machine for larger networks. If you have a very large environment, it might be a good idea to use multiple servers for this scenario with a load balancer and a separate database server. But in this guide, we will have it all on one machine.
Prerequisites:
The following should be installed and working:
The list holds the things necessarily needed. In the brackets is schon which we will use in this example. Please note, that this will work with other versions as well, especially with MonitorWare Agent.
As mentioned before, MonitorWare Agent will have multiple purposes. It should receive syslog via TCP and UDP, monitor the local EventLog and textbased logfiles as well as writing everything into a database and sending email messages in case of error and critical messages occuring.
First of all, we will set up the processing rules and actions. We will start this way due to the design of MonitorWare Agent. Since the Services need to be bound to a ruleset upon creation, we will start this way, so the ruleset is there already when creating the service.
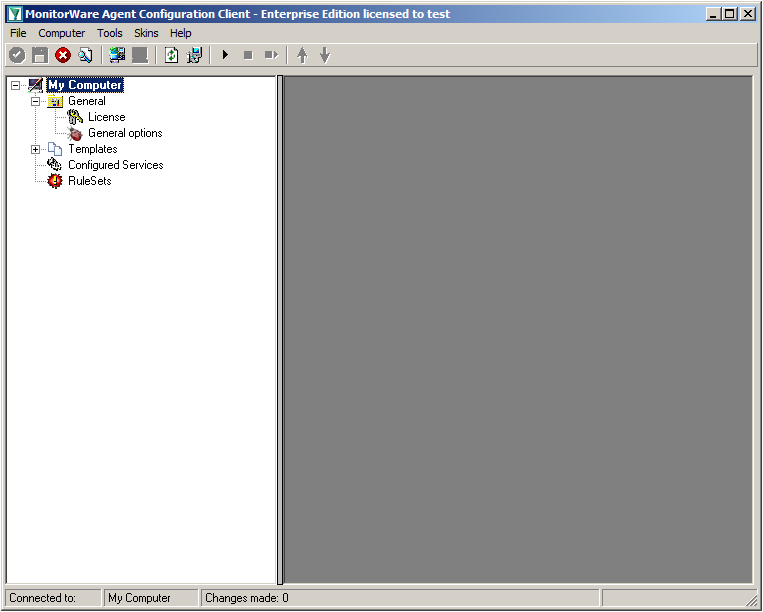
When starting MonitorWare Agent the first time, you will see on the lefthand side our overview of “Configured Services” and “Rulesets”. Right now, there shouldn’t be any entries here.
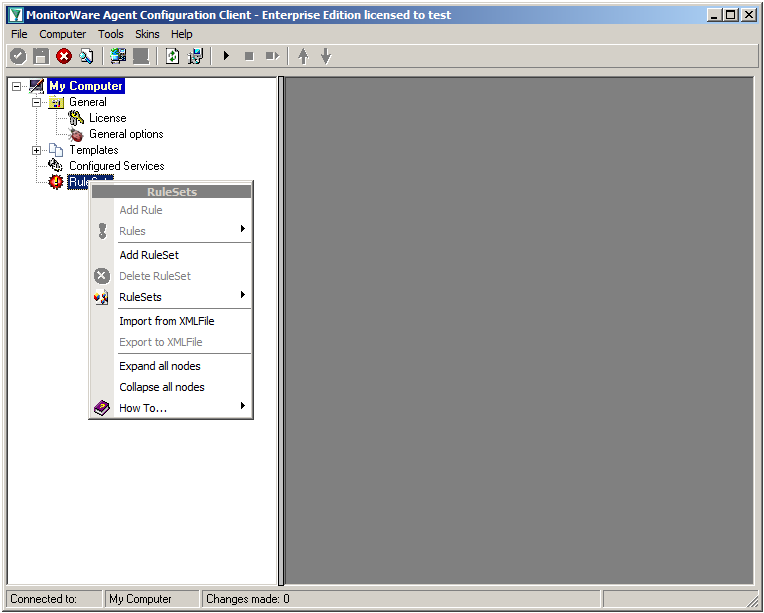
Right click on “Rulesets”. A context-menu will open.
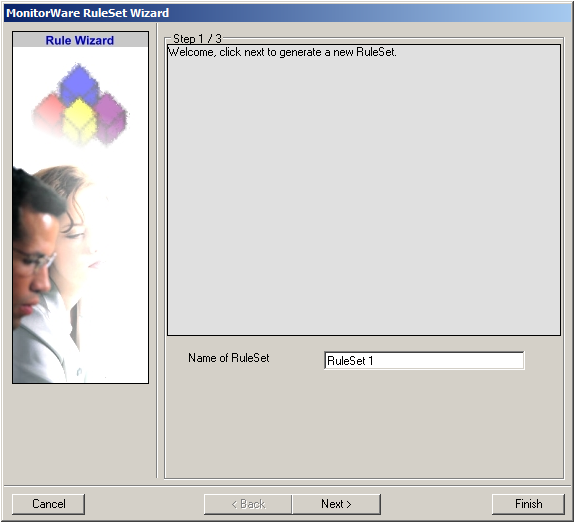
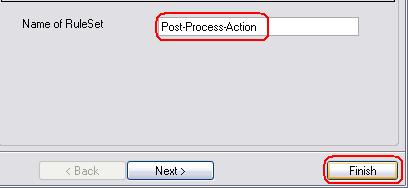
Choose “Add Ruleset”. The ruleset wizard will open. On this first screen, we can choose the name of the ruleset.
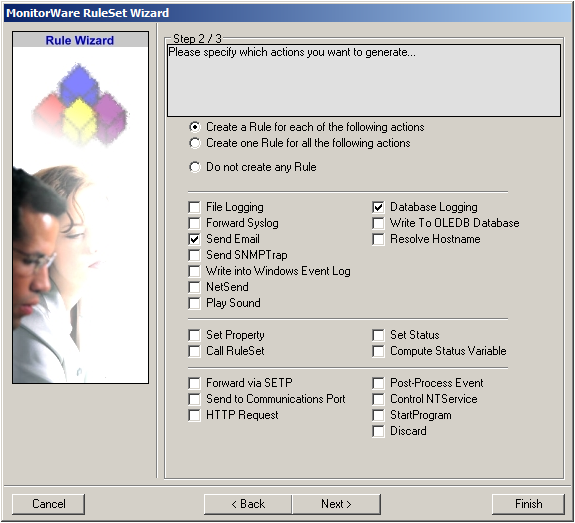
After choosing a name (in this example “Storage & Alert”), click on “Next”. Here we can set, what we will need. Leave the marker for “Create a Rule for each of the following actions” and choose “Send Email” and “Database Logging”.
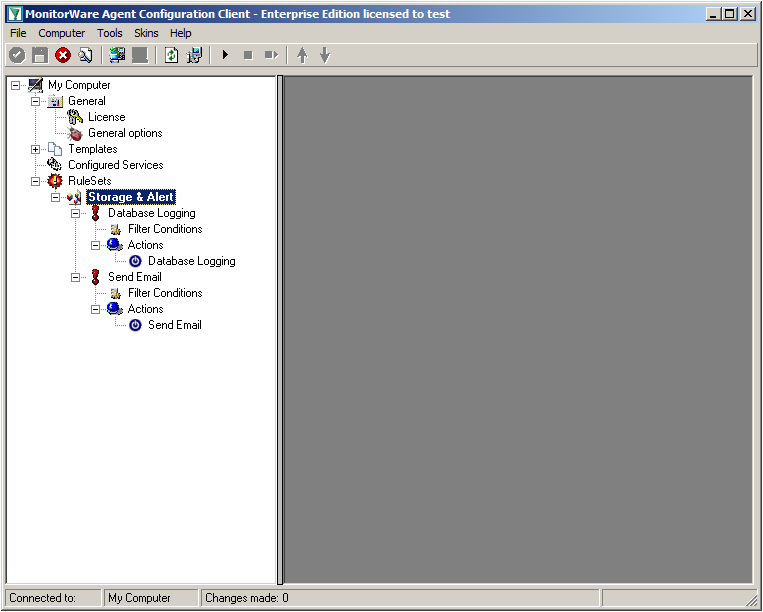
You can now click on Finish. You will now see a new ruleset in the treeview on the left hand side. If you expand this view completely, you can see the two rules that have been created and the actions that are in there. You should have a rule “Database Logging” and a rule “Send Email”.
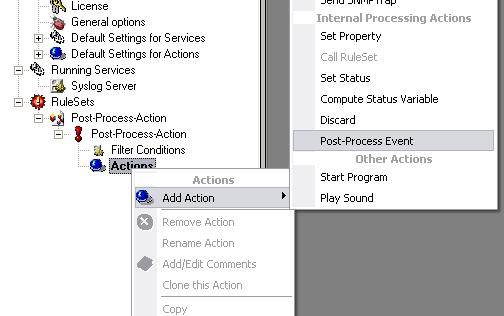
We will now start with configuring the action for “Database Logging”. Expand the branch called “Database Logging” completely. Under actions you will find the “Database Logging” action. When you click it, you will see the configuration window.
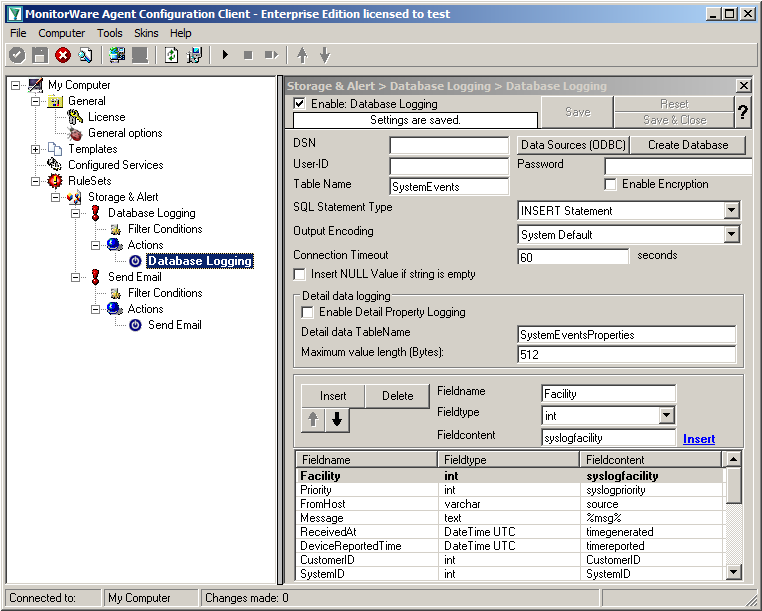
Click on the button “Data Source (ODBC)”. This will open the ODBC Data Source Administrator.
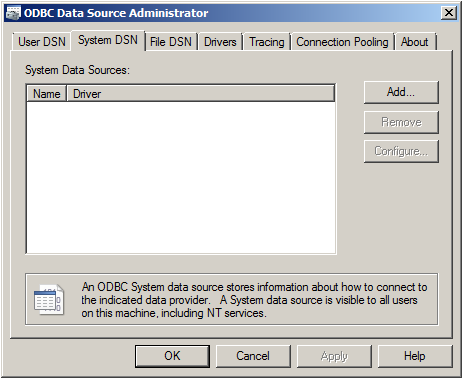
Go to System DSN and click “Add…”.
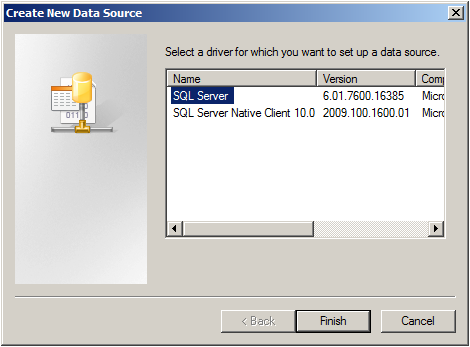
Select SQL Server from the list and click “Finish”.
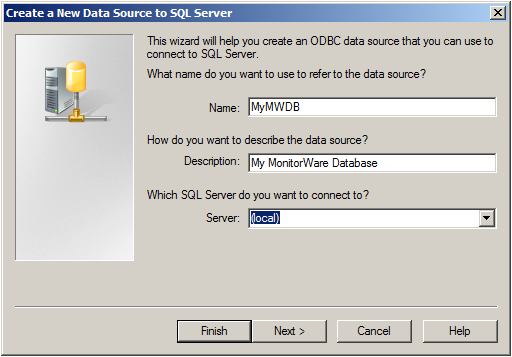
Choose a name for the datasource and a description. In this case we choose MyMWDB as name. As server choose the name of the server where the database is. In our example we use localhost. Now click on “Next”.
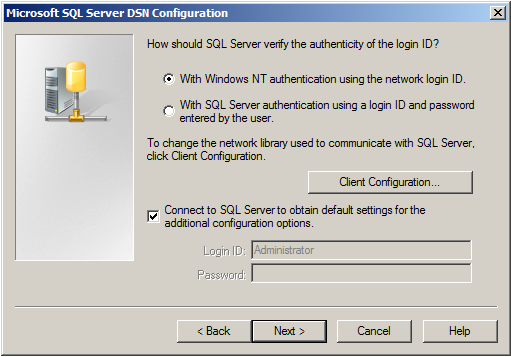
Select “SQL Server Authentication” and type in your MSSQL Login ID and Password. If you have Windows NT authentication like in our case, leave it as is. Click on “Next”.
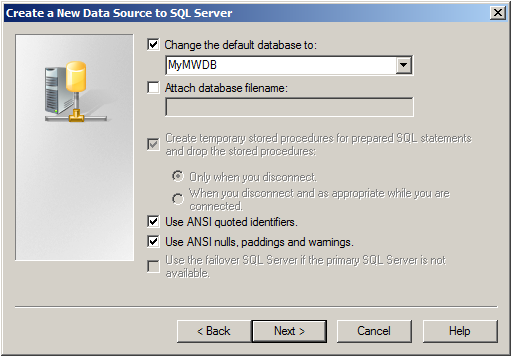
Select “Change the default Database to:” and choose your new created Database, in our example we use “MyMWDB” which we created beforehand. Click on “Next”.
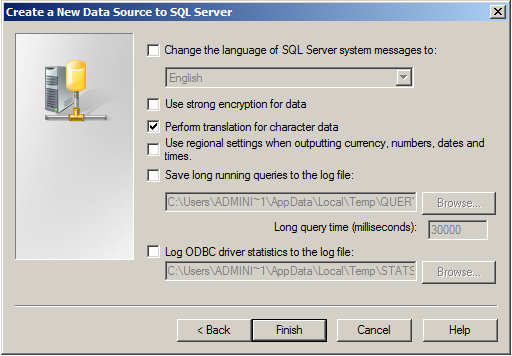
Leave all at default settings and click “Finish”, a test Window will appear:
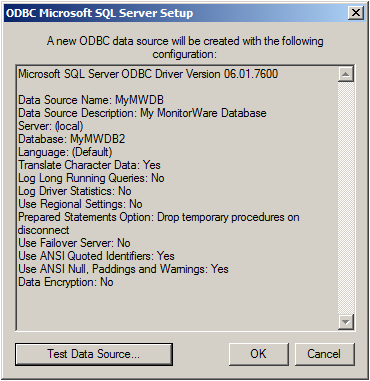
Click on “Test Data Source”, normally the following Window should be displayed:
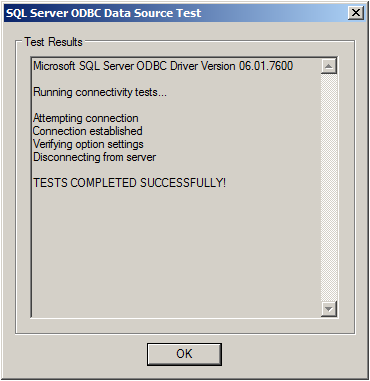
If not, go back and check your Settings, if yes, Click “OK” and exit the System-DSN Wizard.
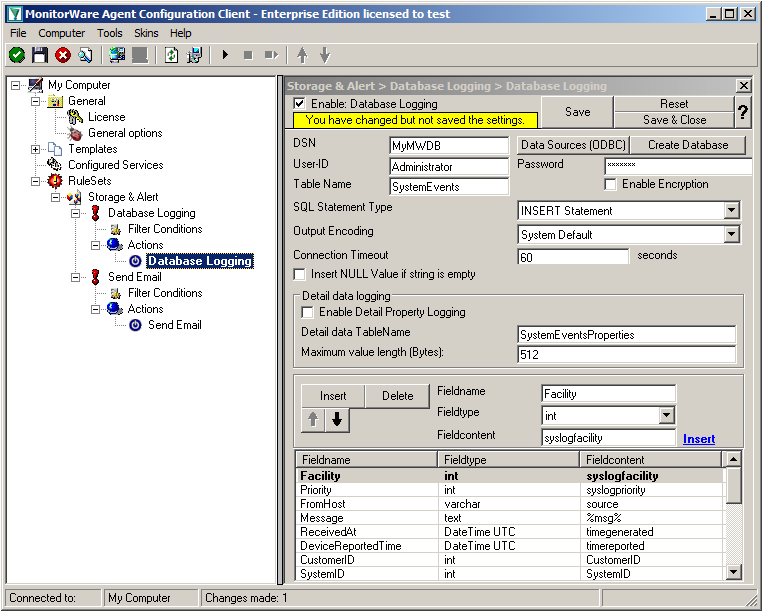
Now we are back in MonitorWare Agent. Insert the DSN for your database, User-ID and Password.
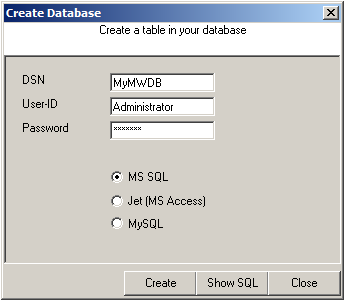
After that, click the “Create Database” button. We still need the tables that the log messages will be stored in. After clicking the button, a small window will open. Insert the DSN, User-ID, Password and choose the type of database you are using, in our case MS SQL. By clicking on the “Create” Button, the tables needed for the default database format of the MonitorWare Products will be created. After that, close the window.
Since we want to log all messages into the database, there is no need to set up any filters.
In the next step, we want to set up the Send Email rule. But since we only want error log messages, we need to set some filters. Click on the Filter Conditions. You will see the overview over the filters for this rule.
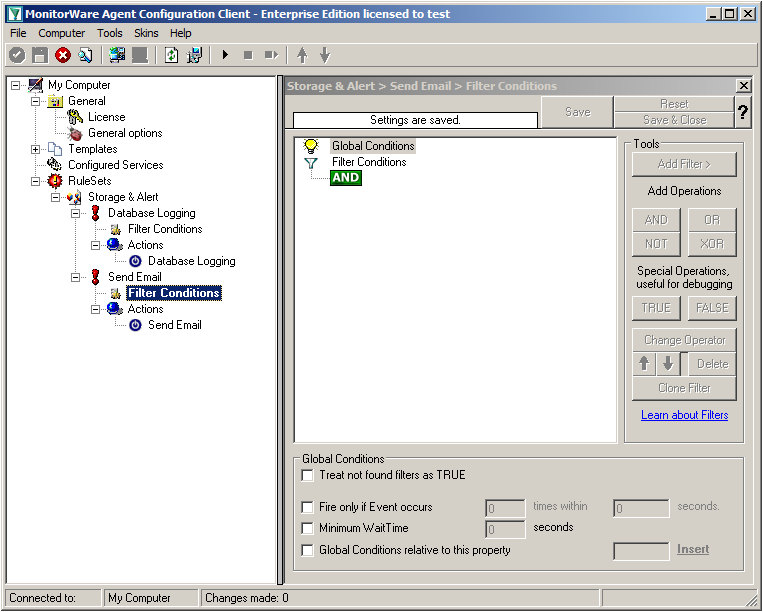
Right now, the view is empty except for a AND operator. Double-click it to change it into a OR operator.
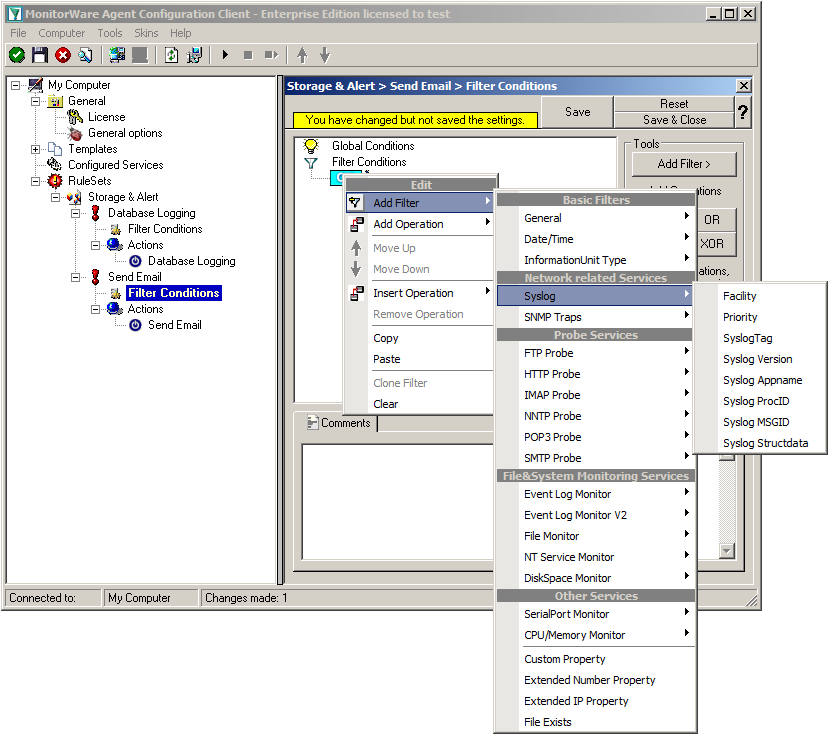
Right-click on the OR operator. A context menu will open. Go to Add Filter -> Syslog -> Priority.
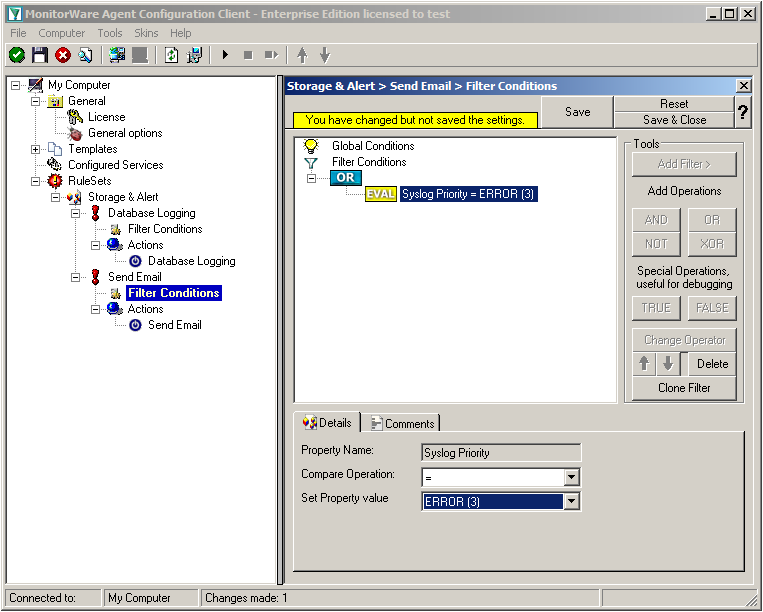
Click on the filter setting and change the property value to “Error (3)”.
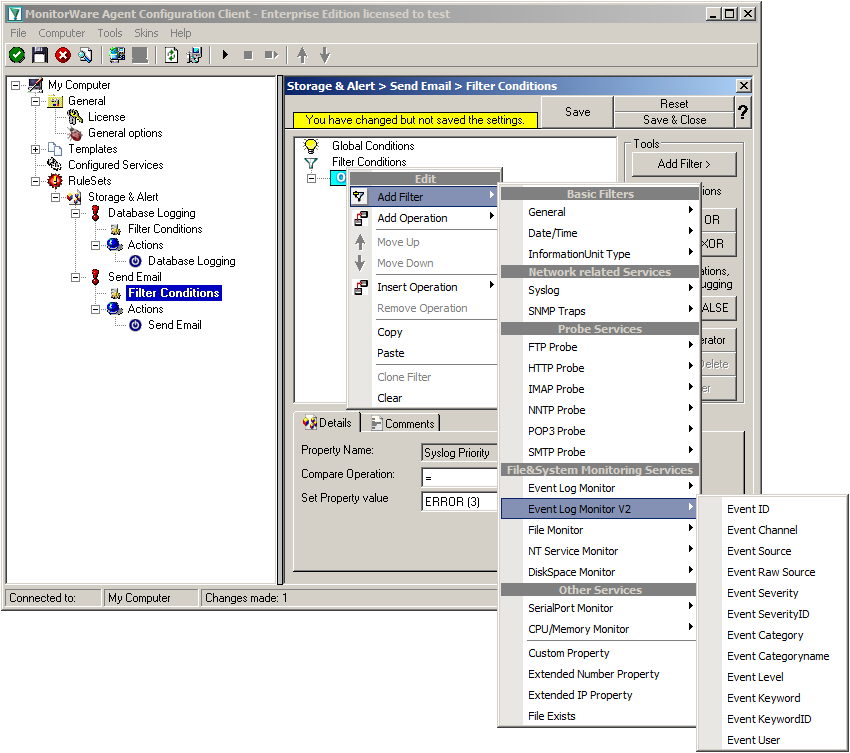
Again click on Add Filter -> EventLog Monitor V2 -> Event Severity.
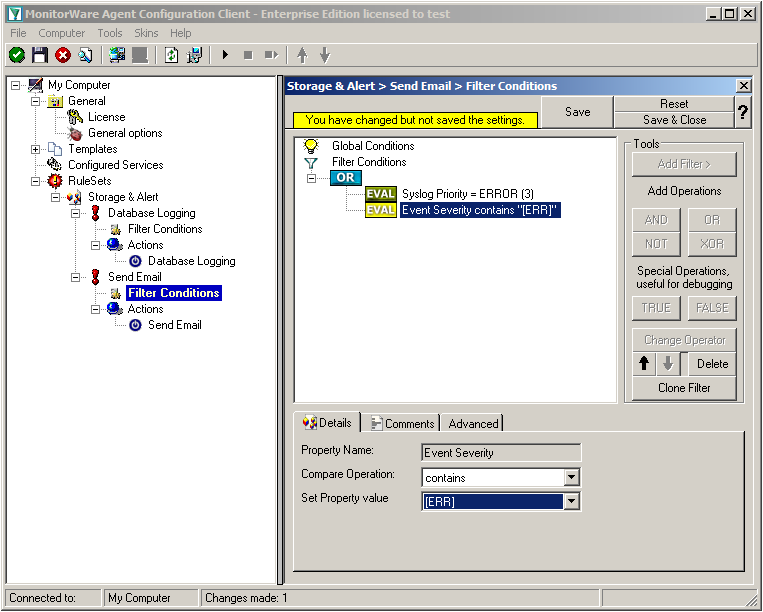
Click on the second filter setting and change the property value to “[ERR]”.
We are now finished with the filter settings. The filter will accept all log messages that are either of syslog proiority error or critical or Windows Event severity error. The OR operator ensures, that every of these cases will be accepted. When the messages are approved of fitting into the filter, the action will process them.
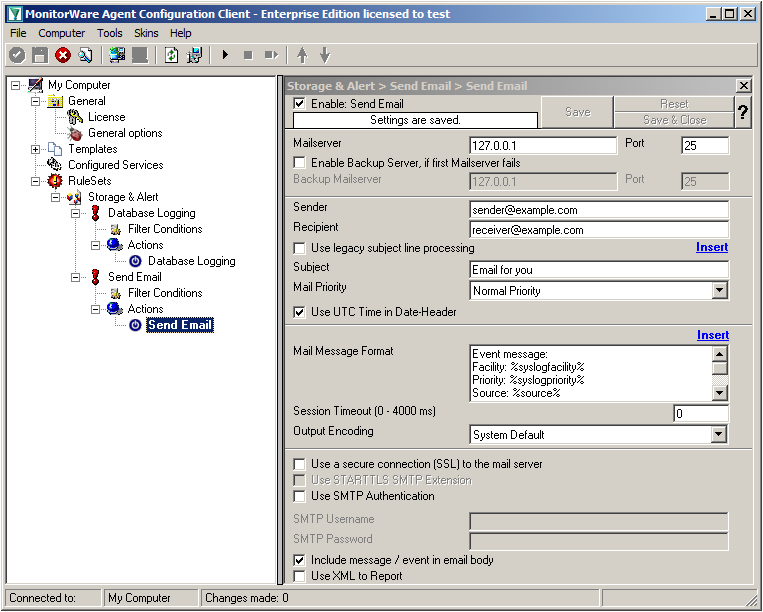
Click on the “Send Email” action now. You will see the configuration window on the right pane. Currently, there are only the default values in there.
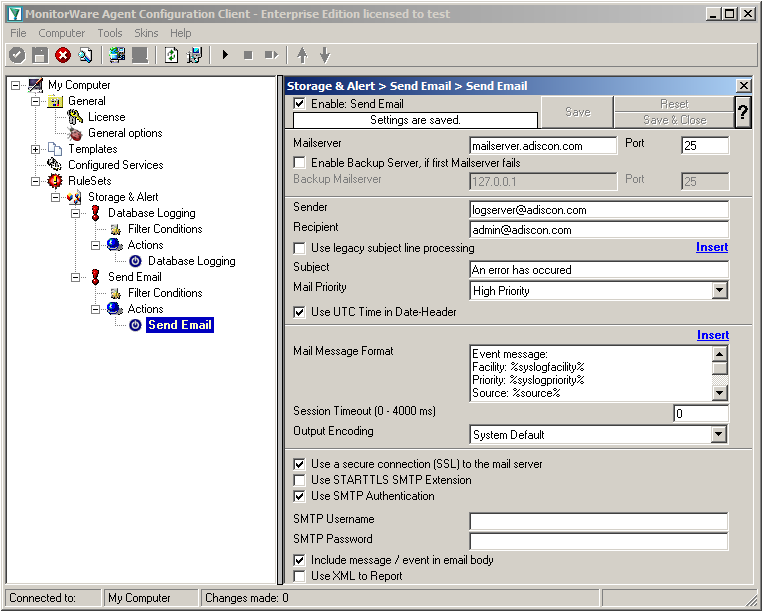
We need to change some settings here, like the Mailserver, Sender and Recipient, the subject and the Mail Priority. If necessary for your mail server, you need to change the authentification settings at the bottom as well. in our example we need SMTP Authentication for that. If you want, you could even enable the backup mail server.
Now we have all actions fully configured. It is now time to setup the configured services.
Currently, when clicking on Configured Services you will not see a thing. But we will configure the services now. Without them, MonitorWare Agent is not able to get any log messages. We will setup 2 Syslog Receiver, 1 EventLog Monitor and 1 File Monitor.
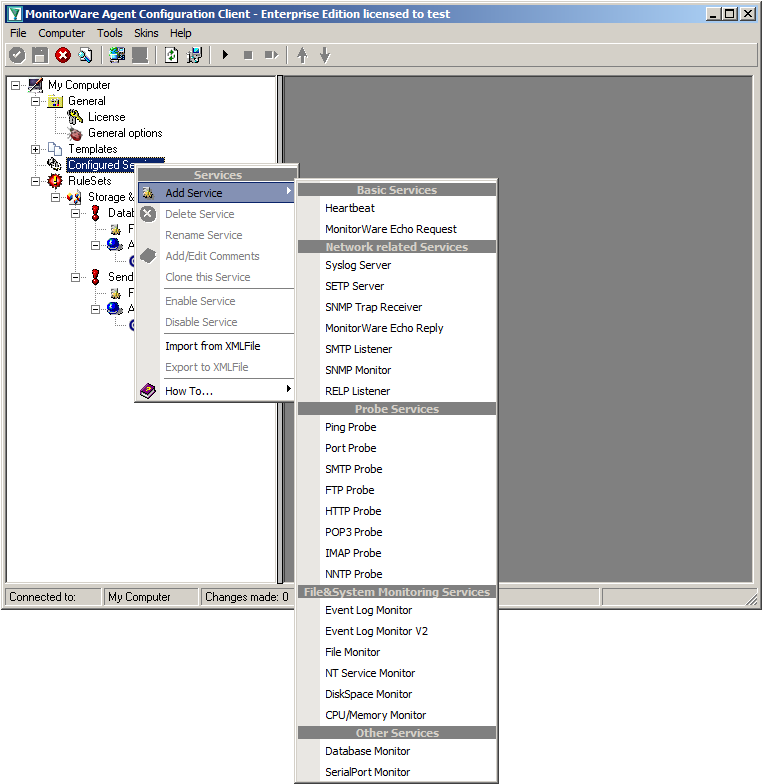
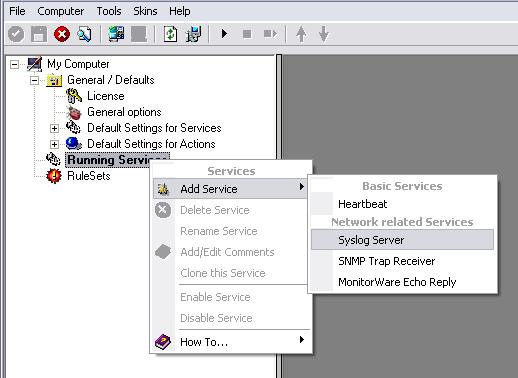
When right clicking on Configured Services a context-menu will open. By moving your cursor to “Add Service” you can see a list of Services, that may be configured. The list seems pretty long, but we basically need 3 services of them.
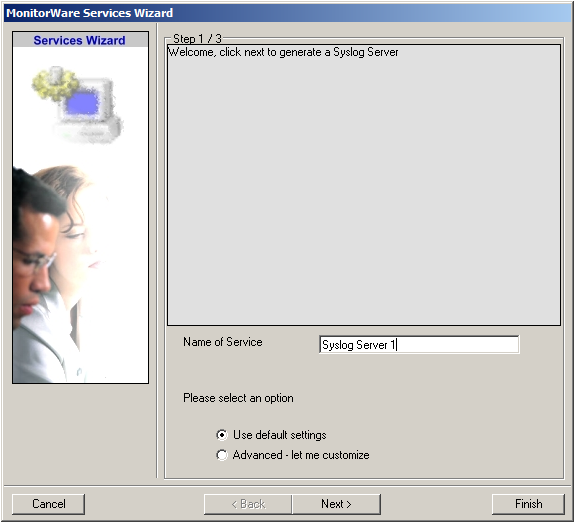
Click on “Syslog Server” first. The Services Wizard will open. Simply click on Finish for now. Repeat this again for Syslog Server, EventLogMonitor V2 and File Monitor.
In the end, you should have a list with 4 Services. For our example I renamed the services by doing a right-click on the Service name I wanted to change and the choosing “Rename Service”. This was mostly to distinct the two Syslog Servers.
Settings for Syslog Server UDP
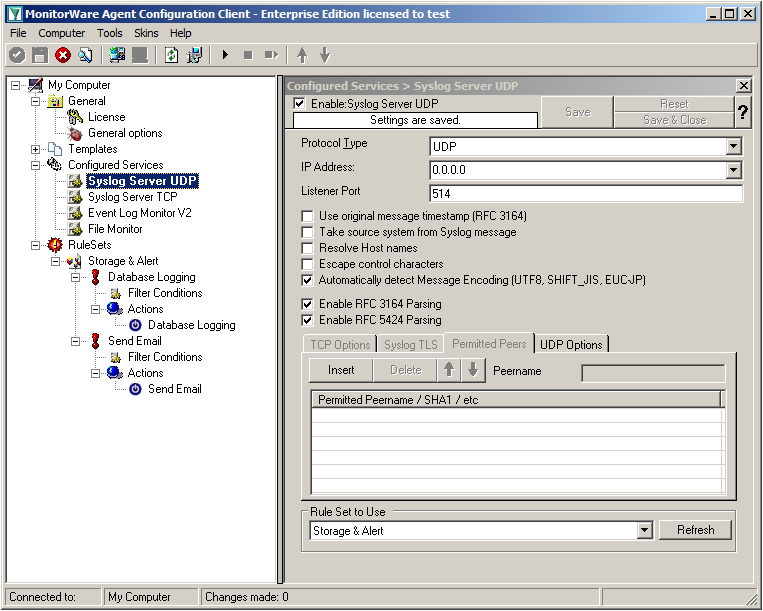
We can leave the “Syslog Server UDP” on default settings. It is already listening to UDP on port 514. The rest of the default settings is just fine.
Settings for Syslog Server TCP
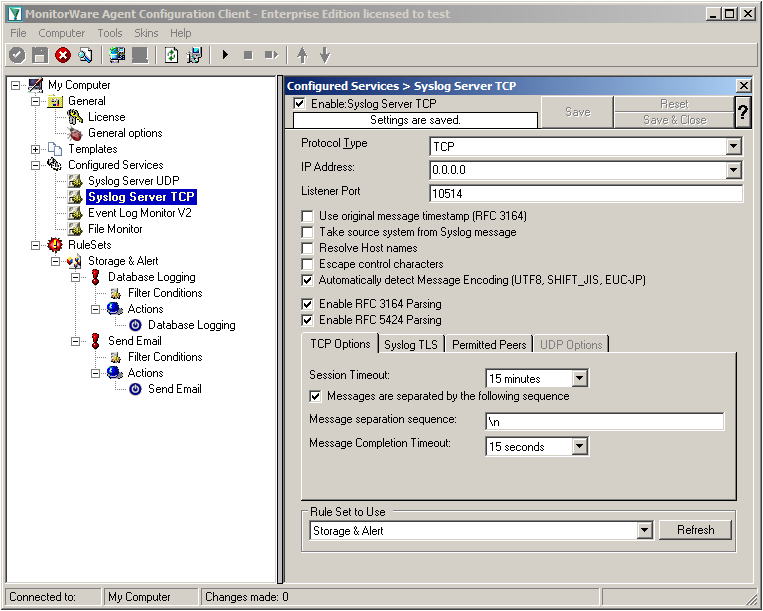
We will now go to the “Syslog Server TCP” now. Here we need to change several settings. Change the protocol type to TCP and the Listener Port to 10514. Further, we need to enable the option “Messages are separated by the following sequence” in the TCP options. It should look like this now:
Settings for Event Log Monitor V2
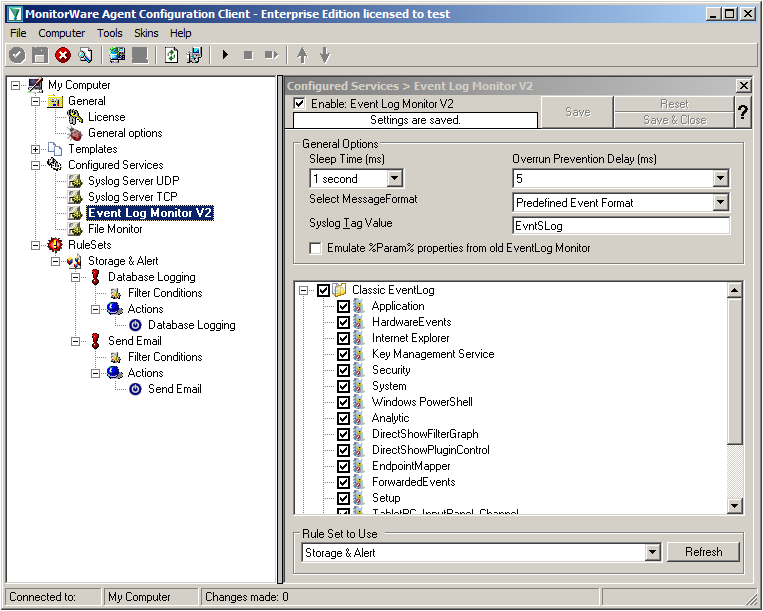
The Event Log Monitor V2 needs no additional setup. Again the default values are ok. If you want specific Event categories not to be stored, you can disable the options. But the basic format is sufficient.
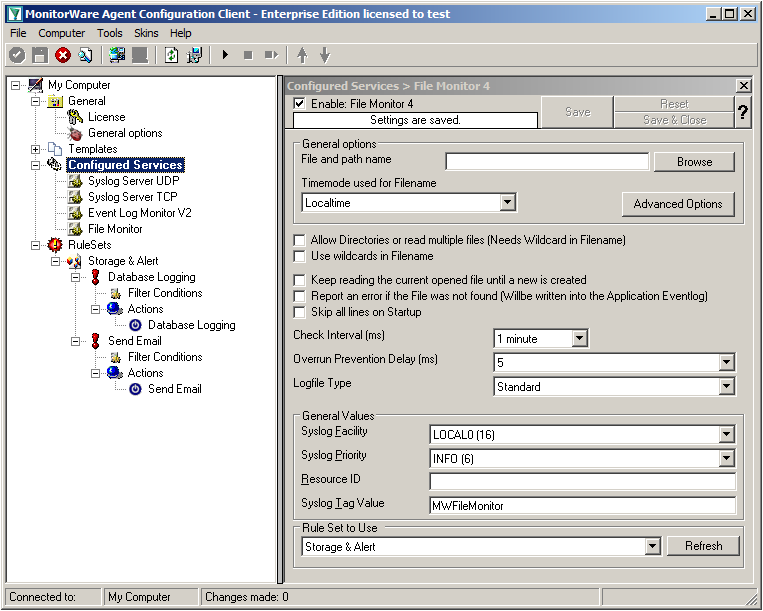
Settings for File Monitor
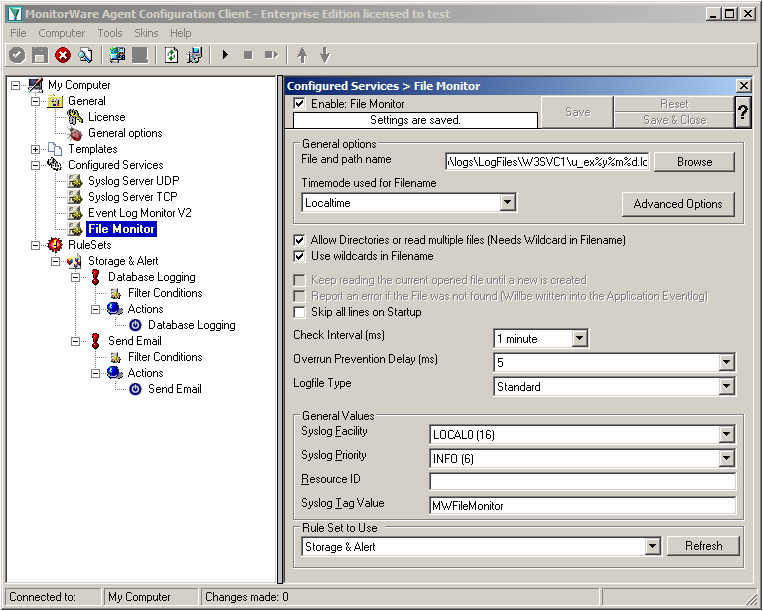
The File Monitor needs some additional settings. First, enable the option “Allow Directories or read multiple files”. You will see, that the use of wildcards will be automatically enabled and some other options completely being disabled.
Then we need to set the source files. For our example, we want to monitor the IIS logfiles. At the top of the File Monitor configuration you can see the option “File and path name”. There is a Browse button right next to it. Click it.
A windows explorer window will open, where you can choose the file you want to monitor. Navigate to the path C:\inetpub\logs\LogFiles\W3SVC1\. This is the location where the log files are stored. Please note, that the file location could be different when using another version of IIS. Choose the first file in the list. (Note: Daily Internet Information Server log files are named “u_exyymmdd.log”, with yy being the 2 digit year, mm the month and dd the day of month. To generate the same name with file monitor, use the following name “u_ex%y%m%d.log”.)
Set the Logfile Type to “W3C WebServer Logfile”.
Please note, that this step can be easily adapted for other log files (e.g. DHCP log files) as well.
We have now finished the configuration for our central server. It will now be able to receive syslog either via TCP (port 10514) or UDP (port 514), monitor the local Event Log as well as the IIS logfiles. Once more click the “Save” button to save the configuration (if not done already) and start the service. All log messages will now be stored into the database as they arrive/occur. Further, administrators will be alerted via email once an error occurs.
Created 2011-03-11 by Florian Riedl
This article will describe how to setup centralized logging in a hybrid environment. Basically, we will have various major steps, that show different configuration of several clients, which forward their log data to a central loghost. There, everything will be stored into a database and processed further for alerting.
To describe the situation basically, we want all machines on the network send their log data to a central syslog server (if possible). For the central log server we take a windows machine running MonitorWare Agent (www.mwagent.com). Here we can receive syslog, monitor local log files and the Windows EventLog. Data shall be stored into a database and several email alerts shall be configured. The other steps describe the configuration of simple Windows workstations and servers, as well as Linux servers.
For TCP transmission we will use port 514 (default) for UDP and port 10514 for TCP. We want to use TCP mainly, because it ensures the transmission of the syslog messages. This is due to UDP being connectionless and thus it can occur (and will) that messages get lost.
The Client machines in this example consist of several different types of machines. We have regular Windows Workstations. Here we will use EventReporter (www.eventreporter.com). In addition to our central server, we have some other Windows Servers which will get MonitorWare Agent as well and some Linux machines which have rsyslog (www.rsyslog.com) installed. These machines will send their log messages via TCP syslog to the central server.
Additionally to these clients, we will mention some other devices and appliances (just roughly), like firewalls, switches and routers.
This is the first and biggest step. We will configure the central server first. The reason is simple. If this is already running, we can setup the clients and it will directly start logging everything. We assume, this is a Windows Server where MonitorWare Agent is installed. The central log server shall provide the following functionality:
In step 2 we will set up the regular Windows clients. These are usually the workstations the people work on. We will use EventReporter here. It can pull all log messages from the Windows EventLog and forward them via TCP syslog. Thus the following functionality is mandatory:
Now we will configure the other Windows servers. Again, we will use MonitorWare Agent because it has the most functionality. We need the following functions to be setup here:
Now we get to the Linux servers. Here we need to use a completely different product – rsyslog. For a first-time user, this might look a bit strange. The configuration we want to have here needs the following:
This is rather just a note on other devices and appliances that are not yet covered. Often devices (like routers, firewalls or switches) have the possibility to send log data to a syslog server. Usually, this only works via UDP and some machines are even capable of sending logs via TCP. Since there is such a huge mass of different systems and devices, we cannot give correct steps for everything. Please refer to the user manual that came with the device or contact the manufacturer for information about how to configure the devices for sending syslog.
If you already know how to configure it, let it send it’s log messages to the central server on port 514 for UDP or (if possible) port 10514 for TCP.
We now have a setup that stores all the log data that machines on the network will generate to a central database for storage. Most of the clients on the network send their log data securely via TCP to the central log storage. Some machines were rather quick to set up, others needed more effort. Usually the effort rises with the amount of features that will be used. Thus we thought of this setup to be quite simple.
If you have any remarks or ideas of improvement for this guide, please let us know and send an email to info@adiscon.com.
Created 2008-10-06 by Florian Riedl
For storing IIS logs into a database you need MWAgent. With the help of this guide, we will show you, how to create a proper configuration for storing IIS logs into a given database structure. The main goal of this guide is to achieve, that the logs will be parsed after a given time of the day, when the database isn’t very busy anymore and then again stopping later to prevent the service from idling all the day.
Please Note: With this setup you are not able to constantly monitor the Windows Eventlog or receive syslog messages at all times.
First, create a new RuleSet for storing data into the database. You can simply follow this guide: Creating a Rule Set for Database Logging. Use your own settings of the database for this part.
Then create your Filemonitor and point it to the location of your IIS Logfile which you want to monitor. For the basic setup follow this guide: How To setup File Monitor Service. For in-depth configuration, please go on.
(Note: Daily Internet Information Server log files are named “exyymmdd.log”, with yy being the 2 digit year, mm the month and dd the day of month. To generate the same name with file monitor, use the following name “ex%y%m%d.log”.)
Set the Logfile Type to “W3C WebServer Logfile”, set the Check Interval to “1 day” and assign it to your newly created RuleSet.
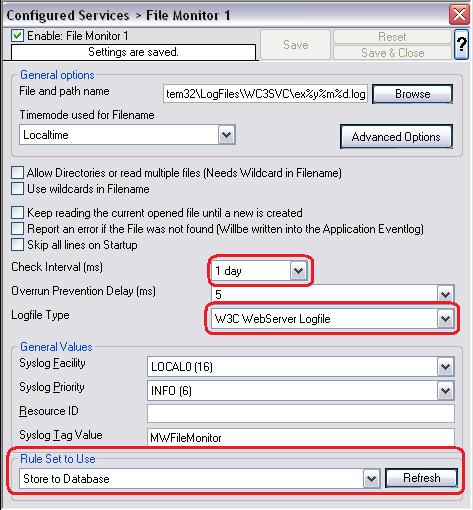
Figure 1: Configuring the Filemonitor
We have now already created the configuration we need for our goal to be achieved. We now need to determine the correct time to start the service and again to stop it.
We will start and stop the service via Scheduled Tasks. But before we create the tasks, we have to do a little bit configuration to the service itself. Therefore, go to the services panel. Press the Windows-button + R and type services.msc into the field and hit enter.
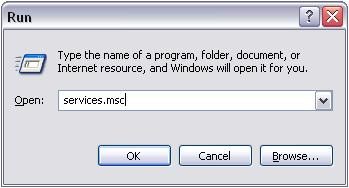
Figure 2: Type services.msc into the Run-Windows
After this, the services panel will open. Double-click on the service AdisconMonitoreWareAgent to open up it’s properties and change the Startup Type to “Manual”.
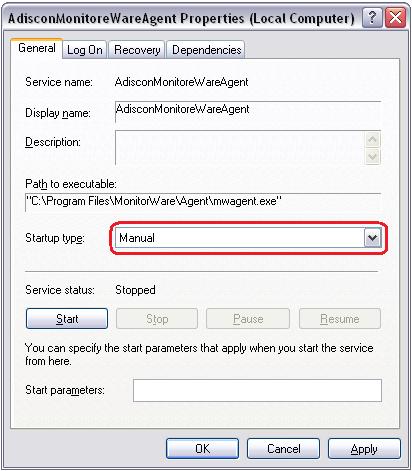
Figure 3: Change Service Properties
After you have done this, confirm the changes and close the Service Properties as well as the Service Panel.
Now we can create the Scheduled Task to start the service. Go to the Control Panel and select Scheduled Tasks. You can create a new Task by double-clicking on “Add Scheduled Task”. Simply follow the wizard as I show it.
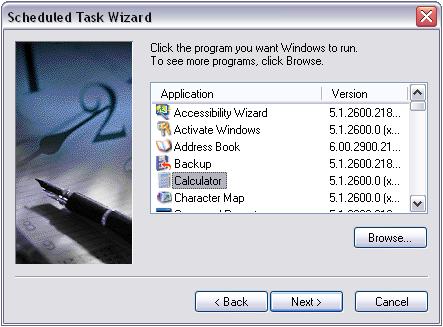
Figure 4: Select Application
The first screen of the wizard is of no concern. Simply hit “Next”. Then we shall choose an application. We could browse for any .exe file, but this does not matter, as we have to change all details later anyway. Because of this, I chose the Calculator.
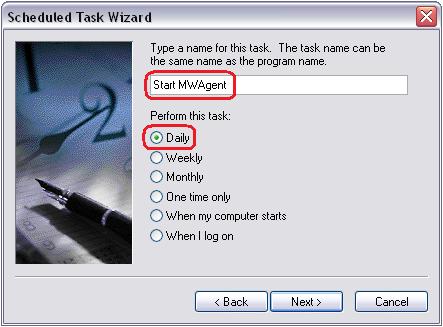
Figure 5: Select Name and Interval
The second Step is to choose a name with which the Task will be stored and an interval in which it should be run. For this example, I chose to run it daily. The reason for this is, that we want to submit the log data to the database on a daily basis. This can be changed later if necessary.

Figure 6: Detailed Startup Setup
On the next screen we can be a more precise with the interval configuration. I set the starting time to 5:00 AM. This will start the Task each day at the same time.
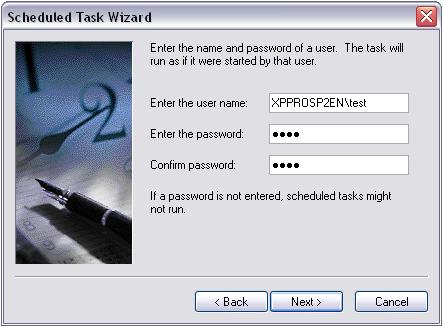
Figure 7: Account details
Here we have to insert the account details with which the Task needs to be run. Please note, that this has to be an account with administrative privileges. Else the service won’t start.
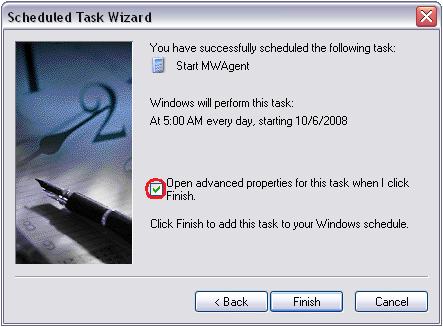
Figure 8: Finish the Configuration Wizard
Finally, we have reached the end of the configuration wizard. Please check the box to open the advanced properties for this task right after finishing the wizard. Then we can complete the setup. If you missed to check the box, simply double-click on the newly created Task in the list to open the properties.
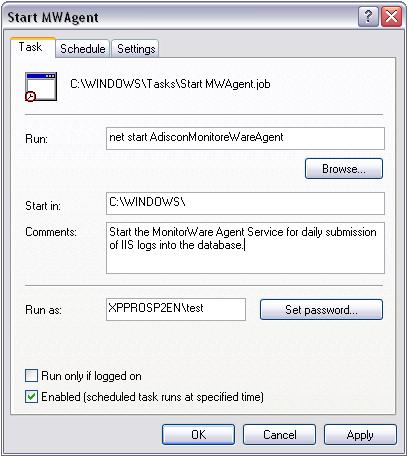
Figure 9: Detail Configuration
Now we only have to finish the last step for this Task. We need to change the run command. Instead of calling the calculator.exe we now insert “net start AdisconMonitoreWareAgent” (without the quotes). This command will start the service. Please Note: Check and see if you wrote the Service name correctly, as shown in the screenshot. If you are unsure, check the name in the Services Panel.
Now that we have created a Task for starting the MonitorWare Agent service, we need a task to stop it as well. Please note: This Step is only necessary if you do NOT want the service to idle all day. If you do not care about this, it doesn’t matter, because MonitorWare Agent is configured to check the log files every 24h anyway.
Please repeat the Steps 4.1 to 4.6 with the following changes:

Figure 10: Select Name and Interval
In the second Step, you need to choose a different name of course. This will help you to keep an eye over those Tasks and not mix them up.
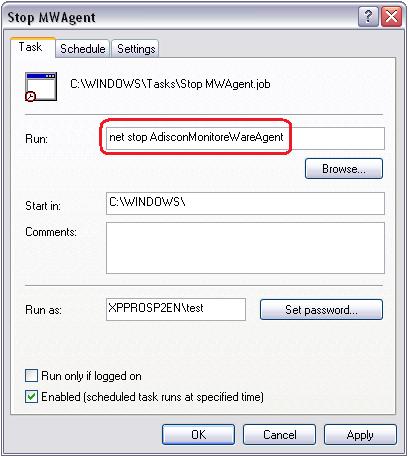
Figure 11: Detail Configuration
In the detail configuration, the command has to be different as well. Instead of the parameter “start” we need to use “stop”. Very self-explanatory.
This concludes this guide. If you have any remarks or suggestions, feel free to contact us. Your feedback is very welcome.
Article created 2005-04-05 by Hamid Ali Raja.
Last Updated 2007-01-16 by Florian Riedl.
This is a very quick step-by-step guide. It essentially is a step in multiple configurations. You can refer to this guide whenever you need to add database logging to one of your services.
To define a new rule set, right click “Rules”. A pop up menu will appear. Select “Add Rule Set” from this menu.
Then, a wizard starts. Change the name of the rule set to whatever name you like. We will use “Database Logging” in this example. The screen looks as follows:
Click “Next”. A new wizard page appears:
Select only Database Logging. Do not select any other options for this sample. Also, leave the “Create a Rule for each of the following actions” setting selected. Click “Next”. You will see a confirmation page. Click “Finish” to create the rule set.
The wizard closes and the client shows a newly created rule set.
As you can see, the new Rule Set “Database Logging” is present. Please expand it in the tree view until the action level of the “Database Logging” Rule and select the “Database Logging” action to configure.
Now click on the Data Sources (ODBC) Button to open the ODBC Data Source Administrator. No click on the System DSN tab and click the Add button to add a new System-DSN (Select the Microsoft Access driver like in the screenshot below).
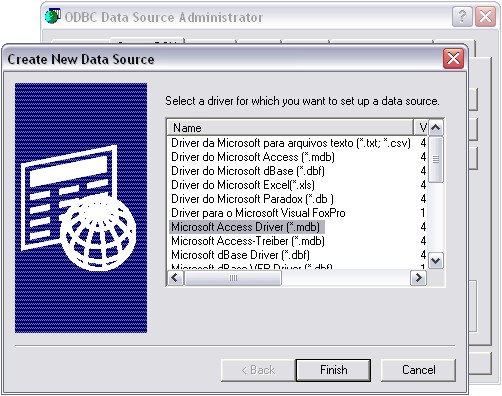
In the next step, click the Select button and go to the Monitorware Agent installation directory (Usually C:\program files\MonitorWare\Agent\) and choose the sample database called sample97.mdb. After that name the new DSN with “MyDatabaseDSN” like in the following screenshot and press OK.
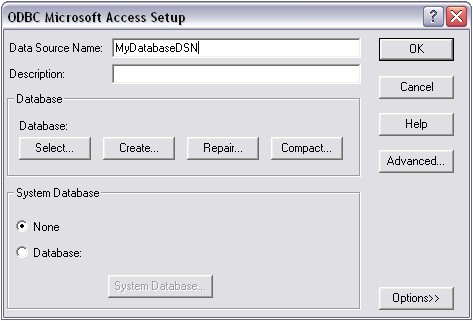
Now close the ODBC Data Source Administrator and switch back to the Monitorware Agent Client and insert MyDatabaseDSN in the DSN field. Leave all other settings in their default.
This finishes the setup for a simple Action for Database Logging.
Article updated 2006-06-19 by Timm Herget.
This guide helps you to add database logging to any of your services available in MonitorWare Agent 4.0.
Microsoft SQL Enterprise Manager
1. To create a new Database, open up the Microsoft SQL Enterprise Manager.
2. Right-click on “Databases” and select “New Database”.
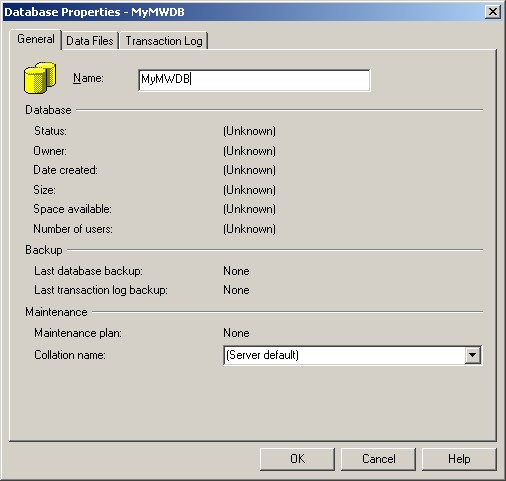
3. Select a Database Name there and click “OK”.
ODBC Data Source Administrator
After you created the new Database, go to the Control Panel -> Administrative Tools and open up “Data Sources (ODBC)”. The following Window will appear:
4. Click on “System DSN” and then “Add…”.
5. Select “SQL Server” as Driver from the List and click “Finish”.
6. Choose a Datasource Name, Description and select the Server where the Database is. In our example we use “localhost”. Click on “Next”.
7. Select “SQL Server Authentication” and type in your MSSQL Login ID and Password. Click on “Next”.
8. Select “Change the default Database to:” and choose your new created Database, in our example we use “MyMWDB”. Click on “Next”.
9. Leave all at default settings and click “Finish”, a test Window will appear:
10. Click on “Test Data Source”, normally the following Window should be displayed:
11. If not, go back and check your Settings, if yes, Click “OK” and exit the System-DSN Wizard.
MonitorWare Agent 4.0
12. To define a new rule set, right click “RuleSets”. A pop up menu as shown below appears. Select “Add Rule Set” from this menu.
13. Then, a wizard starts. Change the name of the rule set to whatever name you like. We will use “Database Logging” in this example. The screen looks as follows:

14. Click “Next”. A new wizard page appears:
15. Select only Database Logging. Do not select any other options for this sample. Also, leave the “Create a Rule for each of the following actions” setting selected. Click “Next”. You will see a confirmation page. Click “Finish” to create the rule set.
16. The wizard closes and the client shows a newly created rule set.

17. As you can see, the new Rule Set “Database Logging” is present. Please expand it in the tree view until the action level of the “Database Logging” Rule and select the “Database Logging” action to configure.
You will see the following Window now:
18. Type in your DSN, User-ID and Password now and press “Save”.
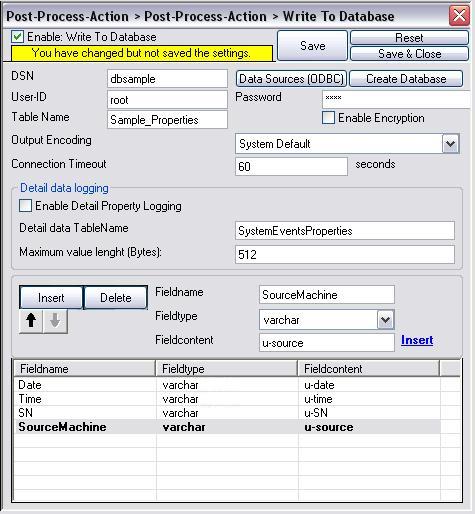
19. Click on the “Create Database” Button and you are shown a pop up screen as shown below:
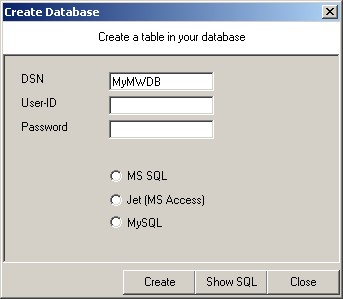
Here you can specify the required fields and click on create button to get it all done.