Store IIS Logfiles into a Database
Created 2008-10-06 by Florian Riedl
For storing IIS logs into a database you need MWAgent. With the help of this guide, we will show you, how to create a proper configuration for storing IIS logs into a given database structure. The main goal of this guide is to achieve, that the logs will be parsed after a given time of the day, when the database isn’t very busy anymore and then again stopping later to prevent the service from idling all the day.
Please Note: With this setup you are not able to constantly monitor the Windows Eventlog or receive syslog messages at all times.
Step 1
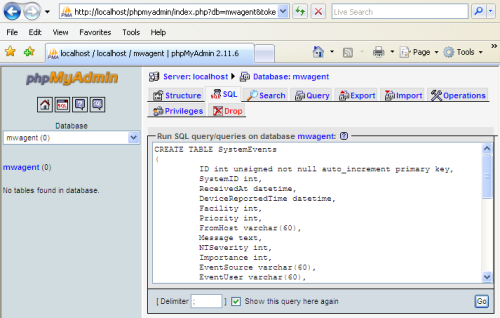
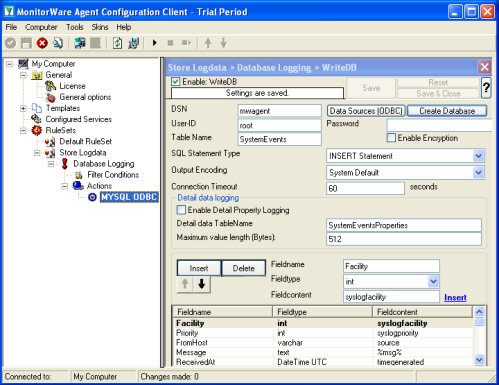
First, create a new RuleSet for storing data into the database. You can simply follow this guide: Creating a Rule Set for Database Logging. Use your own settings of the database for this part.
Step 2
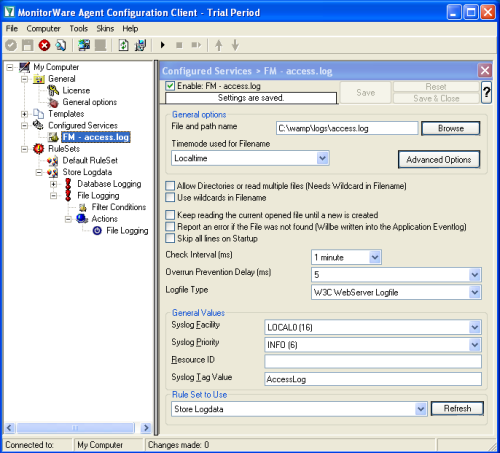
Then create your Filemonitor and point it to the location of your IIS Logfile which you want to monitor. For the basic setup follow this guide: How To setup File Monitor Service. For in-depth configuration, please go on.
(Note: Daily Internet Information Server log files are named “exyymmdd.log”, with yy being the 2 digit year, mm the month and dd the day of month. To generate the same name with file monitor, use the following name “ex%y%m%d.log”.)
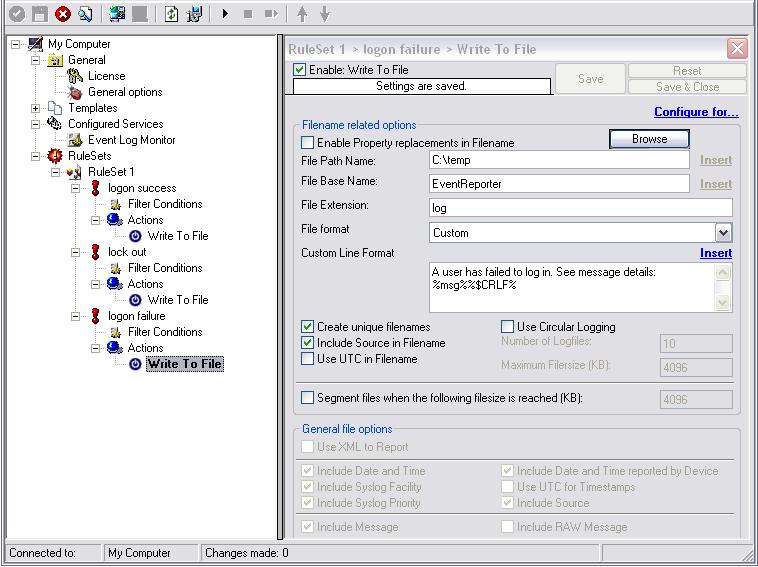
Set the Logfile Type to “W3C WebServer Logfile”, set the Check Interval to “1 day” and assign it to your newly created RuleSet.
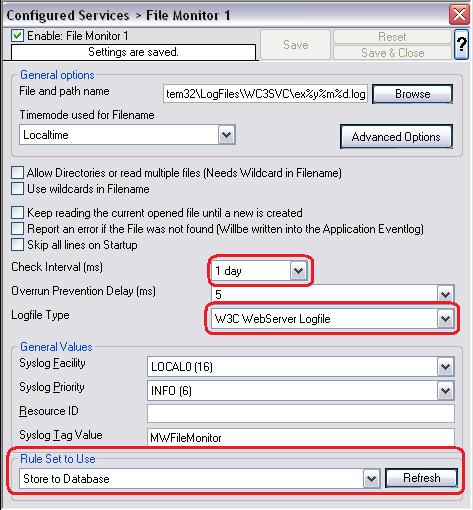
Figure 1: Configuring the Filemonitor
We have now already created the configuration we need for our goal to be achieved. We now need to determine the correct time to start the service and again to stop it.
Step 3
We will start and stop the service via Scheduled Tasks. But before we create the tasks, we have to do a little bit configuration to the service itself. Therefore, go to the services panel. Press the Windows-button + R and type services.msc into the field and hit enter.
Step 3.1
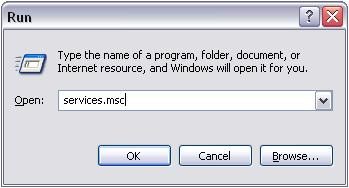
Figure 2: Type services.msc into the Run-Windows
Step 3.2
After this, the services panel will open. Double-click on the service AdisconMonitoreWareAgent to open up it’s properties and change the Startup Type to “Manual”.
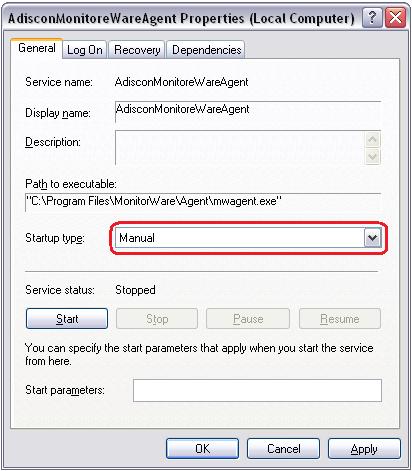
Figure 3: Change Service Properties
After you have done this, confirm the changes and close the Service Properties as well as the Service Panel.
Step 4
Now we can create the Scheduled Task to start the service. Go to the Control Panel and select Scheduled Tasks. You can create a new Task by double-clicking on “Add Scheduled Task”. Simply follow the wizard as I show it.
Step 4.1
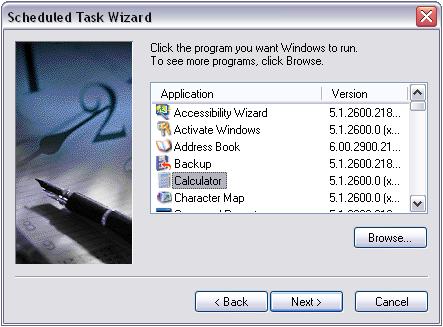
Figure 4: Select Application
The first screen of the wizard is of no concern. Simply hit “Next”. Then we shall choose an application. We could browse for any .exe file, but this does not matter, as we have to change all details later anyway. Because of this, I chose the Calculator.
Step 4.2
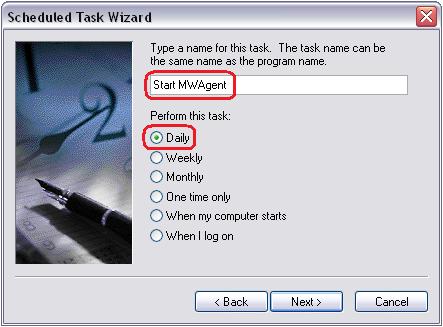
Figure 5: Select Name and Interval
The second Step is to choose a name with which the Task will be stored and an interval in which it should be run. For this example, I chose to run it daily. The reason for this is, that we want to submit the log data to the database on a daily basis. This can be changed later if necessary.
Step 4.3

Figure 6: Detailed Startup Setup
On the next screen we can be a more precise with the interval configuration. I set the starting time to 5:00 AM. This will start the Task each day at the same time.
Step 4.4
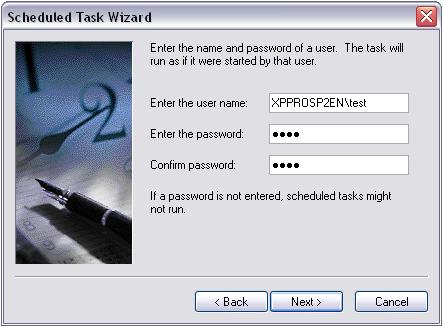
Figure 7: Account details
Here we have to insert the account details with which the Task needs to be run. Please note, that this has to be an account with administrative privileges. Else the service won’t start.
Step 4.5
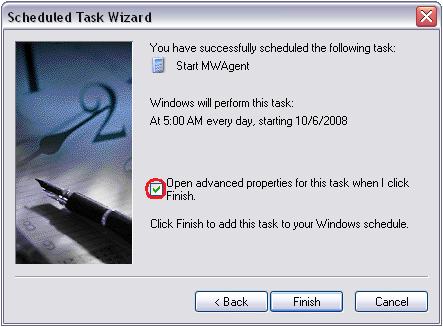
Figure 8: Finish the Configuration Wizard
Finally, we have reached the end of the configuration wizard. Please check the box to open the advanced properties for this task right after finishing the wizard. Then we can complete the setup. If you missed to check the box, simply double-click on the newly created Task in the list to open the properties.
Step 4.6
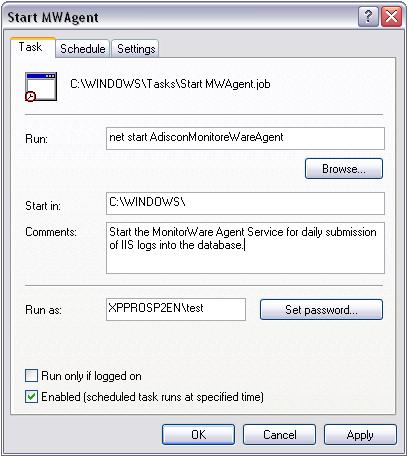
Figure 9: Detail Configuration
Now we only have to finish the last step for this Task. We need to change the run command. Instead of calling the calculator.exe we now insert “net start AdisconMonitoreWareAgent” (without the quotes). This command will start the service. Please Note: Check and see if you wrote the Service name correctly, as shown in the screenshot. If you are unsure, check the name in the Services Panel.
Step 5
Now that we have created a Task for starting the MonitorWare Agent service, we need a task to stop it as well. Please note: This Step is only necessary if you do NOT want the service to idle all day. If you do not care about this, it doesn’t matter, because MonitorWare Agent is configured to check the log files every 24h anyway.
Please repeat the Steps 4.1 to 4.6 with the following changes:
Step 5.1

Figure 10: Select Name and Interval
In the second Step, you need to choose a different name of course. This will help you to keep an eye over those Tasks and not mix them up.
Step 5.2
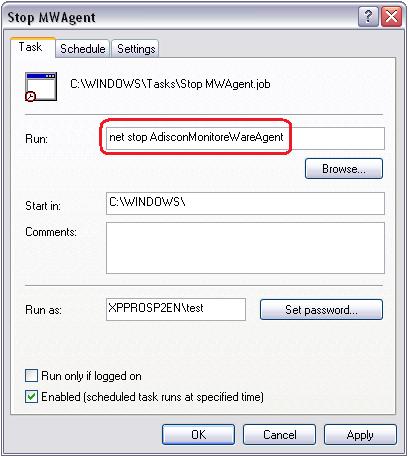
Figure 11: Detail Configuration
In the detail configuration, the command has to be different as well. Instead of the parameter “start” we need to use “stop”. Very self-explanatory.
This concludes this guide. If you have any remarks or suggestions, feel free to contact us. Your feedback is very welcome.


 After you downloaded WAMP, start the installation and follow the instructions.

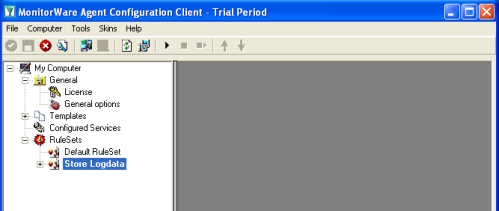 Start MonitorWare Agent Client, and skip the First Startup Wizard.
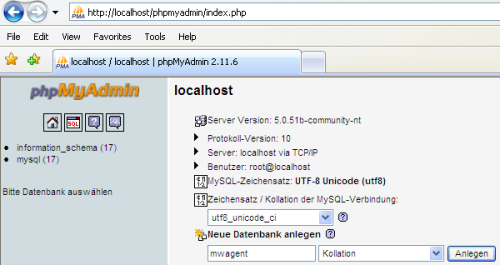
 From the MonitorWare Agent configuration point of view, everything is setup now. So kindly start the MonitorWare Agent Service and wait a few moments, so that the data can be processed.
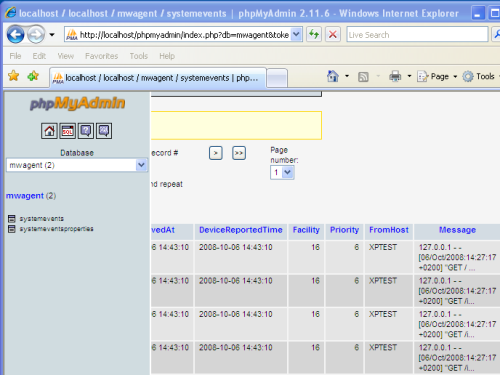
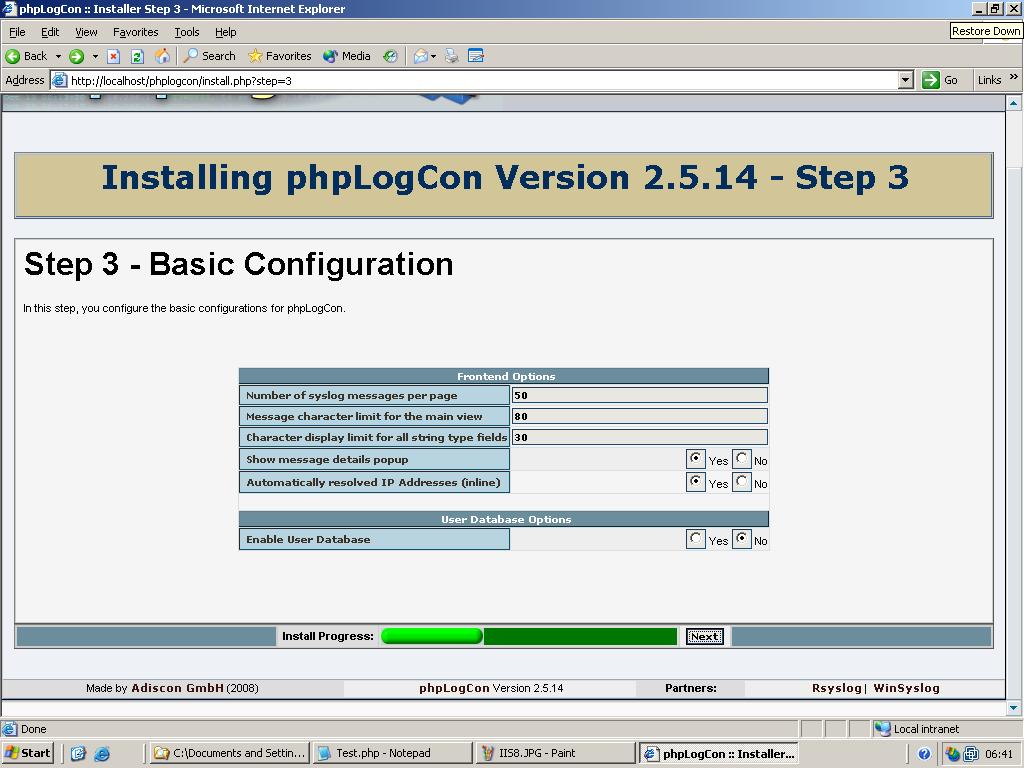
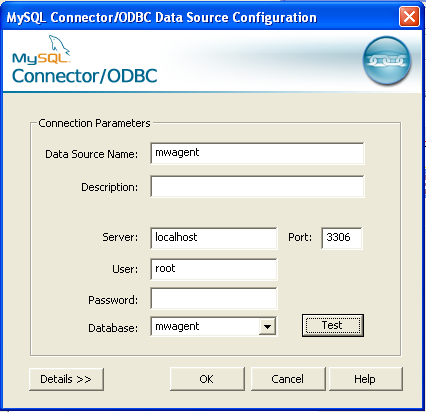
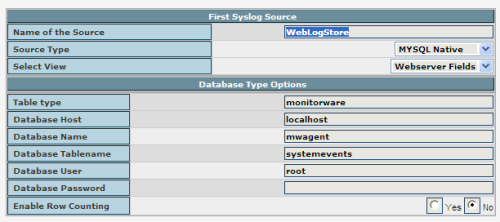 If you are using MYSQL to store log messages and you have reached Step 7, switch the source type to “MYSQL Native” and name the Source “WebLogStore DB” Use “mwagent” as Database Name and “root” as Database User. Leave the other configuration variables as they are, see the screenshot for how it should look like. Then click on the Next button to finish the installation.
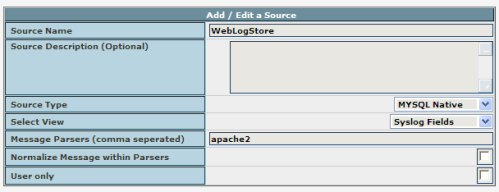 After you finished the Installation of phpLogCon, you need to login and switch to the sources admin and configure the source “WebLogStore DB” there.
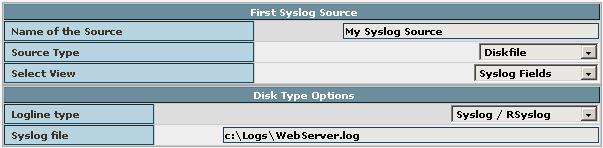
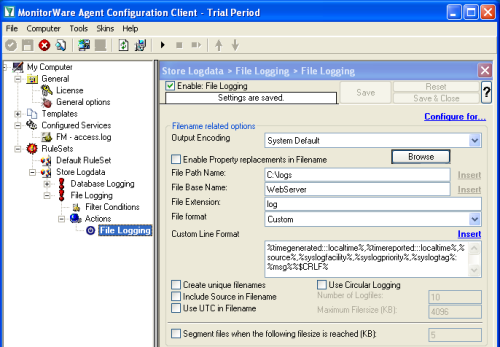
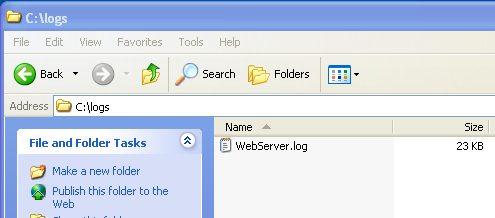
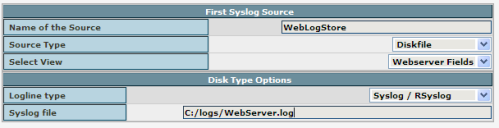 If you are using file logging and you have reached Strep 7, switch the source type to “Diskfile” and name the Source “WebLogStore FILE” Use “C:/logs/WebServer.log” as syslog file. Leave the other configuration variables as they are, see the screenshot for how it should look like. Then click on the Next button to finish the installation.
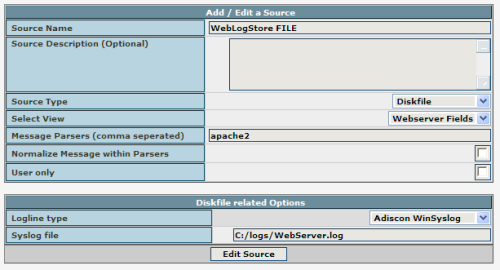 After you finished the Installation of phpLogCon, you need to login and switch to the sources admin and configure the source “WebLogStore FILE” there.