Client Tools
There are tools within the configuration client that you can use to test certain services or debug the application in general. Some can be found in the Tools menu.
Syslog Test Message
Opens a new windows which can send syslog test messages to Syslog Servers. This can also be opened within the configuration window of a Syslog service.
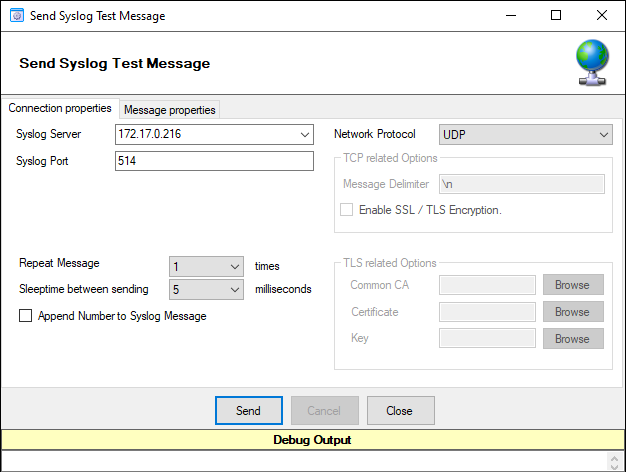
Syslog Test Message Connection properties - UDP*
- Syslog server
The hostname or ip address of the target Syslog server.
- Syslog Port
The port that should be used to connect to the target Syslog server.
- Repeat Message
How often you want to repeat the test message. Can be configured from 1 to 1000.
- Sleeptime between sending
When using TCP, you can use 0ms. For UDP we recommend 1-5ms as sleeptime between sending syslog messages. Otherwise package loss can happen.
- Append Number to Syslog Message
If sending multiple messages, enable this option in order to add a syslog number at the end of the message.
- Network Protocol
Which network protocol should be used, either UDP or TCP can be selected.
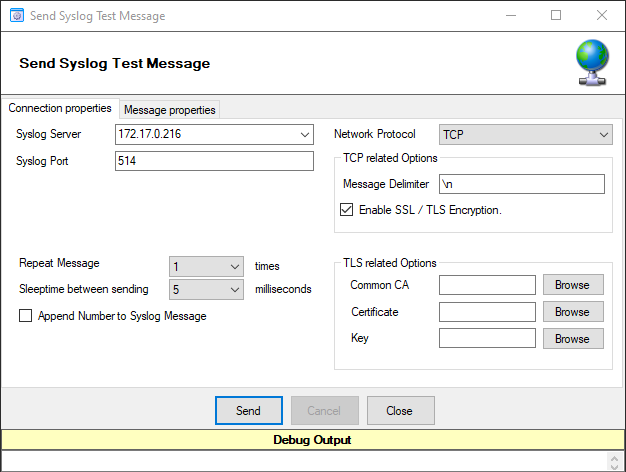
Syslog Test Message Connection properties - TCP*
- Message Delimiter (TCP related Options)
When using TCP protocol, a message delimiter (separator) can be configured which is a simple linefeed by default.
- Enable SSL/TLS Encryption (TCP related Options)
Check this option to enable the TLS related Options.
- TLS related Options (TCP related Options)
Select common CA: Select the certificate from the common Certificate Authority (CA), the syslog receiver should use the same CA.
Select Certificate: Select the client certificate (PEM Format).
Select Key: Select the keyfile for the client certificate (PEM Format).
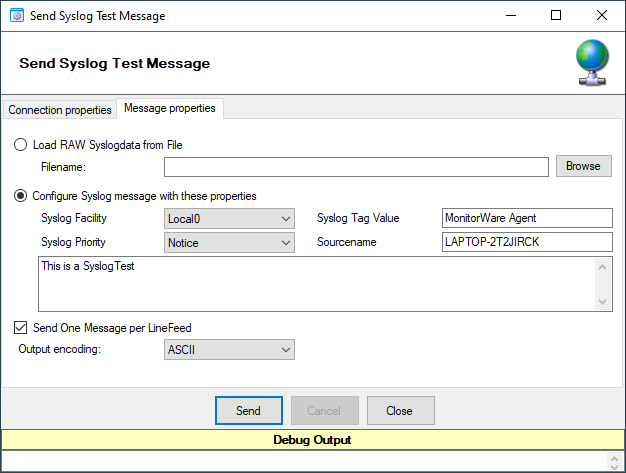
Syslog Test Message Message properties*
- Load RAW Syslogdata from File
You can choose to load raw syslogdata from file using this option. When loading UTF8 data make sure to set the Output encoding format from ASCII to UTF8. And if your file contains multiple syslog messages make sure that - Send One Message per LineFeed - is checked.
- Configure Syslog message with these properties
Choose this if you want to configure all properties of the syslog message manually.
- Send one Message per LineFeed
Check if your syslogdata contains multiple syslog messages divided by linefeeds
- Output encoding
Select the Output encoding you wish to use. When using UTF8, the UTF8 BOM is automatically prepended.
Passive Syslog Receiver
Opens a new windows to test Passive Syslog Servers. This can also be opened within the configuration window of a Passive Syslog service.
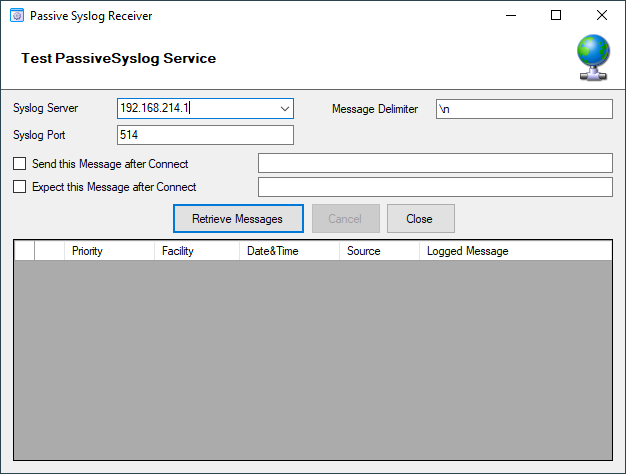
Test Passive Syslog Service*
- Syslog server
The hostname or ip address of the target passive Syslog server.
- Syslog Port
The port that should be used to connect to the target passive Syslog server.
- Message Delimiter
The message delimiter (separator) used to split syslog messages which is a simple linefeed by default.
- Send this Message after Connect
If required, configure a custom message that is send to the server after connect.
- Expect this Message after Connect
If required, configure a custom message that is expected by the sender when the server response to our custom message.
Network Discovery
Opens up a Wizard that will help you discover devices in your local network. Once the wizard has scanned your network, it will show Windows compatible devices it has found. Please note that this will require Windows Management Instrumentation (WMI) access to the remote machines which may be disabled in Windows Firewalls by default.
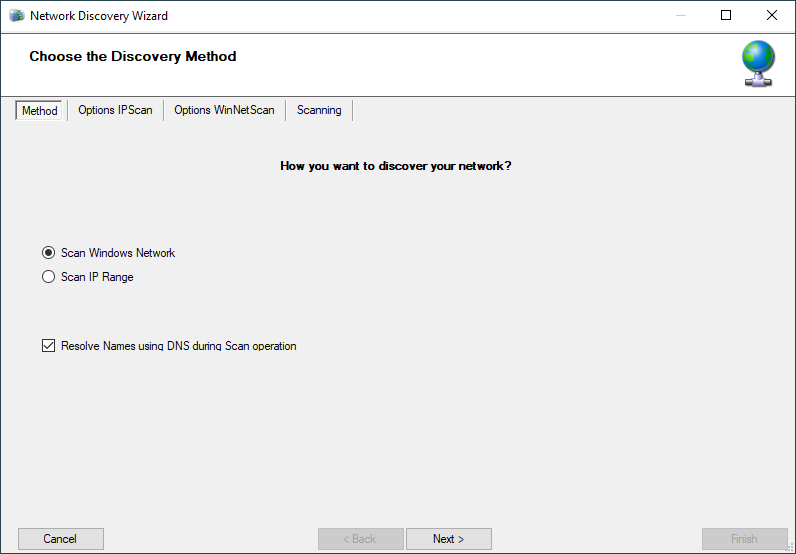
Network Discovery - Choose the discovery Methode*
Kill Service
When stopping a service, and it does not shutdown in the time period, you can use this function to forcefully stop the service. The service process will be killed if possible.
DebugLog
The DebugLog Button will be available if Debug Logging is enabled in your Debug Options
DebugLog*
When clicked, a new Logviewer window will be opened. The Debug Logviewer can load, parse, and analyze debug log-files from the service.
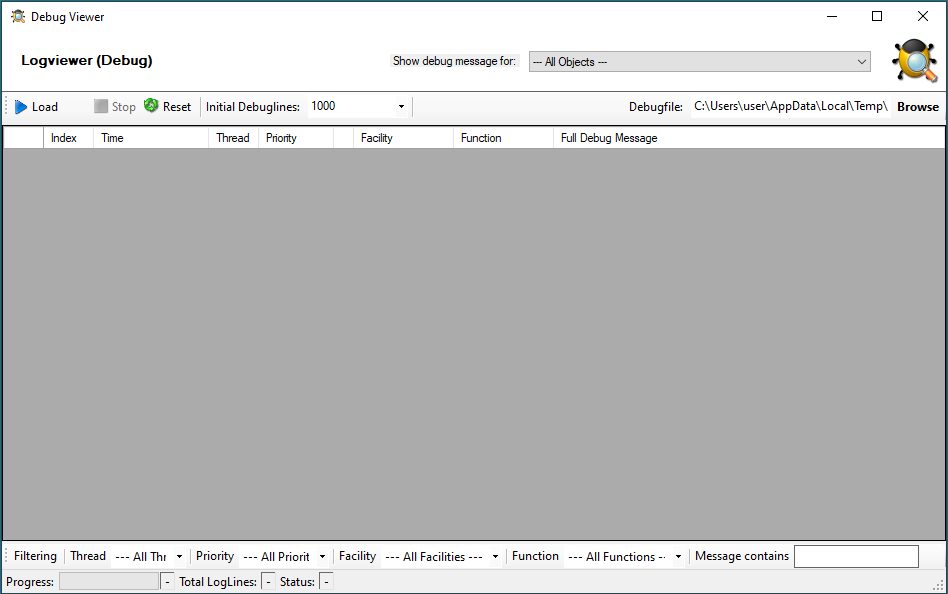
Logviewer (Debug)*
- Debugfile
Will automatically be set to your configured debug file. You can also choose other saved debug-files for analysis.
- Load
When Load is clicked, the Logviewer will load lines as configured in the initial debug-lines field. When loading all log-lines on a large debug log-file, this may take a while. While the Load button is grayed out, the Logviewer will continue to read data from the debug log as it is being written.
- Stop
Stop continuous loading of the debug log.
- Reset
Will reset all loaded log-lines from memory and clear the debug data-grid.
- Init Debuglines
The amount of log-lines you want to read the first time.
- Show debug messages for
Once the debug-log is processed, the Logviewer will automatically add filters for objects like services, rulesets, rules, and actions. You can use this select box to filter by them.
- Filtering (bottom bar)
At the bottom of the Logviewer window, you can filter the debug-log for Thread (ID), Priority, internal Facility, and Functions. You can also filter for words or word sequences. The view will automatically be refreshed once you changed a filter.